RSI Weighted Trend System I [InvestorUnknown]The RSI Weighted Trend System I is an experimental indicator designed to combine both slow-moving trend indicators for stable trend identification and fast-moving indicators to capture potential major turning points in the market. The novelty of this system lies in the dynamic weighting mechanism, where fast indicators receive weight based on the current Relative Strength Index (RSI) value, thus providing a flexible tool for traders seeking to adapt their strategies to varying market conditions.
Dynamic RSI-Based Weighting System
The core of the indicator is the dynamic weighting of fast indicators based on the value of the RSI. In essence, the higher the absolute value of the RSI (whether positive or negative), the higher the weight assigned to the fast indicators. This enables the system to capture rapid price movements around potential turning points.
Users can choose between a threshold-based or continuous weight system:
Threshold-Based Weighting: Fast indicators are activated only when the absolute RSI value exceeds a user-defined threshold. Below this threshold, fast indicators receive no weight.
Continuous Weighting: By setting the weight threshold to zero, the fast indicators always receive some weight, although this can result in more false signals in ranging markets.
// Calculate weight for Fast Indicators based on RSI (Slow Indicator weight is kept to 1 for simplicity)
f_RSI_Weight_System(series float rsi, simple float weight_thre) =>
float fast_weight = na
float slow_weight = na
if weight_thre > 0
if math.abs(rsi) <= weight_thre
fast_weight := 0
slow_weight := 1
else
fast_weight := 0 + math.sqrt(math.abs(rsi))
slow_weight := 1
else
fast_weight := 0 + math.sqrt(math.abs(rsi))
slow_weight := 1
Slow and Fast Indicators
Slow Indicators are designed to identify stable trends, remaining constant in weight. These include:
DMI (Directional Movement Index) For Loop
CCI (Commodity Channel Index) For Loop
Aroon For Loop
Fast Indicators are more responsive and designed to spot rapid trend shifts:
ZLEMA (Zero-Lag Exponential Moving Average) For Loop
IIRF (Infinite Impulse Response Filter) For Loop
Each of these indicators is calculated using a for-loop method to generate a moving average, which captures the trend of a given length range.
RSI Normalization
To facilitate the weighting system, the RSI is normalized from its usual 0-100 range to a -1 to 1 range. This allows for easy scaling when calculating weights and helps the system adjust to rapidly changing market conditions.
// Normalize RSI (1 to -1)
f_RSI(series float rsi_src, simple int rsi_len, simple string rsi_wb, simple string ma_type, simple int ma_len) =>
output = switch rsi_wb
"RAW RSI" => ta.rsi(rsi_src, rsi_len)
"RSI MA" => ma_type == "EMA" ? (ta.ema(ta.rsi(rsi_src, rsi_len), ma_len)) : (ta.sma(ta.rsi(rsi_src, rsi_len), ma_len))
Signal Calculation
The final trading signal is a weighted average of both the slow and fast indicators, depending on the calculated weights from the RSI. This ensures a balanced approach, where slow indicators maintain overall trend guidance, while fast indicators provide timely entries and exits.
// Calculate Signal (as weighted average)
sig = math.round(((DMI*slow_w) + (CCI*slow_w) + (Aroon*slow_w) + (ZLEMA*fast_w) + (IIRF*fast_w)) / (3*slow_w + 2*fast_w), 2)
Backtest Mode and Performance Metrics
This version of the RSI Weighted Trend System includes a comprehensive backtesting mode, allowing users to evaluate the performance of their selected settings against a Buy & Hold strategy. The backtesting includes:
Equity calculation based on the signals generated by the indicator.
Performance metrics table comparing Buy & Hold strategy metrics with the system’s signals, including: Mean, positive, and negative return percentages, Standard deviations (of all, positive and negative returns), Sharpe Ratio, Sortino Ratio, and Omega Ratio
f_PerformanceMetrics(series float base, int Lookback, simple float startDate, bool Annualize = true) =>
// Initialize variables for positive and negative returns
pos_sum = 0.0
neg_sum = 0.0
pos_count = 0
neg_count = 0
returns_sum = 0.0
returns_squared_sum = 0.0
pos_returns_squared_sum = 0.0
neg_returns_squared_sum = 0.0
// Loop through the past 'Lookback' bars to calculate sums and counts
if (time >= startDate)
for i = 0 to Lookback - 1
r = (base - base ) / base
returns_sum += r
returns_squared_sum += r * r
if r > 0
pos_sum += r
pos_count += 1
pos_returns_squared_sum += r * r
if r < 0
neg_sum += r
neg_count += 1
neg_returns_squared_sum += r * r
float export_array = array.new_float(12)
// Calculate means
mean_all = math.round((returns_sum / Lookback) * 100, 2)
mean_pos = math.round((pos_count != 0 ? pos_sum / pos_count : na) * 100, 2)
mean_neg = math.round((neg_count != 0 ? neg_sum / neg_count : na) * 100, 2)
// Calculate standard deviations
stddev_all = math.round((math.sqrt((returns_squared_sum - (returns_sum * returns_sum) / Lookback) / Lookback)) * 100, 2)
stddev_pos = math.round((pos_count != 0 ? math.sqrt((pos_returns_squared_sum - (pos_sum * pos_sum) / pos_count) / pos_count) : na) * 100, 2)
stddev_neg = math.round((neg_count != 0 ? math.sqrt((neg_returns_squared_sum - (neg_sum * neg_sum) / neg_count) / neg_count) : na) * 100, 2)
// Calculate probabilities
prob_pos = math.round((pos_count / Lookback) * 100, 2)
prob_neg = math.round((neg_count / Lookback) * 100, 2)
prob_neu = math.round(((Lookback - pos_count - neg_count) / Lookback) * 100, 2)
// Calculate ratios
sharpe_ratio = math.round(mean_all / stddev_all * (Annualize ? math.sqrt(Lookback) : 1), 2)
sortino_ratio = math.round(mean_all / stddev_neg * (Annualize ? math.sqrt(Lookback) : 1), 2)
omega_ratio = math.round(pos_sum / math.abs(neg_sum), 2)
// Set values in the array
array.set(export_array, 0, mean_all), array.set(export_array, 1, mean_pos), array.set(export_array, 2, mean_neg),
array.set(export_array, 3, stddev_all), array.set(export_array, 4, stddev_pos), array.set(export_array, 5, stddev_neg),
array.set(export_array, 6, prob_pos), array.set(export_array, 7, prob_neu), array.set(export_array, 8, prob_neg),
array.set(export_array, 9, sharpe_ratio), array.set(export_array, 10, sortino_ratio), array.set(export_array, 11, omega_ratio)
// Export the array
export_array
The metrics help traders assess the effectiveness of their strategy over time and can be used to optimize their settings.
Calibration Mode
A calibration mode is included to assist users in tuning the indicator to their specific needs. In this mode, traders can focus on a specific indicator (e.g., DMI, CCI, Aroon, ZLEMA, IIRF, or RSI) and fine-tune it without interference from other signals.
The calibration plot visualizes the chosen indicator's performance against a zero line, making it easy to see how changes in the indicator’s settings affect its trend detection.
Customization and Default Settings
Important Note: The default settings provided are not optimized for any particular market or asset. They serve as a starting point for experimentation. Traders are encouraged to calibrate the system to suit their own trading strategies and preferences.
The indicator allows deep customization, from selecting which indicators to use, adjusting the lengths of each indicator, smoothing parameters, and the RSI weight system.
Alerts
Traders can set alerts for both long and short signals when the indicator flips, allowing for automated monitoring of potential trading opportunities.
Search in scripts for "CCI"

Pulse Oscillator [UAlgo]The "Pulse Oscillator " is a trading tool designed to capture market momentum and trend changes by combining the strengths of multiple well-known technical indicators. By integrating the RSI (Relative Strength Index), CCI (Commodity Channel Index), and Stochastic Oscillator, this indicator provides traders with a comprehensive view of market conditions, offering both trend filtering and precise buy/sell signals. The oscillator is customizable, allowing users to fine-tune its parameters to match different trading strategies and timeframes. With its built-in smoothing techniques and level adjustments, the Pulse Oscillator aims to be a reliable tool for both trend-following and counter-trend trading strategies.
🔶 Key Features
Multi-Indicator Integration: Combines RSI, CCI, and Stochastic Oscillator to create a weighted momentum oscillator.
Why Use Multi-Indicator Integration?
Script uses Multi-Indicator Integration to combine the strengths of different technical indicators—such as RSI, CCI, and Stochastic Oscillator—into a single tool. This approach helps to reduce the weaknesses of individual indicators, providing a more comprehensive and reliable analysis of market conditions. By integrating multiple indicators, we can generate more accurate signals, filter out noise, and enhance our trading decisions.
Customizable Parameters: Allows users to adjust weights, periods, and smoothing techniques, providing flexibility to adapt the indicator to various market conditions.
Trend Filtering Option: An optional trend filter is available to enhance the accuracy of buy and sell signals, reducing the risk of false signals in choppy markets.
Dynamic Levels: The indicator dynamically calculates multiple levels of support and resistance, adjusting to market conditions with customizable decay factors and offsets.
Visual Clarity: The indicator visually represents different levels and trends with color-coded plots and fills, making it easier for traders to interpret market conditions at a glance.
Alerts: Configurable alerts for buy and sell signals, as well as trend changes, enabling traders to stay informed of key market movements without constant monitoring.
🔶 Interpreting the Indicator
Buy Signal: A buy signal is generated when the Slow Line crosses under the Fast Line during an uptrend or when the trend filter is disabled. This indicates a potential bullish reversal or continuation of an upward trend.
Sell Signal: A sell signal occurs when the Slow Line crosses above the Fast Line during a downtrend or when the trend filter is disabled, signaling a potential bearish reversal or continuation of a downward trend.
Trend Change: The indicator detects trend changes when the Fast Line shifts from increasing to decreasing or vice versa, providing early warning of possible market reversals.
Dynamic Levels: The indicator calculates upper and lower levels based on the Fast Line's values. These levels can be used to identify overbought or oversold conditions and potential areas of support or resistance.
🔶 Disclaimer
Use with Caution: This indicator is provided for educational and informational purposes only and should not be considered as financial advice. Users should exercise caution and perform their own analysis before making trading decisions based on the indicator's signals.
Not Financial Advice: The information provided by this indicator does not constitute financial advice, and the creator (UAlgo) shall not be held responsible for any trading losses incurred as a result of using this indicator.
Backtesting Recommended: Traders are encouraged to backtest the indicator thoroughly on historical data before using it in live trading to assess its performance and suitability for their trading strategies.
Risk Management: Trading involves inherent risks, and users should implement proper risk management strategies, including but not limited to stop-loss orders and position sizing, to mitigate potential losses.
No Guarantees: The accuracy and reliability of the indicator's signals cannot be guaranteed, as they are based on historical price data and past performance may not be indicative of future results.

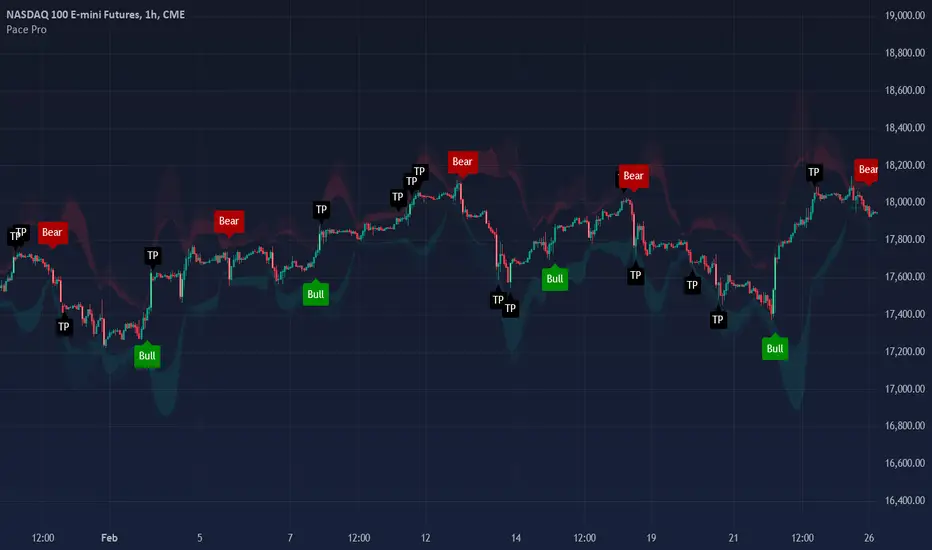
Pace ProOverview
The Pace Pro indicator is a robust trend-following tool designed for versatile application across various timeframes and markets, including stocks, forex, futures and cryptocurrencies. It provides traders with "bull" and "bear" signals, take profit (TP) signals, and volume spike indications. This indicator aims to help traders identify potential trading opportunities through trends, reversals and price exhaustion.
Key Features
Bull and Bear Signals: Pace Pro generates green "bull" and red "bear" signals based on a trend strength score derived from an aggregation of components.
Take Profit (TP) Signals: The indicator plots black "TP" signals at areas of price exhaustion.
Volume Spike Indicators: The indicator colors candles to signify high volume spikes—light green for high bullish volume and light red for high bearish volume.
Price Clouds: The indicator includes three types of Bollinger Band clouds. These clouds help visualize exhaustion and volatility, providing traders with multiple perspectives on market dynamics.
How it works:
Trend Strength: This score is calculated using a proprietary formula that assesses the magnitude and direction of market movement with standard deviation and regression analysis. Standard deviation computes the average price over a specified period and then calculates the standard deviation of prices from this average. A linear regression is performed on the closing prices over a specified period. The slope of the regression line is used to identify the trend direction, and the standard deviation is used to assess trend stability and filter out noise, working together to clearly identify direction and robustness. Bull/Bear signals are produced based on trend strength reaching specific thresholds, configurable in the settings.
Overbought/Oversold Strength: This strength identifies price exhaustion using a unique formula that aggregates values from several indicators such as RVI, RSI and CCI. RVI captures price trends, RSI measures momentum, and CCI identifies price deviations from the mean, providing a comprehensive view of market conditions. Take profit signals are plotted at points of high price exhaustion, indicating optimal exit prices.
Volume Analysis: Volume spikes are identified and highlighted with colored candles using an ATR calculation that pinpoints outliers in volume. This is calculated using the math.abs function, identifying volume spikes in the last 14 bars. Volume spike candle size can be configured in settings to the user's liking.
Bollinger Band Clouds: The indicator employs Bollinger Band clouds based on WMA, VWMA, and EMA to provide a comprehensive view of market volatility and trend strength. WMA responds quickly to price changes, VWMA incorporates volume, and EMA smooths out data, offering a unique and adaptive perspective on market conditions. This combination is used to provide a unique perspective on market volatility, utilizing different moving averages. These clouds adapt to price fluctuations and offer visual cues to enhance trend analysis.
Utility
This tool provides traders with valuable information for trend-following and reversal strategies across different timeframes. It helps traders by:
-Generating "bull" and "bear" signals to indicate potential long, short and exit points. The precise calculation methods and statistical components used in deriving the trend strength score are designed to filter out market noise and provide a clear indication of prevailing market trends.
-Providing "TP" signals at areas of price exhaustion, areas where taking profit is optimal. These also serve as potential reversal points in the market as they incorporate reversion analysis techniques.
-Highlighting high volume spikes with colored candles to indicate significant market activity. These volatile candles can indicate a significant and rapid surge in price.
-Offering visual insights through Bollinger Band clouds, which help traders assess overbought and oversold conditions on a broad scale. These aid in visualizing potential reversals in the market.
Rationale and Benefits of Component Combination
The combination of trend strength, overbought/oversold strength, volume analysis, and Bollinger Band clouds provides a holistic approach to market analysis and allows users to use various techniques of trading analysis to make sound trading decisions. Each component serves a distinct purpose:
-Trend Strength identifies and confirms the direction and magnitude of market trends, offering clear bull and bear signals. A trend score is calculated to clearly identify where price is strongly trending and where it is quite weak. This customizable feature allows traders to configure this indicator to their liking by only plotting signals when the trend reaches a desired threshold.
-Overbought/Oversold Strength pinpoints areas of price exhaustion, providing crucial take profit and reversal conditions in the market. I combine RSI, RVI, and CCI to provide a more robust reversion score. My rationale for this is to leverage data from multiple indicators, to ensure a comprehensive assessment of price exhaustion rather than relying on a single source.
-Volume Analysis highlights significant market activity, giving traders insights into potential price movements. This feature is included to provide users with a visual representation of price pumps/dumps, that can aid in trading decisions in combination with entry and exit signals.
-Bollinger Band Clouds offer a visual representation of market volatility and trend strength, enhancing the overall analytical framework. Bands were calculated using a mixture of WMA, VWMA, and EMA to diversify data and to bring variety to its display. This can enhance its use as it does not use a single data source and relies on multiple.
Uniqueness:
This indicator stands out due to its innovative integration of standard deviation and regression analysis, offering traders a unique and comprehensive market analysis tool. By combining standard deviation to measure volatility and filter out noise with regression analysis to identify trend direction and strength, it provides insightful trend signals that help traders make informed decisions. This indicator's versatility is enhanced by its customizable settings, allowing traders to adapt it to their specific needs and trading styles with the trend sensitivity setting. Combining RSI, RVI, and CCI for reversion and exit points is unique as it integrates multiple perspectives on price momentum and volatility, providing a more comprehensive assessment of price exhaustion than using any single indicator. Combining WMA, EMA, and VWMA as bands is beneficial and unique as it blends different averaging methods to offer a more nuanced and adaptive view of market volatility and trend strength.
By integrating these components, it delivers a multifaceted tool that addresses various aspects of market analysis, making it a valuable asset for traders seeking to improve their decision-making process.
Disclaimer
Trading involves substantial risk and is not suitable for every investor. This indicator is designed to assist in decision-making but does not guarantee profits or prevent losses. Always conduct your own research and consider seeking advice from a financial professional.
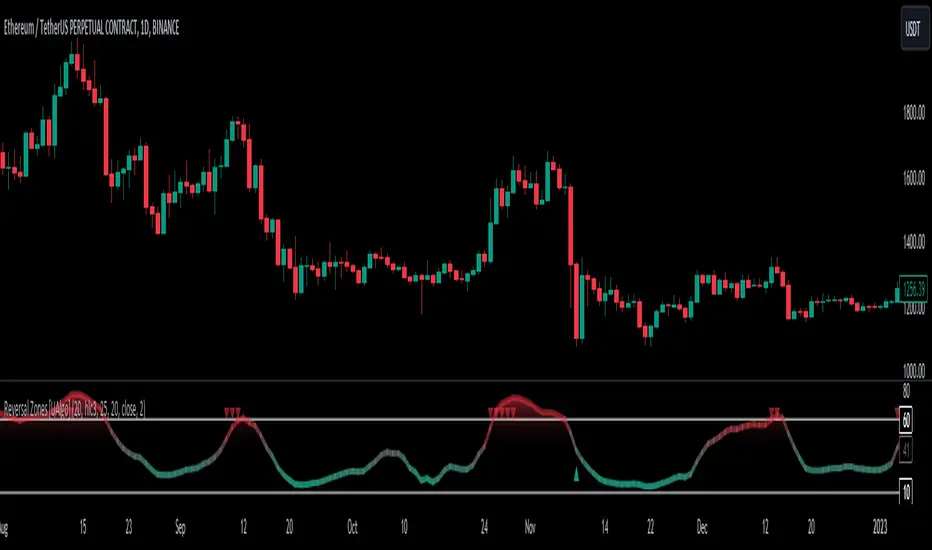
Reversal Zones [UAlgo]🔶Description:
"Reversal Zones " aims to identify potential reversal zones in price movements. The indicator provides visual signals on the chart, indicating potential overbought and oversold conditions based on the calculated values. It offers traders insights into possible turning points in the market, aiding in decision-making processes regarding entry and exit points.
🔶Key Features:
Bollinger Bands Percentile (BB Percentile):
Bollinger Bands Percentile is utilized in this script to gauge the current price position relative to its recent volatility. By calculating the percentile rank of the current price within the Bollinger Bands, traders can identify extreme price levels. This assists in recognizing potential overbought or oversold conditions, where price may be due for a reversal.
Choppiness Index (CI):
The Choppiness Index is employed here to measure the market's trendiness or choppiness. By evaluating the efficiency of the price movement, CI helps traders determine whether the market is trending or consolidating.
Commodity Channel Index (CCI):
The Commodity Channel Index is integrated into this script to capture price momentum. CCI quantifies the relationship between the current price, a moving average, and standard deviation. Traders use CCI to identify overbought or oversold conditions and potential trend reversals.
By averaging and smoothing these values, traders can obtain a clearer picture of potential turning points in the market. The final smoothed combination signal aims to reduce noise and provide more reliable insights.
🔶Disclaimer:
Please note that this script is provided for informational and educational purposes only and should not be considered as financial advice.
Trading in financial markets involves risk, and past performance is not necessarily indicative of future results.
Users should conduct their own research and analysis or consult with a qualified financial advisor before making any investment decisions based on this indicator.
The creators of this script are not liable for any losses incurred from trading activities.
EUR/USD 45 MIN Strategy - FinexBOTThis strategy uses three indicators:
RSI (Relative Strength Index) - It indicates if a stock is potentially overbought or oversold.
CCI (Commodity Channel Index) - It measures the current price level relative to an average price level over a certain period of time.
Williams %R - It is a momentum indicator that shows whether a stock is at the high or low end of its trading range.
Long (Buy) Trades Open:
When all three indicators suggest that the stock is oversold (RSI is below 25, CCI is below -130, and Williams %R is below -85), the strategy will open a buy position, assuming there is no current open trade.
Short (Sell) Trades Open:
When all three indicators suggest the stock is overbought (RSI is above 75, CCI is above 130, and Williams %R is above -15), the strategy will open a sell position, assuming there is no current open trade.
SL (Stop Loss) and TP (Take Profit):
SL (Stop Loss) is 0.45%.
TP (Take Profit) is 1.2%.
The strategy automatically sets these exit points as a percentage of the entry price for both long and short positions to manage risks and secure profits. You can easily adopt these inputs according to your strategy. However, default settings are recommended.

ai.1ai.1 = All in One indicator
"ai.1" is a high probability low risk predictive oscillator based on various well known indicators "All in One". I wanted to be able to get an equal output result for a multiple trading metrics comparison. I wanted to see what all market participants see, because all market participants look at charts in different ways with different indicators. By combining these well known trading indicators into the same scale I get a comprehensive view of the market as it is, not just through one prism.
The ai.1 indicator uses Stochastic and/or Moving Average Convergence Divergence formulas to visualize: Relative Strength Index, Commodity Channel Index, Money Flow Index, True Strength Index, Momentum, Average True Range, Standard deviation, Accumulation Distribution Index, Price Volume Trend, Positive Volume Index and/or On Balance Volume in a standard type of appearance.
1) MACD: Moving Average Convergence Divergence reveals changes in the strength, direction, momentum, and duration of a trend in a stock's price.
2) Stoch: Stochastic is a technical indicator widely used in short-term trend analysis of futures and stock markets. Stochastic is calculated with the lowest and highest by a formula of 100.
3) RSI: Relative Strength Index is calculated from the upward and downward price changes.
4) CCI: The Commodity Channel Index is calculated as the difference between the typical price of a commodity and its simple moving average, divided by the mean absolute deviation of the typical price.
5) MFI: The Money Flow Index is a technical oscillator that uses price and volume for identifying overbought or oversold conditions in an asset.
6) TSI: True Strength Index uses moving averages of the underlying momentum of a financial instrument.
7) MOM: Momentum is simply the difference of the source price and price length.
8) ATR: Average True Range measures the range between high and low.
9) STDV: Standard deviation is the statistical measure of market volatility, measuring how widely prices are dispersed from the average price. If prices trade in a narrow trading range, the standard deviation will return a low value that indicates low volatility.
10) AD: Accumulation Distribution Index is a cumulative indicator that uses volume and price to assess whether a stock is being accumulated or distributed.
11) PVT: Price Volume Trend uses the cumulative volume and price change.
12) PVI: Positive Volume Index compares the previous volume flow with the current volume.
13) OBV: On Balance Volume is the cumulative volume change.
To be able to merge these formulas I had to normalize the math into 1 scale. I did this by using Stochastic and then converting that by its historical minimum and maximum. The normalized output scale range for ai.1 is -100 to 100.
100 = overbought
-100 = oversold
MACD is a unique scale with neutral zero.
Stochastic is a 0-100 scale.
Relative Strength Index is a 0-100 scale.
Commodity Channel Index is generally a -400<400 scale with neutral zero.
Money Flow Index is a 0-100 scale.
True Strength Index is a unique scale with neutral zero.
Momentum is a unique scale with neutral zero.
Average True Range is a unique scale.
Standard deviation is a unique scale.
Accumulation Distribution Index is a unique scale.
Price Volume Trend is a unique scale.
Positive Volume Index is a unique scale.
On Balance Volume is a unique scale.
Everything in between is either bullish or bearish.
Rising = bullish
Falling = bearish
crossover = bullish
crossunder = bearish
cross = anticipation of the next cross direction
convergence = direction change
divergence = momentum
*Represents a how to use tooltip*
The default input settings / style:
Source = ohlc4
7 = K length, *Stochastic length*
3 = D smoothing, *smoothing length*
6 = MACD-ai.1 fast, *fast length line*
color = blue
13 = MACD-ai.1 slow, *slow length line*
color = white
4 = MACD-ai.1 signal, *histogram length*
color rising above 0 = bright green
color falling above 0 = dark green
color falling below 0 = bright red
color rising below 0 = dark red
2 = Stretch, *Output multiplier for MACD-ai.1 visual expansion*
1 = MA, *moving average of ALL or Choice Type ai.1-lines*
MACD-ai.1 variable choice / Choice type ai.1-line:
RSI *Relative Strength Index*
CCI *Commodity Channel Index*
MFI *Money Flow Index*
TSI *True Strength Index*
MOM *Momentum*
ATR&STDV *weighted average True Range & Standard Deviation*
ATR *True Range*
STDV *Standard Deviation*
PVT *Price Volume Trend*
PVI *Positive Volume Index*
OBV *On Balance Volume*
AD *Accumulation Distribution*
ALL *Weighted average of all*
ALLP *Weighted average of all price based*
ALLV *Weighted average of all volume based*
MACD-ai.1 price label / text color
crossover = green label / black text
crossunder = red label / white text
MACD-ai.1 price label on / off
*unchecked off/ checked on*
label decimal place: 2
*example: use 0 for a round number, use 4 for Forex*
long MACD-ai.1 crossover = green tiny circle
short MACD-ai.1 crossunder = red tiny circle
bullish rising green tiny dot
bearish falling red tiny dot
All ai.1-line = weighted average of all metrics
All cross oversold / overbought levels
*values used to trigger a label or character print*
oversold = -65 green tiny circle
extreme oversold = -85 green small circle
overbought = 65 red tiny circle
extreme overbought = 85 red small circle
All ai.1-line extreme cross price label on / off
All ai.1-line cross price label on / off
All ai.1-line reversal price label on / off
*unchecked off/ checked on*
ai.1-lines variable choice:
RSI *Relative Strength Index*
CCI *Commodity Channel Index*
MFI *Money Flow Index*
TSI *True Strength Index*
MOM *Momentum*
ATR&STDV *weighted average True Range & Standard Deviation*
ATR *True Range*
STDV *Standard Deviation*
PVT *Price Volume Trend*
PVI *Positive Volume Index*
OBV *On Balance Volume*
AD *Accumulation Distribution*
ALL *Weighted average of all*
ALLP *Weighted average of all price based*
ALLV *Weighted average of all volume based*
Choice Type ai.1-line cross oversold / overbought levels
*values used to trigger a label or character print*
oversold = -70 green tiny circle
extreme oversold = -90 green small circle
overbought = 70 red tiny circle
extreme overbought = 90 red small circle
Choice Type ai.1-line extreme cross price label on / off
Choice Type ai.1-line cross price label on / off
Choice Type ai.1-line reversal price label on / off
*unchecked off/ checked on*
Horizontal lines:
100 white
75 red
50 yellow
25 purple
0 white
-25 blue
-50 orange
-75 green
-100 white
Example screenshots of various ways to view ai.1 indicator depending on your preferred settings:
MACD-ai.1 with price labels and All ai.1-line output with directional color:
RSI ai.1-line blue with AD ai.1-line white
MACD-ai.1 fast, slow lines w/ signal histogram
long MACD-ai.1 crossover = green tiny circle
short MACD-ai.1 crossunder = red tiny circle
bullish rising green tiny dot
bearish falling red tiny dot
ATR&STDV ai.1-line with directional color:
All ai.1-line output with directional color & extreme overbought / oversold points:
All price ai.1-line purple with All volume ai.1-line orange
The ai.1 indicator can be used independently by itself or in conjunction with your favorite indicator to compare and contrast the accuracy for a trade setup entry and/or exit. The ai.1 indicator can be used on all time frames from 1 minute to 1 month etcetera. However, the default length settings are fine tuned & quick reacting for trading in real time. So, you can make it slower by adjusting the length larger to fit your trading or investing time frame. But I would not tinker with the default length settings without validating its output by back testing it on each specific time frame.
Different time frame snapshot examples:
EUR/USD 1hr chart:
BTC/USD 1 day chart:
ES1! 2 week chart:
TSLA 2 day chart:

Extreme Entry with Mean Reversion and Trend FilterThis non-repainting indicator is an improved version of my previous work, a more versatile tool designed to provide traders with dynamic and adaptive entry signals while incorporating a mean reversion and trend filtering mechanism. By combining RSI overbought/oversold, regular divergence and confirmatory momentum oscillator such as CCI or MOM, this indicator generates more precise and timely signals for entering trades.
The indicator offers a comprehensive set of entry conditions for both Buy and Sell entries:
• For Buy entries, it checks for oversold conditions based on RSI levels, and detects bullish divergence patterns while oversold and it identifies upward crossovers in the selected entry signal source (CCI or Momentum).
• Similarly, for Sell entries, it identifies downward crossovers of the CCI or Mom, after the recent overbought conditions, and bearish divergence patterns inside the overbought RSI.
To refine the entry signals even further, the indicator utilizes a mean reversion filter. Traders can choose to display signals that occur inside or outside the upper and lower mean reversion bands:
• Range Entries are indicating potential buying opportunities near the lower band and selling opportunities near the upper band. This is based on the concept of mean reversion, which suggests that prices tend to return to the average when they reach the upper or lower bands. By focusing on these signals, traders can take advantage of price movements that have a higher probability of reversing towards the mean.
• Extreme Entries, on the other hand, represent signals that occur outside of the bands, signaling potential pullbacks during strong trends. By entering positions only at extreme highs or lows, traders can avoid getting caught in the middle of the trend. This approach helps traders capitalize more favorable trading opportunities which have a high reward-risk ratio.
Trend Filter acts as a directional bias for the entry signals. When enabled, long and short entry conditions are filtered based on the relationship between the closing price and the EMA.
Traders have the flexibility to customize, tweak the indicator filter and values in the settings according to their preferences strategies and traded assets, tailoring the signals to their specific needs. The script sets alert conditions to trigger alerts for buy, sell, or both entry signals. This indicator can be used in conjunction with price action or other technical analysis tools for confirmation and better trading decisions.
I created this indicator for my own use, and I share this for informational purposes only. It does not constitute financial advice so use at your own risk and consider your financial situation before making any trading decisions. The indicator's accuracy is not guaranteed, and past performance is not indicative of future results.
I appreciate your feedback on this indicator. As I am new to script development, I am open to comments and suggestions to improve it. If you encounter any issues while using this indicator, please let me know in the comments section. If you find it helpful, I kindly ask for your support in boosting it. Thank you for your cooperation.

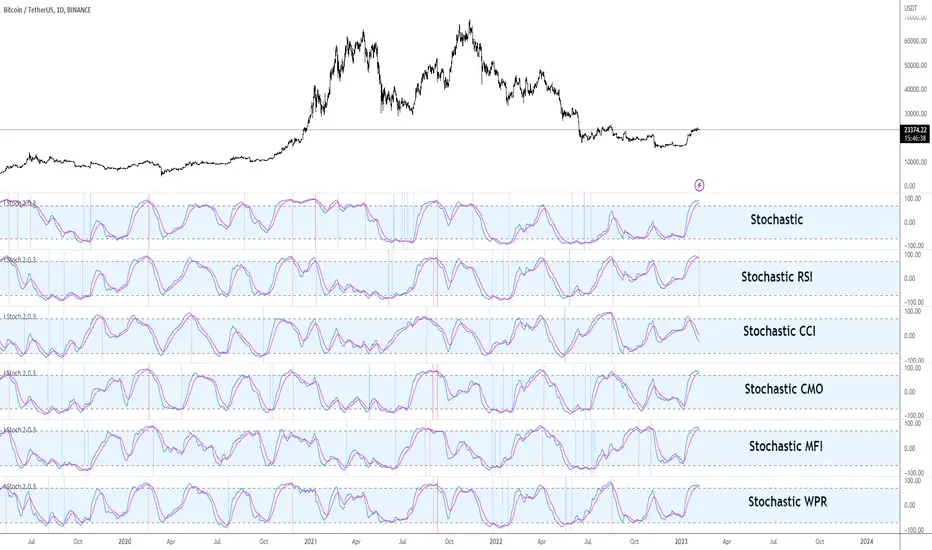
I Stochastic#Istoch #Version_2.0.3 #Stochastic
Hello traders from all over the world! Following my last publish on I MACD indicator, today I brought up another powerful customizing tool. This time, it might be good news for those traders with blind faiths on Stochastic and any other related indicators like Stochastic RSI. Stochastic is renowned for its usefulness of identifying market cycle turns that alternate pressure of bulls and bears. Accordingly, along with RSI and MACD, Stochastic is also known as one of the popular technical indicators in recent market regardless of asset and commodity types.
Developed by George Lane in the late 1950s, Stochastic is computed by dividing difference between current and minimum value, by the difference between the maximum and minimum value within a specific range (%K Length, default = 14) as shown in the formula below. Generally, a MA(Moving Average) is used in combination with the Stochastic line whereas the %D smoothing (Default = 3) refers to the length of this MA. Keep in mind that the crosses of these two lines are considered as significantly signals particularly when they appear on the overbought/oversold zone.
Stoch = (Current Price – Min Price) / (Max Price – Min Price)
Stochastic RSI is pretty much the same concept except that it derives its value from the RSI instead of the actual price as shown in the formula below. In other words, StochRSI is basically Stochastic of the RSI. Recently, it seems that many traders prefer StochRSI over classic Stochastic considering the virtue of StochRSI that it reflects proper degree of wave. Furthermore, StochRSI filters out many false signals by smoothing out the noises and outliers, compared to the regular Stochastic.
StochRSI = (Current RSI – Min RSI) / (Max RSI – Min RSI)
Anyhow, it surely has been verified that “Stochastic-fying” the RSI is technically beneficial when comprehending the market trends and spotting the potential trend reversal points. But what if other indicators instead of RSI was combined with the Stochastic? There are countless cutting-edge technical indicators developed by many traders in contemporary markets that are better fitted to the recent markets. This idea inspired me to create this tool that we can test other combinations of different parameters and indicators used within the Stochastic.
I Stoch provides traders the perfect back-testing environment for Stochastic indicator. Why not Stochastic CCI, ATR, CMO, MFI, and ROC? There might be better combinations of setups that are more optimal within the Stochastic. With this, you can design and test various types of indicators to “Stochastic-fy” also with different settings, lengths or sensitivities just fitted for your own trading style. For example, I found 14, 14, 60, 60, EMA(instead of SMA), and RSI parameters useful for myself which is the default setting.
Furthermore, for your convenience I added a few extra side features in setting as listed below. You can turn these on and off accordingly to your preferences and circumstances.
1. Crossovers of Stochastic line and MA: Death-crosses on overbought and golden-crosses on oversold area are signaled with vertical lines.
2. Histogram: Just like the MACD oscillator, this feature visualizes the distance between the Stochastic line and the MA. The greater histogram bar is the wider the distance is between these two lines.
3. Divergence Sensitivity: This feature spots both the regular and hidden divergences of Stochastic line. Higher sensitivity searches for the divergences within the waves of the larger degree and vice versa for the lower sensitivity.
Please let me know if you get to find out some insightful combinations of parameters. Thank you. Your subscriptions, likes, and comments inspire me a lot!
#Istoch #스토캐스틱
안녕하세요 트레이더 여러분. 토미입니다.
지난번 I MACD라는 커스터마이징 지표에 이어 제가 최근에 오랜 공을 들인 I Stochastic 지표에 대해 소개도 드릴 겸 간단한 강의를 준비해봤습니다.
1950년대 George Lane이라는 사람에 의해 개발된 스토캐스틱은 RSI 그리고 MACD와 더불어 요즘 차트 세계에서 가장 대중적으로 이용되는 보조지표입니다. 아래 공식과 같이 본 지표는 주어진 기간 동안의 가격 변동폭과 현재 가격의 상대적 관계를 통해 현 추세의 정도와 잠재적 변곡점을 알려줍니다. 다른 지표들에 비해 노이즈 빈도는 조금 높지만 추세 반전 신호를 꽤 빨리 알려준다는 점과 해석이 직관적이라는 점에서 요즘 많은 트레이더분들의 최애 지표 중 하나로 뽑힙니다.
스토캐스틱 = (현재가 - K길이 중 최저가) / (K길이 중 최고가 – K길이 중 최저가)
한편 스토캐스틱 RSI는 주가가 아닌 RSI에서 도출한 값을 스토캐스틱화 시켜놓은 보조지표이며 아래 공식에서 보실 수 있듯 다른 말로 RSI의 스토캐스틱이라고 보시면 됩니다. 최근에는 일반 스토캐스틱보다 파동의 사이클을 더 잘 반영하고 노이즈 및 Outlier들을 잘 처리해준다는 장점들 때문에 스토캐스틱 RSI를 더 선호하는 트레이더분들이 많아졌습니다.
스토캐스틱 RSI = (현재 RSI – K길이 중 최저 RSI) / (K길이 중 최고 RSI – K길이 중 최저 RSI)
이렇듯 RSI를 스토캐스틱화한 지표는 존재하는데 왜 CCI, MFO, 그리고 CMO 등 다른 지표를 스토캐스틱화한 지표는 없을까요? 왜 스토캐스틱 CCI, 스토캐스틱 MFO, 그리고 스토캐스틱 CMO는 안쓸까요? 요즘 모두 다 비슷한 지표들을 보는 마당에 더 좋은 조합의 스토캐스틱 지표가 존재하지 않을까요? 이러한 발상을 시작으로 이것저것 테스팅도 해볼 겸 해당 지표의 최적화 테스팅 툴을 만들어봤습니다. RSI가 아닌 다른 보조지표들도 클릭 하나로 쉽게 스토캐스틱화 시킬 수 있게끔 디자인해봤습니다.
오늘날 보편적으로 사용되고 있는 스토캐스틱 RSI 기본 설정 값은 3, 3, 14, 14 SMA입니다. RSI 보다 스토캐스틱에 더 잘 맞는 지표 종류뿐만 아니라 더 최적화된 파라미터 값들이 분명 존재할 겁니다. 여러 조합의 테스트를 통해 주가를 더 잘 반영하는 설정 값을 찾아보면 좋을 듯 싶습니다. 제가 찾은 스토캐스틱 RSI 설정 값은 14, 14, 60, 60 EMA로 기존보다 조금 더 큰 추세를 반영해주는 나쁘지 않은 조합인듯 싶어 디폴트 값으로 설정해 두었습니다. 여러분들도 괜찮은 지표 종류 및 설정 값들 찾으면 치사하게 혼자 쓰지 말고 꼭 공유 부탁드립니다!
또한 주요 시그널들을 쉽게 잡아낼 수 있게 아래와 같이 몇가지 자동 기능들을 추가했습니다. 여러분들의 편의와 상황에 따라 사용하셔도 되고 거슬리면 끄셔도 됩니다.
1. 스토캐스틱 두 선들의 크로스: 과매수 구간에서 데드크로스, 과매도 구간에서 골든크로스가 발생하면 세로줄이 떠서 알려줍니다. 이 줄이 뜨면 어느정도 추세의 변환의 시그널로 볼 수 있습니다.
2. 히스토그램: MACD처럼 두 선들의 이격도 혹은 간격을 히스토그램 오실레이터처럼 표시해주는 기능입니다. 혹시 몰라서 넣었습니다.
3. 다이버전스 및 민감도: 스토캐스틱 선의 다이버전스를 표시해줍니다. 민감도를 키울수록 더 큰 단위의 파동 사이클을 기반으로 다이버전스를 잡아냅니다.
트레이딩뷰 차트 상단 지표 창에 I Stoch 검색하시거나 밑에 즐겨찾기 인디케이터 넣기 클릭하시면 사용하실 수 있습니다. 그럼 이만 마치겠습니다. 감사합니다.
여러분의 구독, 좋아요, 그리고 댓글은 저에게 큰 동기부여가 됩니다.
Color Agreement Aggregate (CAA)This indicator helps finding patterns within market structure in a highly intuitive manner.
It does this by painting a picture instead of presenting numerical values.
It greatly reduces noise in trend/structure analysis.
----- HOW TO USE IT -----
1) Zoom out of chart to get a clearer picture of overall color patterns.
2) Consider areas of intense reds and greens as areas of interest.
3) There is always a pattern of intense reds followed by intense greens. Consider this pattern as the start of a new cycle.
4) Key spikes and dips are shown when all 3 bands are matching of intense colors.
5) Turn on Precision in the Style tab to get more information on decisive spikes in price (See "Precision" below).
Reach (top band):
This is the fast and more volatile movement of the market. It shows the direction in which the recent price action is reaching towards.
Energy (middle band):
This is the medium speed of market movement. It shows the energy of the Reach and how influential it is to market change.
Frequent and intense change of color in this band can be a precursor of change within the Basis.
Basis (bottom band):
This is the slower, broader movement of the market. It is the basis on which the Reach and Energy sit on.
Intense colors in this band show major changes in price levels and market structure.
Precision:
Precision shows the weaker levels of colors. It does this by making bars in a band half its size.
For example, if there is a light green bar that is half, it means that the current bar is on the weaker level of the light green level.
Precision helps in identifying where there are influential moves in price action. Note, there will never be a half-sized bar in the highest and lowest levels.
This is because these levels are the limits and don't have a weaker half.
See notes in chart for more information. Note, you can turn off the labels in the Style tab.
----- HOW THIS INDICATOR IS ORIGINAL; WHAT IT DOES AND HOW IT DOES IT -----
This indicator has an original, unique ability to paint the overall market structure in a highly intuitive manner. It "paints" an image instead of showing numbers.
It does this by color-coding different levels of varying speeds of market movement. It then presents these levels as simple bars.
Finally, it stacks them all and creates an overall image of clear breaks and/or repeats within market structure.
This greatly reduces noise in pattern finding, finding breaks in market structure, and in confirming repeated patterns.
----- VERSION -----
The only significant information from this indicator are the colors themselves and the patterns, agreement, and aggregate of the colors.
This indicator does not provide any numerical information of the underlying, mathematical calculations.
The levels for the Reach are made by the KPAM; for the Energy, the CCI; and for the Basis, the RSI.
However, this indicator is not a variant, replacement, or presentation of the KPAM, CCI, or the RSI in any way, shape, or form -- this indicator does not present itself as such.
The 3 indicators are only useful to this indicator in as much as they are what the colors are derived from -- nothing more.
They are needed in order to obtain, visualize, and create the overall aggregate and agreement of colors.
Thus, the KPAM, CCI, and RSI cannot be adjust nor are they plotted. They are not, in any way, a focus of this indicator.
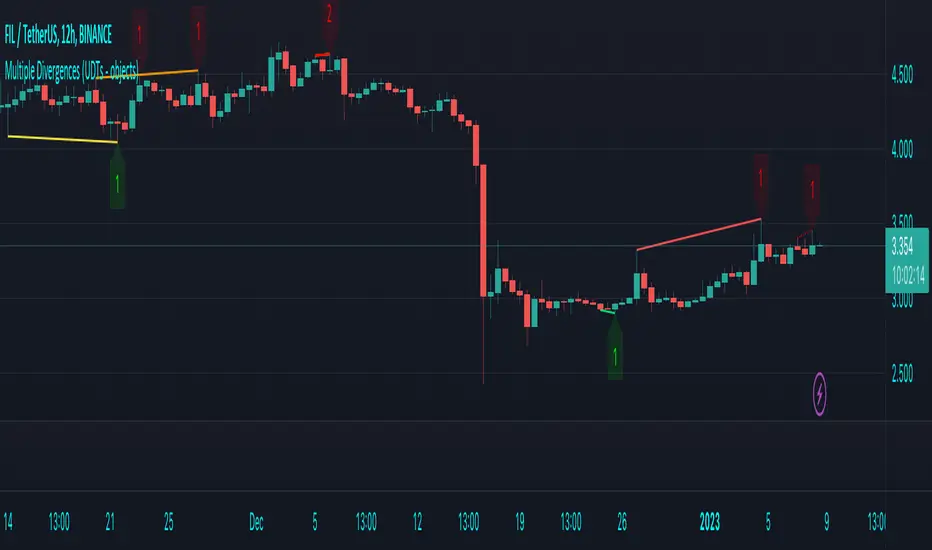
Multiple Divergences (UDTs - objects) - Educational█ OVERVIEW
This script highlights the usage of User-defined Types (UDTs) and objects , and bullish /bearish divergences.
Pivotpoints are used to find divergences, the result of this script will be different against other public multiple divergences scripts.
FOR Pine Script™ CODERS
Besides the information found in CONCEPTS , the comments in the script will, hopefully ), guide you through my thought process.
█ CONCEPTS
The main principle of this script are bullish /bearish divergences, this with 3 different oscillators ( RSI , CCI , MFI )
If you want to know more about divergences, have a look at some Education and Research idea's .
On every bar, an object HLs is made, containing bar_index , high , low , and 2 bool variables ( isPh , isPl ).
On every bar, an object Osc is made, containing bar_index , o (oscillator value), and 2 bool variables ( isPh , isPl ).
If a pivothigh (ph ) is found, isPh will be true on that bar, false otherwise.
If a pivotlow (pl) is found, isPl will be true on that bar, false otherwise.
These objects are added to an array, with limited size.
If a ph is found, the script draws a testline from that ph to every previous ph , found in the array.
Then every high in between these 2 points are checked if they don't pierce the testline .
If the testline isn't broken, the Reg_Div_Piv() function will give 4 values, 1 check (not pierced) variable and the 4 points of the line.
The testline is deleted.
Once a positive check is found, the script will perform the same, but now with the Osc objects.
The script will ONLY compare Osc pivots which are maximum 1 bar away from the high/low pivot .
If everything is confirmed, a line is drawn, visible on the chart.
█ REMARKS
A label will be visible with a number, this is the amount of divergences found with the according oscillator .
EXAMPLE
Div with RSI and CCI -> 2
Div with MFI alone -> 1
Div with RSI and CCI and MFI -> 3
...
Divergences should only be used when confirmed, this is after bar close .
As an aid, lines that are not confirmed will be dotted , if confirmed, they will be solid .
The divergence check start when a ph/pl is found, after which oscillator pivot are checked.
Optionally the same can be done, when a oscillator pivot is found and then check the ph/pl ,
this should give more results, although it can make the script slower.
█ SETTINGS
Left - amount of bars at the left which needs to be lower/higher
Right - amount of bars at the right which needs to be lower/higher
Max values - maximum values in array of objects
3 oscillator settings with
• ON/OFF
• Length
• color bullish divergence
• color bearish divergence
Have FUN !
Reversal MagictrendThis indicator combine multiple indicator in one pine script : Main indicator is Exponential Moving Average (EMA), Commodity Channel Index (CCI), Average True Range (ATR), Crossover Signal & Alert.
1)
For Exponential Moving Average (EMA) have 5 type :
EMA 7 : Green Color (Transparent)
EMA 21 : Red Color (Transparent)
EMA 34 : Orange Color (Faint)
EMA 50 : Purple Color (Transparent)
EMA 90 : Aqua Color (Faint)
Trendband / Background Color in between EMA line :
EMA 7 Cross up EMA 21 : Green
EMA 7 Cross down EMA 21 : Red
EMA 21 Cross up EMA : Yellow
Crossover Signal :
EMA 7 Cross up EMA 21 = Golden Cross : Blue Diamond
EMA 7 Cross down EMA 21 = Death Cross : Red Diamond
Example :
2)
Commodity Channel Index (CCI) :
Have background color : Green for positive value
CCI Signal = Anchor / Hook
- As a signal of reversal. Strong reversal when appear on weekly chart
Example :
Weekly :
Daily :
I am inspired from : www.tradingview.com
Check out his indicator here :
3)
Average True Range (ATR) as Supertrend
Green (Start) New Start for uptrend
Red (End) New Start for downtrend
Also Add on value for each signal.
Example :
I am inspired from : www.tradingview.com
Check out his Supertrend here :
4)
For this indicator, user have option to turn on / off :
- Previous Signal as a backtest
- Previous Trend as a backtest
- ATR to make chart more clean.

Super Sniper - Screener - MTF- Multi Asset -Multi IndicatorSuper Sniper Screener with Multi Indicator EMA Crossover, Trend, ADX, MACD, SSL, CCI, STOCHASTIC, RSI, HMA, QQE, WAE. Trade Entry/Exit with multiple Indicator for Multiple Assets and Multiple Timeframe. if you are on a Higher / Lower Time frame and are looking for Entry/Exit based on a lower timeframe then this indicator is the best. The all in one screener for EMA Crossover, Trend, ADX, MACD, SSL, CCI, STOCHASTIC, RSI, HMA, QQE, WAE
What is Sniper Entry?
if you are on a Higher / Lower Time frame and are looking for Entry/Exit based on a lower timeframe then this indicator is the best.
About this indicator.
horizontal Lines are in pink (down) and blue(up) color grey (neutral)
10 horizontal lines are plotted each for a timeframe + Asset / Currency / Stock
Back ground represents UP/DOWN Trend based on EMA 200 with the current time frame.
RED-Dot and GREEN-Dot are buy sell signals of SSL Channel for current Time Frame.
You can choose only one type of indicator (EMA Crossover, Trend, ADX, MACD, SSL, CCI, STOCHASTIC, RSI, HMA, QQE, WAE) for all the 10-lines
Select Asset and Timeframe for Each Line on the Graph.
Based on the color of the line and changes on Multi Timeframe you can ENTER/EXIT a Trade on current Timeframe.
Hence a Sniper Entry with multiple Indicator Screener

Chirped Sine Wave GeneratorINTRODUCTION:
The title pretty much sums up what this tool is, but not what it's for. It's NOT an indicator, just a chirped sine wave generator intended as a developer tool. Basically it sweeps from a very high frequency near the "Nyquist frequency" by chosen starting, step, and repetition rates to an ever decreasing lower frequency. This is typically viewed best on ALL, 5Y, or 1Y charts starting at bar_index==0 onward. Also, with the chart interval being intraday, you may use (ALT + SHIFT + ◀) keyboard shortcuts to jump back to barstate.isfirst. I will say, to witness a much broader scope of the sweep, having 4K is better for viewing it with the highest detailed resolution when making comparisons.
VISUAL AIDS:
When a frequency steps to another frequency a label displays the cycle period of the new frequency. This may be disabled to remove it's obstruction of view when overlaying indicators on top of it. I also included RMS levels that may be enabled.
USAGE:
As you can see above, I sourced TV built-in indicators to the "cSine Wave" plot, having varying results across the varying frequencies generated. Oscillating indicators and filters (ema, sma, etc...) of all sorts can be applied to it to inspect lag, amplitudes, or anomalies that render across the flux on the sweeping sine wave. Keep in mind market data has near infinite frequencies existing at any given time that can pop up or disappear instantly, so performance in theory on this swept synthetic waveform does not equate to performance on ANY ticker. It's gives you "ONE" totally different perspective to evaluate novel indicators.
OBSERVATIONS:
Witnessing the antiquated RSI on higher short frequencies, you will see it has a few issues, hmm. The amplitude is clamped near 50 at the Nyquist frequency growing with increasing amplitude in a funnel like shape. That doesn't imply it's a bad indicator, only there could be room for improvements... potentially. Wilder was calculating the RSI on paper basically, and the calculations were made as simple as possible in late 1970's. With advances in modern computing, many exotic permutations of RSI now exist attempting to improve upon it's original characteristics. EMA sourced to this tool appears in similar fashion to the RSI with it's own peculiarities. I suspect this occurs because EMA and RSI both use an IIR filter. CCI has a better representation across the spectral flux in this case, but that doesn't imply it's a perfect indicator on market data either. CCI could be improved as well...
REVELATIONS:
The chirped sine wave is only revealing a partial story about RSI's, EMA's, and CCI's attributes. In conclusion, how various frequencies affect our indicators, can be a bit more visually obvious using this tool, but it doesn't reveal all. For example, a 3D-RSI tells a different story when viewed in that perspective. Using a chirped sine wave, observations of ringing, weird frequency excitations, or no plot (na) may elude to more serious issues with an algorithm. In many cases, I often move the testing indicator pane to overlay the chirped sine wave pane for a more direct and precise inspection on 4K. I hope that gives you a better idea of this developer tool's intention and it's potentially limited but profound usage. I will be employing this upon nearly indicator fit for evaluation that I can utilize, upgrade, or invent in the future...

pandas_taLibrary "pandas_ta"
Level: 3
Background
Today is the first day of 2022 and happy new year every tradingviewers! May health and wealth go along with you all the time. I use this chance to publish my 1st PINE v5 lib : pandas_ta
This is not a piece of cake like thing, which cost me a lot of time and efforts to build this lib. Beyond 300 versions of this script was iterated in draft.
Function
Library "pandas_ta"
PINE v5 Counterpart of Pandas TA - A Technical Analysis Library in Python 3 at github.com
The Original Pandas Technical Analysis (Pandas TA) is an easy to use library that leverages the Pandas package with more than 130 Indicators and Utility functions and more than 60 TA Lib Candlestick Patterns.
I realized most of indicators except Candlestick Patterns because tradingview built-in Candlestick Patterns are even more powerful!
I use this to verify pandas_ta python version indicators for myself, but I realize that maybe many may need similar lib for pine v5 as well.
Function Brief Descriptions (Pls find details in script comments)
bton --> Binary to number
wcp --> Weighted Closing Price (WCP)
counter --> Condition counter
xbt --> Between
ebsw --> Even Better SineWave (EBSW)
ao --> Awesome Oscillator (AO)
apo --> Absolute Price Oscillator (APO)
xrf --> Dynamic shifted values
bias --> Bias (BIAS)
bop --> Balance of Power (BOP)
brar --> BRAR (BRAR)
cci --> Commodity Channel Index (CCI)
cfo --> Chande Forcast Oscillator (CFO)
cg --> Center of Gravity (CG)
cmo --> Chande Momentum Oscillator (CMO)
coppock --> Coppock Curve (COPC)
cti --> Correlation Trend Indicator (CTI)
dmi --> Directional Movement Index(DMI)
er --> Efficiency Ratio (ER)
eri --> Elder Ray Index (ERI)
fisher --> Fisher Transform (FISHT)
inertia --> Inertia (INERTIA)
kdj --> KDJ (KDJ)
kst --> 'Know Sure Thing' (KST)
macd --> Moving Average Convergence Divergence (MACD)
mom --> Momentum (MOM)
pgo --> Pretty Good Oscillator (PGO)
ppo --> Percentage Price Oscillator (PPO)
psl --> Psychological Line (PSL)
pvo --> Percentage Volume Oscillator (PVO)
qqe --> Quantitative Qualitative Estimation (QQE)
roc --> Rate of Change (ROC)
rsi --> Relative Strength Index (RSI)
rsx --> Relative Strength Xtra (rsx)
rvgi --> Relative Vigor Index (RVGI)
slope --> Slope
smi --> SMI Ergodic Indicator (SMI)
sqz* --> Squeeze (SQZ) * NOTE: code sufferred from very strange error, code was commented.
sqz_pro --> Squeeze PRO(SQZPRO)
xfl --> Condition filter
stc --> Schaff Trend Cycle (STC)
stoch --> Stochastic (STOCH)
stochrsi --> Stochastic RSI (STOCH RSI)
trix --> Trix (TRIX)
tsi --> True Strength Index (TSI)
uo --> Ultimate Oscillator (UO)
willr --> William's Percent R (WILLR)
alma --> Arnaud Legoux Moving Average (ALMA)
xll --> Dynamic rolling lowest values
dema --> Double Exponential Moving Average (DEMA)
ema --> Exponential Moving Average (EMA)
fwma --> Fibonacci's Weighted Moving Average (FWMA)
hilo --> Gann HiLo Activator(HiLo)
hma --> Hull Moving Average (HMA)
hwma --> HWMA (Holt-Winter Moving Average)
ichimoku --> Ichimoku Kinkō Hyō (ichimoku)
jma --> Jurik Moving Average Average (JMA)
kama --> Kaufman's Adaptive Moving Average (KAMA)
linreg --> Linear Regression Moving Average (linreg)
mgcd --> McGinley Dynamic Indicator
rma --> wildeR's Moving Average (RMA)
sinwma --> Sine Weighted Moving Average (SWMA)
ssf --> Ehler's Super Smoother Filter (SSF) © 2013
supertrend --> Supertrend (supertrend)
xsa --> X simple moving average
swma --> Symmetric Weighted Moving Average (SWMA)
t3 --> Tim Tillson's T3 Moving Average (T3)
tema --> Triple Exponential Moving Average (TEMA)
trima --> Triangular Moving Average (TRIMA)
vidya --> Variable Index Dynamic Average (VIDYA)
vwap --> Volume Weighted Average Price (VWAP)
vwma --> Volume Weighted Moving Average (VWMA)
wma --> Weighted Moving Average (WMA)
zlma --> Zero Lag Moving Average (ZLMA)
entropy --> Entropy (ENTP)
kurtosis --> Rolling Kurtosis
skew --> Rolling Skew
xev --> Condition all
zscore --> Rolling Z Score
adx --> Average Directional Movement (ADX)
aroon --> Aroon & Aroon Oscillator (AROON)
chop --> Choppiness Index (CHOP)
xex --> Condition any
cksp --> Chande Kroll Stop (CKSP)
dpo --> Detrend Price Oscillator (DPO)
long_run --> Long Run
psar --> Parabolic Stop and Reverse (psar)
short_run --> Short Run
vhf --> Vertical Horizontal Filter (VHF)
vortex --> Vortex
accbands --> Acceleration Bands (ACCBANDS)
atr --> Average True Range (ATR)
bbands --> Bollinger Bands (BBANDS)
donchian --> Donchian Channels (DC)
kc --> Keltner Channels (KC)
massi --> Mass Index (MASSI)
natr --> Normalized Average True Range (NATR)
pdist --> Price Distance (PDIST)
rvi --> Relative Volatility Index (RVI)
thermo --> Elders Thermometer (THERMO)
ui --> Ulcer Index (UI)
ad --> Accumulation/Distribution (AD)
cmf --> Chaikin Money Flow (CMF)
efi --> Elder's Force Index (EFI)
ecm --> Ease of Movement (EOM)
kvo --> Klinger Volume Oscillator (KVO)
mfi --> Money Flow Index (MFI)
nvi --> Negative Volume Index (NVI)
obv --> On Balance Volume (OBV)
pvi --> Positive Volume Index (PVI)
dvdi --> Dual Volume Divergence Index (DVDI)
xhh --> Dynamic rolling highest values
pvt --> Price-Volume Trend (PVT)
Remarks
I also incorporated func descriptions and func test script in commented mode, you can test the functino with the embedded test script and modify them as you wish.
This is a Level 3 free and open source indicator library.
Feedbacks are appreciated.
This is not the end of pandas_ta lib publication, but it is start point with pine v5 lib function and I will add more and more funcs into this lib for my own indicators.
Function Name List:
bton()
wcp()
count()
xbt()
ebsw()
ao()
apo()
xrf()
bias()
bop()
brar()
cci()
cfo()
cg()
cmo()
coppock()
cti()
dmi()
er()
eri()
fisher()
inertia()
kdj()
kst()
macd()
mom()
pgo()
ppo()
psl()
pvo()
qqe()
roc()
rsi()
rsx()
rvgi()
slope()
smi()
sqz_pro()
xfl()
stc()
stoch()
stochrsi()
trix()
tsi()
uo()
willr()
alma()
wcx()
xll()
dema()
ema()
fwma()
hilo()
hma()
hwma()
ichimoku()
jma()
kama()
linreg()
mgcd()
rma()
sinwma()
ssf()
supertrend()
xsa()
swma()
t3()
tema()
trima()
vidya()
vwap()
vwma()
wma()
zlma()
entropy()
kurtosis()
skew()
xev()
zscore()
adx()
aroon()
chop()
xex()
cksp()
dpo()
long_run()
psar()
short_run()
vhf()
vortex()
accbands()
atr()
bbands()
donchian()
kc()
massi()
natr()
pdist()
rvi()
thermo()
ui()
ad()
cmf()
efi()
ecm()
kvo()
mfi()
nvi()
obv()
pvi()
dvdi()
xhh()
pvt()

robotrading ZeroCCIIt was not me who authored the strategy. I do not know who the real author of this strategy is. I read about it on wikipedia :) And decided to test the strategy on the cryptocurrency market. It turned out that this strategy really works. The strategy is very simple.
Indicator
CCI indicator with default settings is used. The settings can be changed. Nothing else is used.
Strategy
If CCI is more than 0, then open a long position (and close a short position).
If CCI is less than 0, then open a short position (and close a long position).
Reverse trading.

Multi Oscillators Price LevelsThis script draws price levels corresponding to the highest price reached in overbought situations, and the lowest price reached in oversold situations, depending on the oscillator and the timeframe the user has configured.
These levels correspond, most of time, to good supports and resistances prices.
Price levels drawings can be based on the following indicators:
Stochastic RSI (default)
Stochastic CCI
RSI
CCI
You can customize this indicator with the following options:
Source: The candle source to use in indicators calculation
Source Indicator: The indicator on which you cant to base your levels
Timeframe: The timeframe on which you want to apply the selected indicator, and calculate levels
Show supports/resistances: enable/disable price levels, depending on there status (overbought - resistances) / (oversold - supports)
Lines width: width of price levels. (set to 10 by default in order to draw "zones")
Supports/Resistances source: Select the candle data you cant to use to draw supports and resistances levels
Extend levels: Select the line extension for price levels
Levels color: Select the desired color for price levels
And of course , all parameters corresponding to the supported indicators (Stoch, RSI, CCI)
Here are a few examples of different configurations:
This script will probably be modified in the future, don't hesitate to suggest any improvement.

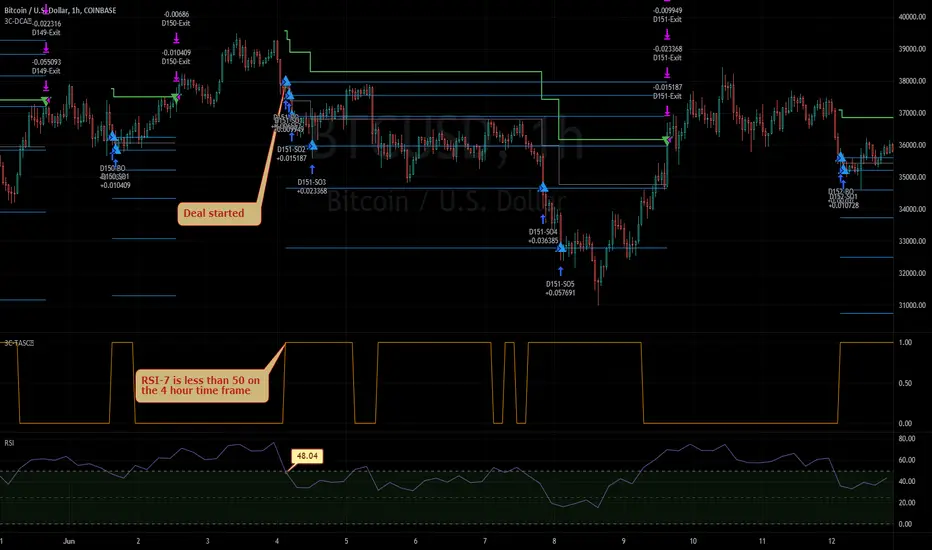
3Commas TA Start Conditions Indicator v1.0Introduction
The indicator attempts to implement the "Technical Analysis Starting Conditions" found in the 3Commas DCA trading bot settings.
How is it original and useful and how does it compare to other scripts in the Public Library?
This indicator is unique in that it's the only one (as of the initial publications) that can handle 5 signal indicator types at the same time as well as output the signal values either to the chart or the data window. The indicator supports all of the following 3Commas built-in indicators on the 3 minute, 5 minute, 15 minute, 30 minute, 1 hour, 2 hour, and 4 hour time frames:
RSI-7
ULT-7-14-2
BB-20-1-LB (Long)
BB-20-2-LB (Long)
MFI-14 crosses 40 (Long)
MFI-14 crosses 20 (Long)
CCI-40 crosses -200 (Long)
BB-20-1-UB (Short)
BB-20-2-UB (Short)
MFI-14 crosses 65 (Short)
CCI-40 crosses 0 (Short)
CCI-40 crosses 100 (Short)
What does it do and how does it do it?
When applied to the chart for the first time, the default settings are completely blank, so the only chart element you will see is the "Start Condition Result" line in orange. Once you start applying settings in the "DEAL START CONDITION" section, the indicator will redraw and display the new values for the "Start Condition Result" line. A value of 1 indicates that the results of the condition(s) is "passing". Conversely, a value of 0 indicates that the results of the condition(s) is NOT passing. If you desire to dig deeper into why the indicator is producing the results, you can enable the "Show TA Indicator # Plot" to visually see the values on the price chart or simply open the Data Window panel to see their values as you hover over the candles in the price chart.
This indicator can be used with any indicator in the Public Library that seeks to emulate the 3Commas Technical Analysis Starting Conditions for a signal provider. For example, this indicator can be used our own 3Commas DCA Bot Strategy v1.0 to aid in your backtesting analysis and build confidence that your bot will perform given historical market data that TradingView provides. When you do so, make sure that the "Strategy" input has the same values with the two indicator settings.
Enjoy! 😊👍
How to obtain access to the script?
You have two choices:
Use the "Website" link below to obtain access to this indicator, or
Send us a private message (PM) in TradingView itself.
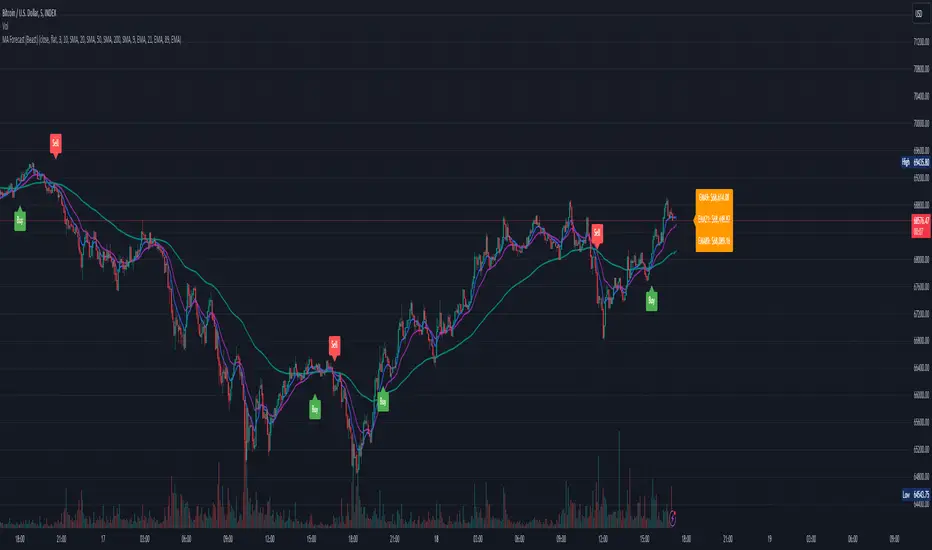
Moving Average Forecast (Beast)This script displays up to 8 lengths of moving averages using either the SMA , EMA, WMA, HMA, SWMA, VWMA or CCI and forecasts where the moving average will be in future periods (by removing the oldest periods and adding future prices based on either current price "flat" or a user-defined period linear regression "linreg".
Built on top of Triple MA Forecast by yatrader2, expanded it and added awesome features.
The following has been changed/added:
- Changed to pine script version 4
- Altered number of moving averages displayed up to 8
- Added multiple moving average types ( SMA , EMA , WMA, HMA, SWMA, VWMA, CCI )
* SMA - Simple moving average *
* EMA - Exponential moving average *
* WMA - Weighted moving average *
* HMA - Hull moving average *
* SWMA - Symmetrical weighted moving average *
* VWMA - Volume-weighted moving average *
* CCI - Commodity channel index *
- Fixed settings menu
- Added label with current moving average values (sorted by price)
- Cleaned up the logic
- Cleaned up the code
KJ MagicTrend Magic consists of two main calculation parts as momentum and volatility:
First part is ATR based (like ATR Trailing Stop) logic, second part is all about CCI which also determines the color of Trend Magic.
Blue: when CCI is positive
Red: when CCI is negative
Also added alert condition regarding price crosses :
when LOW CrossesAbove TM
and HIGH CrossesBelow TM
CCI45/SMA50 indy for 30 min SP500SPCFD:SPX
The script determines entry points using 45 period CCI and 50 period SMA.
Long condition: When CCI crosses up 150 treshold while price above 50 period SMA
Short condition: When CCI crosses down -150 treshold while price below 50 period SMA
Trades are executed above/below 1 point of high/low for long/short positions. Stops are just 1 point below/above of SMA. After 4 points of profit stops should be tightened. If you do not plan to hold the position for a long time, it can produce quick profit within 5-6 bars namely 2.5-3 hour. Otherwise you can manage the trade using SMA as trailing stop. This can be treated as a strategy of scalping which turns out a trend trading eventually if conditions good.
Have a nice trading

Commodity Channel Index + Relative Strength Index (Same Scale)Mashup, combining (adjusted) RSI and CCI.
These two indicators serve similar functions, but on different scales. I combined the two versions from the TradingView Built-In library into one chart, keeping the default setting for the CCI signal lines and fitting the RSI's default signal lines to them, so that they line up. I therefore adjusted the RSI to match the approximate range of the CCI and added additional lines to represent the maximum and minimum values of the RSI (0 - 100).
I did that by multiplying the RSI with 5, and subtracting 250.
Adjusted RSI = (RSI * 5) - 250
So the upper signal line (default: 70) now matches the line used for the CCI at 100. The lower signal line (default: 30) lines up with -100.
If you want to adjust them, you need to use the formula. I annotated the code if you want to dive deeper.
This indicator uses the original code and styling of the default Built-In RSI and CCI. Credit goes to the appropriate developers. My only intent is to mash up both of these indicators, making it easier to compare them.
Interpreting this indicator is the same as interpreting the underlying indicators. If you find any unexpected correlations, comment.
Trend MagicTrend Magic is originally a MT platform (MetaTrader) indicator and it can be used with any forex trading systems / strategies for additional confirmation of trading entries or exits. Converted the MT platform code to TradingView Pine version 4. Also you can use Multiple Time Frame.
It also works well with Crypto and Stock Markets.
Trend Magic consists of two main calculation parts as momentum and volatility:
First part is ATR based (like ATR Trailing Stop) logic, second part is all about CCI which also determines the color of Trend Magic.
Blue: when CCI is positive
Red: when CCI is negative
Also added alert condition regarding price crosses :
when LOW CrossesAbove TM
and HIGH CrossesBelow TM
Enjoy
Kıvanç Özbilgiç

TradeChartist Essential MTF Screener™TradeChartist Essential MTF Screener is an adaptive and powerful multi time frame screener toolkit for several essential trading indicators like RSI, Stochastic, CCI, MACD, 15 different Moving Averages, Heikin Ashi Trend and Net Volume, which can be visualised as a singular Indicator plot or as MTF Screener blocks showing absolute or trend-based colour coded Bull/Bear Strength along with real-time indicator value labels.
===================================================================================================================
™𝗧𝗿𝗮𝗱𝗲𝗖𝗵𝗮𝗿𝘁𝗶𝘀𝘁 𝗘𝘀𝘀𝗲𝗻𝘁𝗶𝗮𝗹 𝗠𝗧𝗙 𝗦𝗰𝗿𝗲𝗲𝗻𝗲𝗿 𝗨𝘀𝗲𝗿 𝗠𝗮𝗻𝘂𝗮𝗹
====================================================
MTF Screener can be used as a singular Time Frame screener plot or as colour coded screener blocks with several Time Frames (based on Time Frame Multiplier inputs) and based on user preference of the indicator such as RSI, Stoch, CCI, MACD, one of 15 Moving Averages, Heikin Ashi Trend or Net Volume from the 𝐈𝐧𝐝𝐢𝐜𝐚𝐭𝐨𝐫 𝐓𝐲𝐩𝐞 dropdown.
For RSI, Stoch, MACD and Moving Averages, Source price is required from the Sᴏᴜʀᴄᴇ dropdown (default - close). Sᴍᴏᴏᴛʜɪɴɢ input can be used to smooth the plot.
RSI, CCI and Stoch lengths are 14 as default and each of them have Uᴘᴘᴇʀ Bᴀɴᴅ and Lᴏᴡᴇʀ Bᴀɴᴅ inputs, which decides the colour of the screener block.
MACD has 3 inputs namely - Fᴀsᴛ Lᴇɴɢᴛʜ , Sʟᴏᴡ Lᴇɴɢᴛʜ and Sᴍᴏᴏᴛʜɪɴɢ and the default is the classic settings (12,26,9). Type of MA used can be chosen from under 𝟰. 𝗠𝗼𝘃𝗶𝗻𝗴 𝗔𝘃𝗲𝗿𝗮𝗴𝗲 section of the indicator settings. For classic MACD, use EMA which is default.
Moving Average has two inputs namely - MA ᴛʏᴘᴇ (which allows one of 15 Moving Averages) and MA Lᴇɴɢᴛʜ (default - 55).
Heikin Ashi Trend and Net Volume do not need any inputs.
===================================================================================================================
𝗠𝗧𝗙 𝗦𝗰𝗿𝗲𝗲𝗻𝗲𝗿 𝗕𝗹𝗼𝗰𝗸𝘀
Screener blocks are plotted as default and each row represents a specific Time Frame based on the Time Frame Multiplier (Default - 11 TF Multipliers from 1 to 2 in steps of 0.1) entered by the user in the 𝗦𝗰𝗿𝗲𝗲𝗻𝗲𝗿 𝗣𝗹𝗼𝘁𝘀 section. There are 11 maximum rows or Time Frame Multipliers that can be displayed. For example, if the user wants just 4 timeframes say, 1hr, 2hr , 4hr and Daily on a 1hr chart, the user should enter 4 in 𝐍𝐮𝐦𝐛𝐞𝐫 𝐨𝐟 𝐌𝐓𝐅 𝐒𝐜𝐫𝐞𝐞𝐧𝐞𝐫𝐬 input box and enter 1, 2, 4 and 24 in the Time-Frame Multiplier input boxes.
The Screener block colour can be changed from the settings. Each Screener row will have the data labels displayed in real-time as default ( Aʟʟᴏᴡ Rᴇᴘᴀɪɴᴛɪɴɢ (Cᴜʀʀᴇɴᴛ HTF Dᴀᴛᴀ) ). Disabling this will have Higher Time Frame data lag based on previous HTF close. Real-time data is recommended for live prices/data as it helps see the current dynamic.
Hᴇɪᴋɪɴ Asʜɪ Sᴄʀᴇᴇɴᴇʀ plots data based on Heikin Ashi chart on normal candle/bar chart.
Tʀᴇɴᴅ Bᴀsᴇᴅ Sᴄʀᴇᴇɴᴇʀ (ʀsɪ, sᴛᴏᴄʜ, ᴄᴄɪ) plots color coded screener blocks based on Upper and Lower bands input from the user. The colors change only when the upper/lower band is breached for the first time since the opposite band breach.
The MTF Screener blocks can be used visually on price chart by just moving the MTF Screener to main chart with the default Separate Screener Pane - Default under Lᴀʙᴇʟs Dɪsᴘʟᴀʏ Tʏᴘᴇ to keep the labels on chart. Having separate scales for security price and MTF Screener makes it possible to view the screener blocks on main chart.
Screener overlaid on Price Chart disables the MTF screener blocks but shows the MTF labels on price chart.
MTF Screener block colours can be changed from Screener Blocks colour settings and the Screener Label colour can be changed from Screener Label Colour settings.
===================================================================================================================
𝗦𝗰𝗿𝗲𝗲𝗻𝗲𝗿 𝗜𝗻𝗱𝗶𝗰𝗮𝘁𝗼𝗿 𝗣𝗹𝗼𝘁
Screener Indicator Plot is a singular plot of the user preferred timeframe multiplier (entered in Iɴᴅɪᴄᴀᴛᴏʀ Pʟᴏᴛ Tɪᴍᴇғʀᴀᴍᴇ Mᴜʟᴛɪᴘʟɪᴇʀ input box) of the Essential Indicator selected by the user.
To display the indicator plot, enable Dɪsᴘʟᴀʏ Iɴᴅɪᴄᴀᴛᴏʀ Pʟᴏᴛ (ᴅɪsᴀʙʟᴇs sᴄʀᴇᴇɴᴇʀ) . For example, if the selected plot is RSI, this displays RSI of the chosen Time Frame Multiplier along with the MTF Screener Labels without the blocks.
Screener Indicator Plot colours can be changed from Indicator/Screener Label colour settings and the Label colour can be changed from Lᴀʙᴇʟ Cᴏʟᴏᴜʀ (ғᴏʀ ɪɴᴅɪᴄᴀᴛᴏʀ ᴘʟᴏᴛ) .
The example chart below shows the use of both MTF Screener Blocks and Screener Indicator Plots of various essential indicators.
===================================================================================================================
Note: ™TradeChartist Essential MTF Screener is not a Signal generator and doesnt always reflect the trend when using MTF Screener blocks. Using relatively higher Time Frame Multipliers can cause late trade entries on chart time frame. The Screener and labels help visualize the values and the relative trend where sensible using colour codes. Users must devise personal techniques to exploit and use this tool to suit their trading needs.
===================================================================================================================
Example Charts
1. BTC-USDT 1hr chart using multiple MTF Screeners
2. BTC-USDT 1hr chart using Net Volume Indicator Plot and MACD MTF Screener on chart.
3. BTC-USDT 4hr chart using Daily Heikin Ashi Trend plotted on the main chart + Daily RSI indicator plot on a separate MTF Screener pane connected to ™TradeChartist Plotter to display Divergences on Price chart.
4. BTC-USDT 4 hr chart as above example, connected to ™TradeChartist FibMaster to plot Auto Fibs and display Bull/Bear Zones based on RSI 60/40 breakout trends.
5. BTC-USDT 4 hr chart with 20 period Weekly Hull MA plotted on Main chart with 4hr, Daily and 3D 20 period Hull MA value labels with Daily MACD Indicator Plot with 1hr, 4hr and 12 hr MACD real-time value labels.
===================================================================================================================
Best Practice: Test with different settings first using Paper Trades before trading with real money
===================================================================================================================
This is not a free to use indicator. Get in touch with me (PM me directly if you would like trial access to test the indicator)
Premium Scripts - Trial access and Information
Trial access offered on all Premium scripts.
PM me directly to request trial access to the scripts or for more information.
===================================================================================================================
