Overbought & Oversold HeatmapThe Broadview OBOS Heatmap is a new indicator that takes commonly used oscillators and transforms them into a powerful heatmap, providing traders and investors with an unparalleled level of insight into market trends and cycles. With the ability to visualize 15 different oscillators all at once, the Broadview Overbought & Oversold Heatmap offers users the ability to control and analyze an impressive array of indicators.
The Relative Strength Index (RSI) is a momentum oscillator that measures the speed and change of price movements. It is often used to identify overbought and oversold conditions in the market. The Money Flow Index (MFI) is a volume-weighted version of the RSI, used to measure buying and selling pressure. The Commodity Channel Index (CCI) is a versatile oscillator used to measure momentum, trend, and overbought/oversold conditions. It is often used to identify trend reversals.
The Aroon Oscillator is a trend-following oscillator that measures the strength of a trend and the potential for a trend reversal. The Relative Volatility Index (RVI) is a volatility-based oscillator that measures the strength of a trend and potential trend reversals. The Stochastic Detrended Price Oscillator is a momentum oscillator that measures the difference between the current price and its moving average.
The Stochastic Elders Force Index is an oscillator used to measure buying and selling pressure. The Stochastic Relative Strength Index is a momentum oscillator used to measure the strength of a trend. The Stochastic Relative Vigor Index is a momentum oscillator used to measure the trend strength and potential reversals. The Stochastic Klinger Oscillator is a momentum oscillator that measures buying and selling pressure. The Stochastic Awesome Oscillator is a momentum oscillator that measures the difference between two moving averages.
The Stochastic Ultimate Oscillator is an oscillator used to measure the strength of a trend and potential reversals. The Stochastic Chande Momentum Oscillator is a momentum oscillator that measures the difference between two moving averages. The Stochastic On Balance Volume Oscillator is a volume-based oscillator used to measure the buying and selling pressure. The Stochastic MACD is a momentum oscillator that measures the difference between two moving averages.
The Broadview OBOS Heatmap is an extremely powerful indicator that reimagines commonly used oscillators as a heatmap, providing traders and investors with an unparalleled level of insight into market trends and cycles. With the ability to control and analyze 15 different oscillators at once, the Broadview Overbought & Oversold Heatmap offers users an incredibly comprehensive tool for analyzing market trends and making informed trading decisions.
Search in scripts for "CCI"

TRENDCATOR - Trend Of IndicatorsHello Traders :)
I am Only Fibonacci.
I would like to give you detailed information about this indicator that I have prepared.
With this tool you add to your chart, you can automatically draw the falling trend and rising trend lines of many indicators.
I've prepared a few extra nice things for you. With this indicator, you can see the instantaneous values of active trend lines and their distance from the indicator value.
We are now ready to introduce.
You can use this indicator in two languages. English and Turkish. The choice is yours.
When we enter the indicator settings, there is a group under the TREND heading. With the settings in this group, you can determine the sensitivity of the trends to be plotted. The lower the sensitivity, the less reliable the plotted trends will be. I am sure you will find the middle ground.
Trends are calculated by relationships between all detected peaks.
If you check the Show Data box, you can see the value of the active (unbroken) trends in the current candle. Sometimes it can create visual pollution. So you can remove it. Below will be a version view where the values of the trendlines are visible.
With this tool, you can add any indicator you choose from the settings section to the chart and draw the trend lines automatically.
You can add RSI, ATR, CCI, MFI, MOM and various moving averages to your chart and draw a trend line. Below will be an image of the Momentum indicator.
You can edit the following from the settings section of this tool:
The language you will use, EN-TR
Colors of trend texts
Trend sensitivity
Thickness and colors of downtrend and rising trendlines
Hide and show trends
Hide and show trend values
Changing the background and text color of the box where the indicator name appears
Determining the source of the selected indicator
Determining the period of the selected indicator
Determine the color of the line of the selected indicator
Note: If the period value is not used in the calculation formula of the indicator you selected, the period selected in the settings will not be included in the calculations.
Note 2: If the source value is not used in the calculation formula of the indicator you have chosen, the source value selected in the settings will not be used.
Broken, inactive trend lines disappear.

Divergence for Many [Dimkud - v5]Strategy is based on "Divergence for Many Indicators v4 ST" strategy by CannyTolany01
which is based on "Divergence for Many Indicator" indicator by LonesomeTheBlue
This strategy is searching for divergences on 18 indicators which you can select and optimise one by one.
Additionally you can connect any other External Indicator value. (just add this indicator the the chart and select option in settings)
To the original indicator/strategy I have added 9 additional indicators:
( Money Flow Index, Williams_Vix, Stochastic RSI , SMI Ergodic Oscillator, Volume Weighted MACD , Bull Bear Power, Balance of Power , Relative Volatility Index , Logistic Settings).
Converted strategy to v5 of Pine Script.
Added Static SL/TP in percents (%).
Added filters to filter enters:
1. Volume Weighted MACD - Multi-TimeFrame Filter
(It checks for histogram to falling or rising for a set periods of bars)
2. Money Flow Index - Multi-TimeFrame Filter
(It checks if MFI Oscillator is in the set diapason.
Also It checks if MFI is falling or rising for a set periods of bars )
3. ATR filter
(check changes in fast ATR to slow ATR )
Strategy shows good backtest results on many crypto tokens on 45m - 1h periods. (with parameters optimisation for every indicator)
To find best parameters - you can enable indicators one-by one, and optimise best parameters for each of them.
Then enable all indicators with successful results.
Optimise SL/TP.
Then try to enable and optimise filters (channels etc.)
The better is to optimise parameters separately for Short and Long trading. And run two separate bots (in settings enable only Long or only Short.)
Updates:
- Added visualisation for open trades (SL/TP)
- Added Volatility filter by ATR with many options for tests.
- Fixed some small bugs.
- Added second RSI filter (you can use two RSIs with different TF or settings)
- Updated ATR volatility and MFI filter. Removed non-effective options
- Added CCI filter
- Added option to Enable/Disable visualisation of TP/SL on chart
- Fixed one small quick bug. ("ATR filter short" was not working)
- Added Super Trend filter
- Added Momentum filter
- Added Volume Filter
- All "request.security" MultiTimeFrame calls changed to 100% non-repait function "f_security()"

Multi indicators tableThis is a comprehensive trading tool that presents an overview of the market in a tabular format. It consists of five distinct categories of trading indicators : Volatility, Trend, Momentum, Reversal, and Volume. Each category includes a series of indicators that are widely used in the trading communauty.
The Volatility category includes the Average True Range (ATR) and Bollinger Bands indicators. The Trend category comprises the Average Directional Index (ADX), four Exponential Moving Averages (EMAs), Aroon, Parabolic SAR, and the Supertrend. The Momentum category includes the Stochastic Relative Strength Index (StochRSI), Money Flow Index (MFI), Williams %R, Relative Strength Index (RSI), and Commodity Channel Index (CCI). The Reversal category includes Parabolic SAR, Moving Average Convergence Divergence (MACD), and PP Supertrend. Finally, the Volume category includes the Volume Exponential Moving Average (EMA) indicator.
The indicators states are easily readable, the indicator case is colored based on his actual state. A bullish color (green by default), a bearish color (red by default),
a very bullish color (dark green by default), a very bearish color (dark red by default) and a neutral color (gray by default) displayed when the indicator doesn't give us a clear signal. Some indicators do not have a very bullish or very bearish state. Concerning volatility indicators, the bullish color indicates high volatility, the bearish color indicates low volatility, and the neutral color indicates normal volatility.
Most of the indicators displayed in the table are customizable, and traders can choose to hide the categories they don't want to use. The Indicator provides a quick and easily readable view on the market and allows traders to reduce the number of indicators on their chart making it lighter and more readable.

Intrabar Analyzer [Kioseff Trading]Hello!
This indicator (Intrabar Analyzer) presents intrabar data in various derivative forms.
On-Chart Features
Traditional price data down to 1 min.
Heikin-Ashi price data down to 1 min.
Kagi price data down to 1 min.
Point & Figure price data down to 1 min.
Renko price data down to 1 min.
Linebreak price data down to 1 min.
LinReg channel
SMA
EMA
ALMA
Echomorphic Average (A @kaigouthro special!)
HMA
RMA
WMA
VWMA
VWAP
SWMA
SAR
Supertrend
On-Chart Features
Price x Volume graph
Intrabar technical rating
Positive volume index
Negative volume index
Price volume trend
RSI
%k
ROC
MFI
MFC
OBV
CCI
BBW
CMO
COG
KCW
MOM
RANGE
%r
Let's look at the objects populated by the indicator!
The image above shows what data correlates to the populated graphs!
Let's dial in on the price x volume graph.
The image above provides an example/explanation of the price x volume graph. All data is sourced from a lower timeframe (configurable - default = 1 minute).
Colors are configurable; the plot characters are configurable.
The numbers above show an alternative view of the price x volume graph!
Price graph
The price graph can populate 6 variations of price data: traditional, heikin-ashi, renko, point & figure, line break, and kagi.
The subsequent images will show all available forms of price data, in addition to a randomly selected, on-chart technical indicator!
Kagi + LinReg
Traditional + EMA
Renko + SAR
Point & Figure + ALMA
Heikin-Ashi + Supertrend
Line Break + VWAP
You can display up to three indicators concomitantly - all calculated using intrabar data!
Lastly, the indicator displays the TradingView calculated technical rating for the intrabar.
The technical ratings are multiplied by x100 and oriented left & right of the price box. Left values are negative; right values are positive. The "0" value is not shown; therefore, if the technical rating isn't highlighted then the rating is "0".
The image above shows the technical rating system in action (:
That's it!
This was a fun project and I'm certainly willing to add more - let me know if there's anything you'd like included.
Additionally, a future feature involves compatibility with any custom indicator! Stay tuned; thank you for checking this out (:
Thank you to @kaigouthro, TradingView and @PineCoders for providing some cool libraries to play with!

TTP OSC SuperTrendThis strategy instead of following the trend of the price it follows the trend of an oscillator.
You can follow the trend of RSI or CCI.
We use SuperTrend applied to either oscillator for entering a long.
Position can close from
- using a stop loss percentage parameter
- or when entering downtrend
- or when using TP% when the target is achieved
Ideas:
- Use the SuperTrend multiplier to match the oscillator behaviour, CCI moves less, so I use 1.5 multiplier. With RSI I use 3
- I find this strategy works great to do swing trades during bull markets. When backtesting BTCUSDT it outperforms buy and hold before the beginning of the bear market.
- Try RSI 7 instead of RSI 14 for faster response
Alerts
It supports separated payloads for each alert type:
1- Deal open
2- TP% reached
3- SL%
4- Downtrend deal close

TechnicalRating█ OVERVIEW
This library is a Pine Script™ programmer’s tool for incorporating TradingView's well-known technical ratings within their scripts. The ratings produced by this library are the same as those from the speedometers in the technical analysis summary and the "Rating" indicator in the Screener , which use the aggregate biases of 26 technical indicators to calculate their results.
█ CONCEPTS
Ensemble analysis
Ensemble analysis uses multiple weaker models to produce a potentially stronger one. A common form of ensemble analysis in technical analysis is the usage of aggregate indicators together in hopes of gaining further market insight and reinforcing trading decisions.
Technical ratings
Technical ratings provide a simplified way to analyze financial markets by combining signals from an ensemble of indicators into a singular value, allowing traders to assess market sentiment more quickly and conveniently than analyzing each constituent separately. By consolidating the signals from multiple indicators into a single rating, traders can more intuitively and easily interpret the "technical health" of the market.
Calculating the rating value
Using a variety of built-in TA functions and functions from our ta library, this script calculates technical ratings for moving averages, oscillators, and their overall result within the `calcRatingAll()` function.
The function uses the script's `calcRatingMA()` function to calculate the moving average technical rating from an ensemble of 15 moving averages and filters:
• Six Simple Moving Averages and six Exponential Moving Averages with periods of 10, 20, 30, 50, 100, and 200
• A Hull Moving Average with a period of 9
• A Volume-Weighted Moving Average with a period of 20
• An Ichimoku Cloud with a conversion line length of 9, base length of 26, and leading span B length of 52
The function uses the script's `calcRating()` function to calculate the oscillator technical rating from an ensemble of 11 oscillators:
• RSI with a period of 14
• Stochastic with a %K period of 14, a smoothing period of 3, and a %D period of 3
• CCI with a period of 20
• ADX with a DI length of 14 and an ADX smoothing period of 14
• Awesome Oscillator
• Momentum with a period of 10
• MACD with fast, slow, and signal periods of 12, 26, and 9
• Stochastic RSI with an RSI period of 14, a %K period of 14, a smoothing period of 3, and a %D period of 3
• Williams %R with a period of 14
• Bull Bear Power with a period of 50
• Ultimate Oscillator with fast, middle, and slow lengths of 7, 14, and 28
Each indicator is assigned a value of +1, 0, or -1, representing a bullish, neutral, or bearish rating. The moving average rating is the mean of all ratings that use the `calcRatingMA()` function, and the oscillator rating is the mean of all ratings that use the `calcRating()` function. The overall rating is the mean of the moving average and oscillator ratings, which ranges between +1 and -1. This overall rating, along with the separate MA and oscillator ratings, can be used to gain insight into the technical strength of the market. For a more detailed breakdown of the signals and conditions used to calculate the indicators' ratings, consult our Help Center explanation.
Determining rating status
The `ratingStatus()` function produces a string representing the status of a series of ratings. The `strongBound` and `weakBound` parameters, with respective default values of 0.5 and 0.1, define the bounds for "strong" and "weak" ratings.
The rating status is determined as follows:
Rating Value Rating Status
< -strongBound Strong Sell
< -weakBound Sell
-weakBound to weakBound Neutral
> weakBound Buy
> strongBound Strong Buy
By customizing the `strongBound` and `weakBound` values, traders can tailor the `ratingStatus()` function to fit their trading style or strategy, leading to a more personalized approach to evaluating ratings.
Look first. Then leap.
█ FUNCTIONS
This library contains the following functions:
calcRatingAll()
Calculates 3 ratings (ratings total, MA ratings, indicator ratings) using the aggregate biases of 26 different technical indicators.
Returns: A 3-element tuple: ( [(float) ratingTotal, (float) ratingOther, (float) ratingMA ].
countRising(plot)
Calculates the number of times the values in the given series increase in value up to a maximum count of 5.
Parameters:
plot : (series float) The series of values to check for rising values.
Returns: (int) The number of times the values in the series increased in value.
ratingStatus(ratingValue, strongBound, weakBound)
Determines the rating status of a given series based on its values and defined bounds.
Parameters:
ratingValue : (series float) The series of values to determine the rating status for.
strongBound : (series float) The upper bound for a "strong" rating.
weakBound : (series float) The upper bound for a "weak" rating.
Returns: (string) The rating status of the given series ("Strong Buy", "Buy", "Neutral", "Sell", or "Strong Sell").

supertrend with multiple filter strategythis indicator filters buy and sell signal from the supertrend base on various condition that the user can manually select.
as of now the following filter are included
buy and sell filter;
-Macd
-CCI
-EMA200
-LUX TRAMA
-Stochastic rsi
-MFI
EXIT SIGNAL CAN BE CHOSE BETWEEN ATR BAND OR BOLLINGER BAND
i am planning on keeping to add filters so if you have suggestion fell free to message me.
Oscillator ExtremesThe Oscillator Extremes indicator plots the normalized positioning of the selected oscillator versus the Bollinger Bands' upper and lower boundaries. Currently, this indicator has four different oscillators to choose from; RSI, CMO, CCI, and ROC.
When the oscillator pushes towards one extreme, it will bring the value of the prevailing line closer to zero. If the bullish or bearish line crosses the zero line, the oscillator is past the extreme of the Bollinger Band.
Example: If the RSI crosses over the upper boundary of the Bollinger, the bullish(green) line will cross under the zero line.
Crossovers of the bullish and bearish lines can indicate a shift in momentum and are a signal. Where the line crossing under, towards zero, is the prevailing trend. The plotted lines will highlight green(bullish) or red(bearish) to show the prevailing trend. This is similar to a DI+- crossover that is commonly associated with the ADX.
We have included an optional normalized ADX to help validate signals. The ADX will change color based on the slope of the ADX. Purple indicates a positive slope and white for a negative slope.

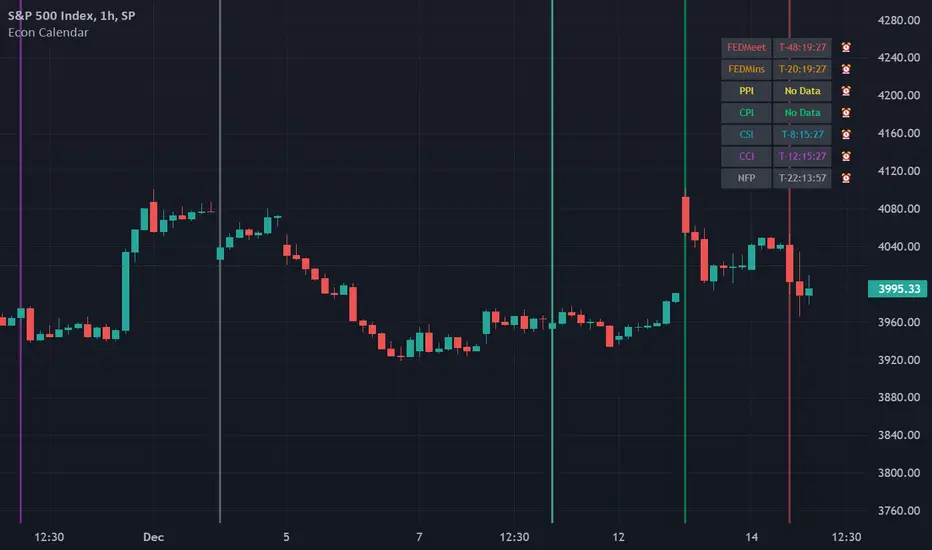
Odd_mod Econ CalendarA modification of Economic Calendar Events: FOMC, CPI, and more written by jdehorty . Please send all tips his way as he is maintaining the underlying data for the Calendar and the original concept.
List of changes:
Optimized code, will only run once on initialization now(No random line in middle of screen on bar change)
Legend - Added short names
Legend - Removed header
Legend - Made repositionable with selectable top margins
Legend - Removed data name from legend when it is disabled
Legend - Removed border
Original Description by jdehorty :
This script plots major events from the Economic Calendar that often correspond to major pivot points in various markets. It also includes built-in logic to retroactively adjust larger time intervals (i.e. greater than 1 hour) to be correctly aligned with the interval during which the event occurred.
Events are taken from the Economic Calendar and will be updated periodically at the following library:
EconomicCalendar
The above library can be used to conveniently access date-related data for major Meetings, Releases, and Announcements as integer arrays, which can be used in other indicators. Currently, it has support for the following events:
FOMC Meetings
The FOMC meets eight times a year to determine the course of monetary policy . The FOMC's decisions are based on a review of economic and financial developments and its assessment of the likely effects of these developments on the economic outlook.
FOMC Minutes
The FOMC minutes are released three weeks after each FOMC meeting. The minutes provide a detailed account of the FOMC's discussion of economic and financial developments and its assessment of the likely effects of these developments on the economic outlook.
Producer Price Index (PPI) Releases
The Producer Price Index (PPI) measures changes in the price level of goods and services sold by domestic producers. The PPI is a weighted average of prices of a basket of goods and services, such as transportation, food, and medical care. PPI is a leading indicator of CPI .
Consumer Price Index ( CPI ) Releases
The Consumer Price Index ( CPI ) measures changes in the price level of goods and services purchased by households. The CPI is a weighted average of prices of a basket of consumer goods and services, such as transportation, food, and medical care. CPI is one of the most widely used measures of inflation .
Consumer Sentiment Index ( CSI ) Releases
The University of Michigan's Consumer Sentiment Index ( CSI ) is a measure of consumer attitudes about the economy. The CSI is based on a monthly survey of U.S. households and reflects the consumers' assessment of present and future economic conditions. The CSI is a leading indicator of consumer spending, which accounts for about two-thirds of U.S. economic activity.
Consumer Confidence Index ( CCI ) Releases
The Consumer Confidence Index is a survey that measures how optimistic or pessimistic consumers are regarding their expected financial situation.
Non-Farm Payroll (NFP) Releases
The Non-Farm Payroll (NFP) is a measure of the change in the number of employed persons, excluding farm workers and government employees. The NFP is a leading indicator of consumer spending, which accounts for about two-thirds of U.S. economic activity.
[SPOILED]SteadyScalpyHi Traders,
This is my testing strategy which implemented Trading View's trailing stop loss feature. This strategy mainly focus on ETH/USDT perp contract15 minutes timeframe, backtest capital is set to 1000 USDT, 10% equity, 0.04% commission, limited backtest date from Jan 2022 to now, result as shown below. I have faith in this strategy, but still please use only a small amount of money to test, like 5-10% of your total capital.
The strategy contains a couple modules, entry module, trend filter module, take profit, and stop loss module.
How to use:
Stoch RSI:
5 MA types were provided which is HMA / VWMA / WMA / EMA / SMA , HMA with Length setting of 5, 8 seems to be most efficient. VWMA and WMA with 8, 13 will generate less entry signals but with less entry risks.
Price Step:
This is the core feature of this strategy and it is based on Demark9 and price action. With Step 1&2 enabled, it will generate more entry signals. signals can be filtered by trend magic. if disable this option, Stoch RSI will be the only entry signal left in this strategy.
Trend Magic:
Trend Magic uses CCI and ATR to calculate trend status; green means uptrend, red means downtrend, pretty straight forward; the best value for this indicator would be, 21, 34, 55, 89. Only long allow when trend magic turns green and vice versa.
Take Profit and Stop Loss:
The default value for TP is set to 0.4%. Once the price hits 0.4%, it begins trailing; once the price drawdown 0.01%, it will close trade. The orange line indicates the ATR trailing take profit; once 'close' crosses ATR, it will exit the trade immediately. I also added a failsafe as a final stop loss, when price movement exceeds threshold (default 1%), it will exit trade no matter what.
Enjoy :)

[SPOILED]SuperTrench - ETH Super ScalperHi Traders,
I'm republishing this script as I finally polished it to perfection IMO. The script uses 5 coding sections: entry, trend filter, pivot filter, take profit, and stop loss. The script mainly uses trailing as take profit; this is probably the easiest way to make a profitable scalper strategy.
Backtest capital is set to 1000 USDT, 35% equity, 0.04% commission, limited backtest date from Jan 2022 to now, backtested on ETH/USDT prep contracts 15m timeframe, result as shown below.
It looks unreal right? Hell no, I actually tested this strategy on Binance from Dec 06 to Dec 10. I got 8.29% return with 4x leverage, 50% equity setup; 75% win rate,1.58 profit factor, with 4.3% max drawdown, it is amazingly close to the backtest result.
User Manual
Entry >>> Stoch RSI:
I added 5 MA types to the Stoch RSI which is HMA/VWMA/WMA/EMA/SMA, HMA with Length setting of 5, 8 seems to be most efficient, VWMA and WMA with 8, 13 will generate less entry signals but with less entry risks.
Entry >>> R Style:
It based on price action, with candlestick makes a U turn, after 2nd candlestick confirmed, it generates entry signal, this will give you some extra entries, better leave it enabled.
Entry >>> Price Step:
This probably is the core feature of this strategy; also my secret ingredient to making this strategy this efficient. It is recommended to enable step 1-5, more steps basically means more entries, but they are not necessarily profitable.
Trend Filter >>> Price Step:
I couldn't tell you much details about how this indicator works, but it is a reliable indicator, based on price action, and I got some ideas from Demark9 indicator. The bigger the level, the stronger the filter is, please note that if 'Price Step Entries' less than Price Step Trend, entries will be ignored.
Pivot Filter >>> RSI Pivot & Pinbar Pivot:
RSI Pivot detects if the RSI signal line making U turn in certain condition, Pinbar detection combines R Style entry when price action U turn took place, these 2 pivot filter will close the trade once it is counter trend, so it better enable and leave it as is.
Trend Filter >>> Trend Magic:
Trend Magic uses CCI and ATR to calculate trend status, green means uptrend, red means downtrend, pretty straight forward, the best value for this indicator would be, 21, 34, 55, 89.
Trend Filter >>> Alpha:
This filter combines R style pivot, price step, EMA all together to detects consolidation area, because EMA was involved, so the best look back period would be around 15-35, it is best to use default value IMO, in another hands, if you need stronger filter, feel free to use 10, 18, 20, 25, 30, 35, make sure look back period should increase or decrease by 5 every time.
Take Profit and Stop Loss:
The default value for tp is set to 0.4%, but I also give you option to switch to ATR TP; you can adjust in the ATR multiplier, default ATR trailing stop loss uses 1 ATR, but you can adjust it for better drawdown tolerance. Fixed ATR SL is also given when fixed ATR is enabled. There will be a failsafe SL default set to 1% if price moves counter direction of opened position, it will close trade no matter what happens.
Enjoy :)

I_MACD#I_MACD #Version_1_0_3
Hello Traders from all over the world! Today I would like to share a cool customizing tool our team recently has made. If you have ever used MACD or any other seemingly indicators that visualize the degree of converging/diverging of any two values, you are very lucky today. This one should be one of the most optimal tools for you guys that enables you to customize your own CD indicator perfectly fitted for your trading styles. Moreover, you can even set up optimized parameters for each different trading commodities or products.
There is no doubt that MACD (Moving Average Convergence Divergence) is one of the most popular indicators currently in trading world along with RSI and Stochastic. Google and old textbooks say that MACD is a technical indicator that helps you identify market trends and potential trend reversal point. Well, which existing indicators doesn’t? The problem is, how well the indicator reflects the market trends with least amount of lagging. We want to use an indicator that can provide best-fitted trend data as early as possible.
Anyway, this indicator is made of 3 different components: MACD line, a signal line, and an oscillator, which is usually plotted with histogram. MACD line is basically the level of difference between two EMAs, 12 and 26 (default settings). In other words, MACD Line visualizes the amount of gap between 12 and 26 EMA.
- When bullish, 12 EMA would be above 26 EMA and as the trend becomes more bullish, they will diverge more and MACD line would be positive (above the base line).
- When bearish, 12 EMA would be below 26 EMA and as the trend becomes more bearish, they will diverge more and MACD line would be negative (below the base line).
MACD Line = (Faster, sensitive) EMA – (Slower, dull) EMA = 12 EMA – 26 EMA
Then you add another EMA on the MACD line itself which then becomes a signal line. The default length of the signal line is 9. In other words, Signal line is a 9 EMA of the difference level between 26 and 12 EMA. Now the difference between Signal line and MACD line are called oscillator usually plotted with histograms.
- When MACD line is above the Signal Line, histogram would face upward (Positive Side)
- When MACD line is below the Signal Line, histogram would face downward (Negative Side)
Signal Line = 9 EMA of MACD Line
Two meaningful signals should be monitored to effectively spot the trend reversal point.
1. Pay attention to the crossover made by the two lines. Higher the golden-cross and the lower the death-cross is located, more weights added on the possibility of trend reverse. I personally ignore most of the crossovers signaled near the base line.
2. Search for the histogram peak outs. When two lines start to converge (heading towards each other), histogram will leave a significant peak and approach towards baseline meaning that the oscillator started to lose its strength.
Remember, both the signals (lines’ crossovers and histogram peak outs) are more reliable and meaningful as they are located farther away from the baseline.
As mentioned, the default parameters for MACD are 12, 26, and 9. The first two numbers are the lengths of prices’ moving averages that are used to compute MACD line. 9 is length of signal line. Furthermore, the types of moving averages and signal line used in this setting provided by Tradingview are EMAs (Exponential moving averages). Therefore, the proper way to express the default setting of MACD would be 12, 26, 9, EMA, EMA.
I have a question for you MACD users. How is MACD doing lately? Are you fully satisfied with the performance? Some might say yes, but most wouldn’t. Well, I personally believe that the default parameters are bit outdated. It surely was a powerful weapon 50 years ago when MACD was just created by Gerald Appel and only few knew how to use it. Things are different now. We have witnessed so many cases where everyone starts to all use the same types and parameters of indicators, techniques, and theories which eventually drops accuracy and preciseness. Come on, we are not living in fairy tales, instead in an extremely competitive world called capitalism where only a few survives.
As we are already aware, this market keeps changing over time. Encountering various patterns, price actions, wave structures, and trend flows that are unfamiliar and untraditional, traders easily get frustrated. Market is not like it used to be in the old days where trading was much easier. What worked yesterday doesn’t anymore work today and not even tomorrow. Such evidences we see every day are broadening channel, stoploss hunting, Bart Simpson, whipsaw, and bull/bear trap were once considered as rare phenomenon.
I_MACD might be useful tool for you to back/forward test to find the optimized types and parameters of the CD indicator just fitted for your unique trading styles and preferences. There are infinite number of combinations of types and parameters within this indicator you can try. For example, not only the lengths of the moving averages, but different types of technical indicators to compute the CD lines can also be tested. Try all the possible combinations of parameters and if you find a good one, please share it with us on the comment section below! I will also let you guys know if I do. In fact, the default settings, ohlc4, 60, 140, 30 EMA, EMA, are one of many that I have found useful.
Furthermore, for your convenience when testing, we added a few side features as listed below. You can turn these on and off according to your preferences and circumstances.
1. Crossovers of MACD and Signal line: Death-crosses above the baseline and golden-crosses below the baseline will be spotted with a vertical line.
2. Divergence Sensitivity: This feature finds out both the regular and hidden divergences of MACD line. Higher sensitivity searches for the divergences within the waves of the larger degree and vice versa for the lower sensitivity.
3. Histogram Peak out: Triangle signals will appear when oscillator peak outs are possibility assumed in advance. Similarly, as the first feature positive peak outs are searched only when MACD line is positive and vice versa for the negative peak outs.
We all know there is no ‘Perfect’ method in this industry other than becoming Elon Musk, but there surely are ‘Better’ methods. Contemporary traders should track and reflect trends of the latest market on developing their methods. In order to process that task, testing and experimenting new and different techniques through insightful ways is required. I_MACD might be the ‘Perfect’ tool for you to be a ‘Better’ trader. Thanks for reading.
#아이맥디 #I_MACD #Version_1_0_3
안녕하세요. 트레이더 여러분. 토미입니다.
오늘은 MACD와 같은 CD(Convergence Divergence)류의 보조지표를 써 보신 분들이 정말 좋아하실 만한 지표 툴 하나를 소개 드리겠습니다. 이름하여 I_MACD! 아무나 자유롭게 사용하실 수 있습니다. 여러분의 트레이딩 성향, 종목 특성, 타임 프레임, 현대 시장 상황, 그리고 요즘 여러분이 생각하는 차트 흐름에 딱 맞는 지표를 만들고 사용해보세요.
MACD는 딱 두가지 신호만 주목하시면 됩니다. 첫번째 신호는 MACD선과 Signal선, 이 두 곡선이 서로 크로스 할 때, 즉 오실레이터가 양에서 음으로 혹은 음에서 양으로 변환되는 시점입니다. 두번째 신호는 오실레이터가 고/저점(Peak out)을 찍고 변곡이 시작되는 시점입니다. 이 외에 제가 전 다이버전스 강의에서 언급 드렸듯 두 곡선과 히스토그램의 다이버전스 역시 참고해볼 수 있습니다.
흔히 쓰이는 MACD의 기본(디폴트) 설정 값은 12, 26, 9이며 현재 트레이딩뷰에서 제공하는 MACD의 두 이평선, 즉 MACD선을 도출할 때 사용되는 주가의 12와 26 이평선의 종류는 EMA(Exponential Moving Average)입니다. 또한 저 설정 값에서 9는 Signal선의 길이를 의미하며 본 이평선 종류 역시 EMA입니다.
MACD는 제럴드 아펠이라는 아저씨가 1970년대에 개발한 지표입니다. 하지만 여러분들도 알다시피 현대 금융 시장은 50년 전과 많이 다릅니다. 세상은 점점 더 빠르고 예측불가하게 변하고 있으며 금융 시장도 예외는 아닙니다. 기술적분석 관점으로도 이전에는 흔히 나오지 않았던 패턴, 경향성, 규칙, 그리고 흐름들이 지금은 비일비재하게 나오고 있습니다. 이쪽 시장은 정해진 답안지가 없으며 시시각각 변하는 시장에 맞게 우리가 참고하는 기법과 전략들을 항상 업데이트해줄 필요가 있습니다.
MACD 역시 모든 사람들이 사용하는 12, 26, 9, EMA, EMA 보다 더 나은 설정 값이 분명 존재할 겁니다. 그래서 저희 팀은 여러분들이 CD지표의 파라미터 값과 곡선 산출법을 변경하여 더 요즘 시장에 그리고 여러분 트레이딩 성향에 최적화된 지표로 만들어 사용할 수 있는 툴을 만들어봤습니다. 두 곡선과 Signal 선의 길이는 물론이고 타 이평선들을 포함 RSI, OBV, CCI, MFI 등과 같은 다른 종류의 지표로도 CD선을 구할 수 있게끔 해 놨습니다.
예를 들어 조금 더 장기적인 추세를 반영하는 MACD를 만들고 싶다면 12, 26이 아니라 50, 100의 길이를 사용해볼 수도 있고 이평선의 민감도를 조절하고 싶다면 EMA가 아닌 HMA나 RMA 같은 종류로 설정해볼 수도 있습니다. 또한 이평선이 아니라 아예 다른 지표들을 가지고 MACD화(정확히 말하면 CD화죠) 시켜볼 수도 있습니다. 저도 이것저것 시도 중인데 꽤 흥미로운 셋팅 값들이 보이네요. 참고로 디폴트로 설정해 놓은 시고저종/4, 60, 140, 30, EMA, EMA 조합도 제가 현재 테스트하고 있는 나쁘지 않은 값입니다. 여러분들도 괜찮은 설정 값들을 찾으면 혼자만 쓰지 마시고 댓글에 공유 좀 부탁드립니다~
또한 주요 시그널들을 쉽게 잡아낼 수 있게 아래와 같이 몇 가지 자동 기능들을 추가했습니다. 여러분들의 편의와 상황에 따라 사용하셔도 되고 거슬리면 끄셔도 됩니다.
1. MACD선과 Signal선의 크로스: 기준선 위에선 데드크로스, 아래에선 골든크로스를 표시해줍니다.
2. 다이버전스 민감도: MACD선의 다이버전스 출현 여부를 알려줍니다. 다이버전스 민감도를 내릴수록 더 작은 (단기) 단위 파동들의, 올릴수록 더 큰 (장기) 단위의 파동들의 다이버전스를 잡습니다.
3. 히스토그램 피크 아웃: MACD선이 기준선 위에 있을 때는 양, 아래에 있을 때는 음 히스토그램의 변곡점으로 의심되는 곳을 표기해줍니다.
제가 매번 강조 드리지만 지표는 보조로만 참고하는 도구이며 절대적으로 다 맞는 지표, 이론, 그리고 방법론은 세상에 존재하지 않습니다. 시장 상황에 따라 적절히 활용하고 본인이 사용하는 기술적분석 기법들 조합의 일부로 참고만 하시는 게 좋습니다.

taLibrary "ta"
Collection of all custom and enhanced TA indicators. Same as enhanced_ta. But, removed all the displays to make it faster.
ma(source, maType, length)
returns custom moving averages
Parameters:
source : Moving Average Source
maType : Moving Average Type : Can be sma, ema, hma, rma, wma, vwma, swma, highlow, linreg, median
length : Moving Average Length
Returns: moving average for the given type and length
atr(maType, length)
returns ATR with custom moving average
Parameters:
maType : Moving Average Type : Can be sma, ema, hma, rma, wma, vwma, swma, highlow, linreg, median
length : Moving Average Length
Returns: ATR for the given moving average type and length
atrpercent(maType, length)
returns ATR as percentage of close price
Parameters:
maType : Moving Average Type : Can be sma, ema, hma, rma, wma, vwma, swma, highlow, linreg, median
length : Moving Average Length
Returns: ATR as percentage of close price for the given moving average type and length
bb(source, maType, length, multiplier, sticky)
returns Bollinger band for custom moving average
Parameters:
source : Moving Average Source
maType : Moving Average Type : Can be sma, ema, hma, rma, wma, vwma, swma, highlow, linreg, median
length : Moving Average Length
multiplier : Standard Deviation multiplier
sticky : - sticky boundaries which will only change when value is outside boundary.
Returns: Bollinger band with custom moving average for given source, length and multiplier
bbw(source, maType, length, multiplier, sticky)
returns Bollinger bandwidth for custom moving average
Parameters:
source : Moving Average Source
maType : Moving Average Type : Can be sma, ema, hma, rma, wma, vwma, swma, highlow, linreg, median
length : Moving Average Length
multiplier : Standard Deviation multiplier
sticky : - sticky boundaries which will only change when value is outside boundary.
Returns: Bollinger Bandwidth for custom moving average for given source, length and multiplier
bpercentb(source, maType, length, multiplier, sticky)
returns Bollinger Percent B for custom moving average
Parameters:
source : Moving Average Source
maType : Moving Average Type : Can be sma, ema, hma, rma, wma, vwma, swma, highlow, linreg, median
length : Moving Average Length
multiplier : Standard Deviation multiplier
sticky : - sticky boundaries which will only change when value is outside boundary.
Returns: Bollinger Percent B for custom moving average for given source, length and multiplier
kc(source, maType, length, multiplier, useTrueRange, sticky)
returns Keltner Channel for custom moving average
Parameters:
source : Moving Average Source
maType : Moving Average Type : Can be sma, ema, hma, rma, wma, vwma, swma, highlow, linreg, median
length : Moving Average Length
multiplier : Standard Deviation multiplier
useTrueRange : - if set to false, uses high-low.
sticky : - sticky boundaries which will only change when value is outside boundary.
Returns: Keltner Channel for custom moving average for given souce, length and multiplier
kcw(source, maType, length, multiplier, useTrueRange, sticky)
returns Keltner Channel Width with custom moving average
Parameters:
source : Moving Average Source
maType : Moving Average Type : Can be sma, ema, hma, rma, wma, vwma, swma, highlow, linreg, median
length : Moving Average Length
multiplier : Standard Deviation multiplier
useTrueRange : - if set to false, uses high-low.
sticky : - sticky boundaries which will only change when value is outside boundary.
Returns: Keltner Channel Width for custom moving average
kpercentk(source, maType, length, multiplier, useTrueRange, sticky)
returns Keltner Channel Percent K Width with custom moving average
Parameters:
source : Moving Average Source
maType : Moving Average Type : Can be sma, ema, hma, rma, wma, vwma, swma, highlow, linreg, median
length : Moving Average Length
multiplier : Standard Deviation multiplier
useTrueRange : - if set to false, uses high-low.
sticky : - sticky boundaries which will only change when value is outside boundary.
Returns: Keltner Percent K for given moving average, source, length and multiplier
dc(length, useAlternateSource, alternateSource, sticky)
returns Custom Donchian Channel
Parameters:
length : - donchian channel length
useAlternateSource : - Custom source is used only if useAlternateSource is set to true
alternateSource : - Custom source
sticky : - sticky boundaries which will only change when value is outside boundary.
Returns: Donchian channel
dcw(length, useAlternateSource, alternateSource, sticky)
returns Donchian Channel Width
Parameters:
length : - donchian channel length
useAlternateSource : - Custom source is used only if useAlternateSource is set to true
alternateSource : - Custom source
sticky : - sticky boundaries which will only change when value is outside boundary.
Returns: Donchian channel width
dpercentd(useAlternateSource, alternateSource, length, sticky)
returns Donchian Channel Percent of price
Parameters:
useAlternateSource : - Custom source is used only if useAlternateSource is set to true
alternateSource : - Custom source
length : - donchian channel length
sticky : - sticky boundaries which will only change when value is outside boundary.
Returns: Donchian channel Percent D
oscillatorRange(source, method, highlowLength, rangeLength, sticky)
oscillatorRange - returns Custom overbought/oversold areas for an oscillator input
Parameters:
source : - Osillator source such as RSI, COG etc.
method : - Valid values for method are : sma, ema, hma, rma, wma, vwma, swma, highlow, linreg, median
highlowLength : - length on which highlow of the oscillator is calculated
rangeLength : - length used for calculating oversold/overbought range - usually same as oscillator length
sticky : - overbought, oversold levels won't change unless crossed
Returns: Dynamic overbought and oversold range for oscillator input
oscillator(type, length, shortLength, longLength, source, highSource, lowSource, method, highlowLength, sticky)
oscillator - returns Choice of oscillator with custom overbought/oversold range
Parameters:
type : - oscillator type. Valid values : cci, cmo, cog, mfi, roc, rsi, stoch, tsi, wpr
length : - Oscillator length - not used for TSI
shortLength : - shortLength only used for TSI
longLength : - longLength only used for TSI
source : - custom source if required
highSource : - custom high source for stochastic oscillator
lowSource : - custom low source for stochastic oscillator
method : - Valid values for method are : sma, ema, hma, rma, wma, vwma, swma, highlow, linreg, median
highlowLength : - length on which highlow of the oscillator is calculated
sticky : - overbought, oversold levels won't change unless crossed
Returns: Oscillator value along with dynamic overbought and oversold range for oscillator input
multibands(bandType, source, maType, length, useTrueRange, sticky, numberOfBands, multiplierStart, multiplierStep)
multibands - returns Choice of oscillator with custom overbought/oversold range
Parameters:
bandType : - Band type - can be either bb or kc
source : - custom source if required
maType : Moving Average Type : Can be sma, ema, hma, rma, wma, vwma, swma, highlow, linreg, median
length : - Oscillator length - not used for TSI
useTrueRange : - if set to false, uses high-low.
sticky : - for sticky borders which only change upon source crossover/crossunder
numberOfBands : - Number of bands to generate
multiplierStart : - Starting ATR or Standard deviation multiplier for first band
multiplierStep : - Incremental value for multiplier for each band
Returns: array of band values sorted in ascending order
mbandoscillator(bandType, source, maType, length, useTrueRange, stickyBands, numberOfBands, multiplierStart, multiplierStep)
mbandoscillator - Multiband oscillator created on the basis of bands
Parameters:
bandType : - Band type - can be either bb or kc
source : - custom source if required
maType : Moving Average Type : Can be sma, ema, hma, rma, wma, vwma, swma, highlow, linreg, median
length : - Oscillator length - not used for TSI
useTrueRange : - if set to false, uses high-low.
stickyBands : - for sticky borders which only change upon source crossover/crossunder for band detection
numberOfBands : - Number of bands to generate
multiplierStart : - Starting ATR or Standard deviation multiplier for first band
multiplierStep : - Incremental value for multiplier for each band
Returns: oscillator currentStates - Array containing states for last n bars

WaveTrend 3D█ OVERVIEW
WaveTrend 3D (WT3D) is a novel implementation of the famous WaveTrend (WT) indicator and has been completely redesigned from the ground up to address some of the inherent shortcomings associated with the traditional WT algorithm.
█ BACKGROUND
The WaveTrend (WT) indicator has become a widely popular tool for traders in recent years. WT was first ported to PineScript in 2014 by the user @LazyBear, and since then, it has ascended to become one of the Top 5 most popular scripts on TradingView.
The WT algorithm appears to have origins in a lesser-known proprietary algorithm called Trading Channel Index (TCI), created by AIQ Systems in 1986 as an integral part of their commercial software suite, TradingExpert Pro. The software’s reference manual states that “TCI identifies changes in price direction” and is “an adaptation of Donald R. Lambert’s Commodity Channel Index (CCI)”, which was introduced to the world six years earlier in 1980. Interestingly, a vestige of this early beginning can still be seen in the source code of LazyBear’s script, where the final EMA calculation is stored in an intermediate variable called “tci” in the code.
█ IMPLEMENTATION DETAILS
WaveTrend 3D is an alternative implementation of WaveTrend that directly addresses some of the known shortcomings of the indicator, including its unbounded extremes, susceptibility to whipsaw, and lack of insight into other timeframes.
In the canonical WT approach, an exponential moving average (EMA) for a given lookback window is used to assess the variability between price and two other EMAs relative to a second lookback window. Since the difference between the average price and its associated EMA is essentially unbounded, an arbitrary scaling factor of 0.015 is typically applied as a crude form of rescaling but still fails to capture 20-30% of values between the range of -100 to 100. Additionally, the trigger signal for the final EMA (i.e., TCI) crossover-based oscillator is a four-bar simple moving average (SMA), which further contributes to the net lag accumulated by the consecutive EMA calculations in the previous steps.
The core idea behind WT3D is to replace the EMA-based crossover system with modern Digital Signal Processing techniques. By assuming that price action adheres approximately to a Gaussian distribution, it is possible to sidestep the scaling nightmare associated with unbounded price differentials of the original WaveTrend method by focusing instead on the alteration of the underlying Probability Distribution Function (PDF) of the input series. Furthermore, using a signal processing filter such as a Butterworth Filter, we can eliminate the need for consecutive exponential moving averages along with the associated lag they bring.
Ideally, it is convenient to have the resulting probability distribution oscillate between the values of -1 and 1, with the zero line serving as a median. With this objective in mind, it is possible to borrow a common technique from the field of Machine Learning that uses a sigmoid-like activation function to transform our data set of interest. One such function is the hyperbolic tangent function (tanh), which is often used as an activation function in the hidden layers of neural networks due to its unique property of ensuring the values stay between -1 and 1. By taking the first-order derivative of our input series and normalizing it using the quadratic mean, the tanh function performs a high-quality redistribution of the input signal into the desired range of -1 to 1. Finally, using a dual-pole filter such as the Butterworth Filter popularized by John Ehlers, excessive market noise can be filtered out, leaving behind a crisp moving average with minimal lag.
Furthermore, WT3D expands upon the original functionality of WT by providing:
First-class support for multi-timeframe (MTF) analysis
Kernel-based regression for trend reversal confirmation
Various options for signal smoothing and transformation
A unique mode for visualizing an input series as a symmetrical, three-dimensional waveform useful for pattern identification and cycle-related analysis
█ SETTINGS
This is a summary of the settings used in the script listed in roughly the order in which they appear. By default, all default colors are from Google's TensorFlow framework and are considered to be colorblind safe.
Source: The input series. Usually, it is the close or average price, but it can be any series.
Use Mirror: Whether to display a mirror image of the source series; for visualizing the series as a 3D waveform similar to a soundwave.
Use EMA: Whether to use an exponential moving average of the input series.
EMA Length: The length of the exponential moving average.
Use COG: Whether to use the center of gravity of the input series.
COG Length: The length of the center of gravity.
Speed to Emphasize: The target speed to emphasize.
Width: The width of the emphasized line.
Display Kernel Moving Average: Whether to display the kernel moving average of the signal. Like PCA, an unsupervised Machine Learning technique whereby neighboring vectors are projected onto the Principal Component.
Display Kernel Signal: Whether to display the kernel estimator for the emphasized line. Like the Kernel MA, it can show underlying shifts in bias within a more significant trend by the colors reflected on the ribbon itself.
Show Oscillator Lines: Whether to show the oscillator lines.
Offset: The offset of the emphasized oscillator plots.
Fast Length: The length scale factor for the fast oscillator.
Fast Smoothing: The smoothing scale factor for the fast oscillator.
Normal Length: The length scale factor for the normal oscillator.
Normal Smoothing: The smoothing scale factor for the normal frequency.
Slow Length: The length scale factor for the slow oscillator.
Slow Smoothing: The smoothing scale factor for the slow frequency.
Divergence Threshold: The number of bars for the divergence to be considered significant.
Trigger Wave Percent Size: How big the current wave should be relative to the previous wave.
Background Area Transparency Factor: Transparency factor for the background area.
Foreground Area Transparency Factor: Transparency factor for the foreground area.
Background Line Transparency Factor: Transparency factor for the background line.
Foreground Line Transparency Factor: Transparency factor for the foreground line.
Custom Transparency: Transparency of the custom colors.
Total Gradient Steps: The maximum amount of steps supported for a gradient calculation is 256.
Fast Bullish Color: The color of the fast bullish line.
Normal Bullish Color: The color of the normal bullish line.
Slow Bullish Color: The color of the slow bullish line.
Fast Bearish Color: The color of the fast bearish line.
Normal Bearish Color: The color of the normal bearish line.
Slow Bearish Color: The color of the slow bearish line.
Bullish Divergence Signals: The color of the bullish divergence signals.
Bearish Divergence Signals: The color of the bearish divergence signals.
█ ACKNOWLEDGEMENTS
@LazyBear - For authoring the original WaveTrend port on TradingView
@PineCoders - For the beautiful color gradient framework used in this indicator
@veryfid - For the inspiration of using mirrored signals for cycle analysis and using multiple lookback windows as proxies for other timeframes

Oscillator Workbench — Chart [LucF]█ OVERVIEW
This indicator uses an on-chart visual framework to help traders with the interpretation of any oscillator's behavior. The advantage of using this tool is that you do not need to know all the ins and outs of a particular oscillator such as RSI, CCI, Stochastic, etc. Your choice of oscillator and settings in this indicator will change its visuals, which allows you to evaluate different configurations in the context of how the workbench models oscillator behavior. My hope is that by using the workbench, you may come up with an oscillator selection and settings that produce visual cues you find useful in your trading.
The workbench works on any symbol and timeframe. It uses the same presentation engine as my Delta Volume Channels indicator; those already familiar with it will feel right at home here.
█ CONCEPTS
Oscillators
An oscillator is any signal that moves up and down a centerline. The centerline value is often zero or 50. Because the range of oscillator values is different than that of the symbol prices we look at on our charts, it is usually impossible to display an oscillator on the chart, so we typically put oscillators in a separate pane where they live in their own space. Each oscillator has its own profile and properties that dictate its behavior and interpretation. Oscillators can be bounded , meaning their values oscillate between fixed values such as 0 to 100 or +1 to -1, or unbounded when their maximum and minimum values are undefined.
Oscillator weight
How do you display an oscillator's value on a chart showing prices when both values are not on the same scale? The method I use here converts the oscillator's value into a percentage that is used to weigh a reference line. The weight of the oscillator is calculated by maintaining its highest and lowest value above and below its centerline since the beginning of the chart's history. The oscillator's relative position in either of those spaces is then converted to a percentage, yielding a positive or negative value depending on whether the oscillator is above or below its centerline. This method works equally well with bounded and unbounded oscillators.
Oscillator Channel
The oscillator channel is the space between two moving averages: the reference line and a weighted version of that line. The reference line is a moving average of a type, source and length which you select. The weighted line uses the same settings, but it averages the oscillator-weighted price source.
The weight applied to the source of the reference line can also include the relative size of the bar's volume in relation to previous bars. The effect of this is that the oscillator's weight on bars with higher total volume will carry greater weight than those with lesser volume.
The oscillator channel can be in one of four states, each having its corresponding color:
• Bull (teal): The weighted line is above the reference line.
• Strong bull (lime): The bull condition is fulfilled and the bar's close is above the reference line and both the reference and the weighted lines are rising.
• Bear (maroon): The weighted line is below the reference line.
• Strong bear (pink): The bear condition is fulfilled and the bar's close is below the reference line and both the reference and the weighted lines are falling.
Divergences
In the context of this indicator, a divergence is any bar where the slope of the reference line does not match that of the weighted line. No directional bias is assigned to divergences when they occur. You can also choose to define divergences as differences in polarity between the oscillator's slope and the polarity of close-to-close values. This indicator's divergences are designed to identify transition levels. They have no polarity; their bullish/bearish bias is determined by the behavior of price relative to the divergence channel after the divergence channel is built.
Divergence Channel
The divergence channel is the space between two levels (by default, the bar's low and high ) saved when divergences occur. When price has breached a channel and a new divergence occurs, a new channel is created. Until that new channel is breached, bars where additional divergences occur will expand the channel's levels if the bar's price points are outside the channel.
Price breaches of the divergence channel will change its state. Divergence channels can be in one of five different states:
• Bull (teal): Price has breached the channel to the upside.
• Strong bull (lime): The bull condition is fulfilled and the oscillator channel is in the strong bull state.
• Bear (maroon): Price has breached the channel to the downside.
• Strong bear (pink): The bear condition is fulfilled and the oscillator channel is in the strong bear state.
• Neutral (gray): The channel has not been breached.
█ HOW TO USE THE INDICATOR
Load the indicator on an active chart (see here if you don't know how).
The default configuration displays:
• The Divergence channel's levels.
• Bar colors using the state of the oscillator channel.
The default settings use:
• RSI as the oscillator, using the close source and a length of 20 bars.
• An Arnaud-Legoux moving average on the close and a length of 20 bars as the reference line.
• The weighted version of the reference line uses only the oscillator's weight, i.e., without the relative volume's weight.
The weighted line is capped to three standard deviations of the reference.
• The divergence channel's levels are determined using the high and low of the bars where divergences occur.
Breaches of the channel require a bar's low to move above the top of the channel, and the bar's high to move below the channel's bottom.
No markers appear on the chart; if you want to create alerts from this script, you will need first to define the conditions that will trigger the markers, then create the alert, which will trigger on those same conditions.
To learn more about how to use this indicator, you must understand the concepts it uses and the information it displays, which requires reading this description. There are no videos to explain it.
█ FEATURES
The script's inputs are divided in five sections: "Oscillator", "Oscillator channel", "Divergence channel", "Bar Coloring" and "Marker/Alert Conditions".
Oscillator
This is where you configure the oscillator you want to study. Thirty oscillators are available to choose from, but you can also use an oscillator from another indicator that is on your chart, if you want. When you select an external indicator's plot as the oscillator, you must also specify the value of its centerline.
Oscillator Channel
Here, you control the visibility and colors of the reference line, its weighted version, and the oscillator channel between them.
You also specify what type of moving average you want to use as a reference line, its source and its length. This acts as the oscillator channel's baseline. The weighted line is also a moving average of the same type and length as the reference line, except that it will be calculated from the weighted version of the source used in the reference line. By default, the weighted line is capped to three standard deviations of the reference line. You can change that value, and also elect to cap using a multiple of ATR instead. The cap provides a mechanism to control how far the weighted line swings from the reference line. This section is also where you can enable the relative volume component of the weight.
Divergence Channel
This is where you control the appearance of the divergence channel and the key price values used in determining the channel's levels and breaching conditions. These choices have an impact on the behavior of the channel. More generous level prices like the default low and high selection will produce more conservative channels, as will the default choice for breach prices.
In this section, you can also enable a mode where an attempt is made to estimate the channel's bias before price breaches the channel. When it is enabled, successive increases/decreases of the channel's top and bottom levels are counted as new divergences occur. When one count is greater than the other, a bull/bear bias is inferred from it. You can also change the detection mode of divergences, and choose to display a mark above or below bars where divergences occur.
Bar Coloring
You specify here:
• The method used to color chart bars, if you choose to do so.
• If you want to hollow out the bodies of bars where volume has not increased since the last bar.
Marker/Alert Conditions
Here, you specify the conditions that will trigger up or down markers. The trigger conditions can include a combination of state transitions of the oscillator and the divergence channels. The triggering conditions can be filtered using a variety of conditions.
Configuring the marker conditions is necessary before creating an alert from this script, as the alert will use the marker conditions to trigger.
Realtime values will repaint, as is usually the case with oscillators, but markers only appear on bar closes, so they will not repaint. Keep in mind, when looking at markers on historical bars, that they are positioned on the bar when it closes — NOT when it opens.
Raw values
The raw values calculated by this script can be inspected using the Data Window, including the oscillator's value and the weights.
█ INTERPRETATION
Except when mentioned otherwise, this section's charts use the indicator's default settings, with different visual components turned on or off.
The aim of the oscillator channel is to provide a visual representation of an oscillator's general behavior. The simplest characteristic of the channel is its bull/bear state, determined by whether the weighted line is above or below the reference line. One can then distinguish between its bull and strong bull states, as transitions from strong bull to bull states will generally happen when trends are losing steam. While one should not infer a reversal from such transitions, they can be a good place to tighten stops. Only time will tell if a reversal will occur. One or more divergences will often occur before reversals. This shows the oscillator channel, with the reference line and the thicker, weighted line:
The nature of the divergence channel 's design makes it particularly adept at identifying consolidation areas if its settings are kept on the conservative side. The divergence channel will also reveal transition areas. A gray divergence channel should usually be considered a no-trade zone. More adventurous traders can use the oscillator channel to orient their trade entries if they accept the risk of trading in a neutral divergence channel, which by definition will not have been breached by price. This show only the divergence channels:
This chart shows divergence channels and their levels, and colors bars on divergences and on the state of the oscillator channel, which is not visible on the chart:
If your charts are already busy with other stuff you want to hold on to, you could consider using only the chart bar coloring component of this indicator. Here we only color bars using the combined state of the oscillator and divergence channel, and we do not color the bodies of bars where volume has not increased. Note that my chart's settings do not color the candle bodies:
At its simplest, one way to use this indicator would be to look for overlaps of the strong bull/bear colors in both the oscillator channel and a divergence channel, as these identify points where price is breaching the divergence channel when the oscillator's state is consistent with the direction of the breach.
Tip
One way to use the Workbench is to combine it with my Delta Volume Channels indicator. If both indicators use the same MA as a reference line, you can display its delta volume channel instead of the oscillator channel.
This chart shows such a setup. The Workbench displays its divergence levels, the weighted reference line using the default RSI oscillator, and colors bars on divergences. The DV Channels indicator only displays its delta volume channel, which uses the same MA as the workbench for its baseline. This way you can ascertain the volume delta situation in contrast with the visuals of the Workbench:
█ LIMITATIONS
• For some of the oscillators, assumptions are made concerning their different parameters when they are more complex than just a source and length.
See the `oscCalc()` function in this indicator's code for all the details, and ask me in a comment if you can't find the information you need.
• When an oscillator using volume is selected and no volume information is available for the chart's symbol, an error will occur.
• The method I use to convert an oscillator's value into a percentage is fragile in the early history of datasets
because of the nascent expression of the oscillator's range during those early bars.
█ NOTES
Working with this workbench
This indicator is called a workbench for a reason; it is designed for traders interested in exploring its behavior with different oscillators and settings, in the hope they can come up with a setup that suits their trading methodology. I cannot tell you which setup is the best because its setup should be compatible with your trading methodology, which may require faster or slower transitions, thus different configurations of the settings affecting the calculations of the divergence channels.
For Pine Script™ Coders
• This script uses the new overload of the fill() function which now makes it possible to do vertical gradients in Pine. I use it for both channels displayed by this script.
• I use the new arguments for plot() 's `display` parameter to control where the script plots some of its values,
namely those I only want to appear in the script's status line and in the Data Window.
• I used my ta library for some of the oscillator calculations and helper functions.
• I also used TradingView's ta library for other oscillator calculations.
• I wrote my script using the revised recommendations in the Style Guide from the Pine v5 User Manual.

Economic Calendar Events: FOMC, CPI, and moreThis script plots major events from the Economic Calendar that often correspond to major pivot points in various markets. It also includes built-in logic to retroactively adjust larger time intervals (i.e. greater than 1 hour) to be correctly aligned with the interval during which the event occurred.
Events are taken from the Economic Calendar and will be updated periodically at the following library:
The above library can be used to conveniently access date-related data for major Meetings, Releases, and Announcements as integer arrays, which can be used in other indicators. Currently, it has support for the following events:
FOMC Meetings
The FOMC meets eight times a year to determine the course of monetary policy. The FOMC's decisions are based on a review of economic and financial developments and its assessment of the likely effects of these developments on the economic outlook.
FOMC Minutes
The FOMC minutes are released three weeks after each FOMC meeting. The minutes provide a detailed account of the FOMC's discussion of economic and financial developments and its assessment of the likely effects of these developments on the economic outlook.
Producer Price Index (PPI) Releases
The Producer Price Index (PPI) measures changes in the price level of goods and services sold by domestic producers. The PPI is a weighted average of prices of a basket of goods and services, such as transportation, food, and medical care. PPI is a leading indicator of CPI.
Consumer Price Index (CPI) Releases
The Consumer Price Index (CPI) measures changes in the price level of goods and services purchased by households. The CPI is a weighted average of prices of a basket of consumer goods and services, such as transportation, food, and medical care. CPI is one of the most widely used measures of inflation.
Consumer Sentiment Index (CSI) Releases
The University of Michigan's Consumer Sentiment Index (CSI) is a measure of consumer attitudes about the economy. The CSI is based on a monthly survey of U.S. households and reflects the consumers' assessment of present and future economic conditions. The CSI is a leading indicator of consumer spending, which accounts for about two-thirds of U.S. economic activity.
Consumer Confidence Index (CCI) Releases
The Consumer Confidence Index is a survey that measures how optimistic or pessimistic consumers are regarding their expected financial situation.
Non-Farm Payroll (NFP) Releases
The Non-Farm Payroll (NFP) is a measure of the change in the number of employed persons, excluding farm workers and government employees. The NFP is a leading indicator of consumer spending, which accounts for about two-thirds of U.S. economic activity.

RF+ Divergence Scalping SystemRF+ Divergence Scalping System + Custom Signals + Alerts.
This chart overlay indicator has been developed for the low timeframe divergence scalper.
Built upon the realtime divergence drawing code from the Divergence for Many indicator originally authored by Lonsometheblue, this chart overlay indicator bundles several additional unique features and modifications to serve as an all-in-one divergence scalping system. The current key features at the time of publishing are listed below (features are optional and can be enabled or disabled):
- Fully configurable realtime divergence drawing and alerting feature that can draw divergences directly on the chart using data sourced from up to 11 oscillators selected by the user, which have been included specifically for their ability to detect divergences, including oscillators not presently included in the original Divergence for Many indicator, such as the Ultimate Oscillator and TSI.
- Optional on chart table showing a summary of key statuses of various indicators, and nearby divergences.
- 2 x Range Filters with custom settings used for low timeframe trend detection.
- 3 x configurable multi-timeframe Stochastic RSI overbought and oversold signals with presentation options.
- On-chart pivot points drawn automatically.
- Automatically adjusted pivot period for up to 4 configurable time frames to fine tune divergences drawn for optimal divergence detection.
- Real-price line for use with Heikin Ashi candles, with styling options.
- Real-price close dots for use with Heikin Ashi candles, with styling options.
- A selection of custom signals that can be printed on-chart and alerted.
- Sessions indicator for the London, New York, Tokyo and Sydney trading sessions, including daylight savings toggle, and unique ‘invert background color’ option, which colours the entire chart - except the trading session you have selected, leaving your chart clear of distracting background color.
- Up to 4 fully configurable moving averages.
- Additional configurable settings for numerous built in indicators, allowing you to alter the lengths and source types, including the UO, TSI, MFI, TSV, 2 x Range Filters.
- Configurable RSI Trend detection signal filter used in a number of the signals, which filters buy signals where the RSI is over the RSI moving average, and only prints sell signals where RSI is under the moving average.
- Customisable on-chart watermark, with inputs for a custom title, subtitle, and also an optional symbol | timeframe | date feature.
The Oscillators able to be selected for use in drawing divergences at the time of publishing are as follows:
- Ultimate Oscillator (UO)
- True Strength Indicator (TSI)
- Money Flow Index (MFI)
- Cumulative Delta Volume (CDV)
- Time Segmented Volume (TSV)
- Commodity Channel Index (CCI)
- Awesome Oscillator
- Relative Strength Index (RSI)
- Stochastic
- On Balance Volume (OBV)
- MACD Histogram
What are divergences?
Divergence is when the price of an asset is moving in the opposite direction of a technical indicator, such as an oscillator, or is moving contrary to other data. Divergence warns that the current price trend may be weakening, and in some cases may lead to the price changing direction.
There are 4 main types of divergence, which are split into 2 categories;
regular divergences and hidden divergences. Regular divergences indicate possible trend reversals, and hidden divergences indicate possible trend continuation.
Regular bullish divergence: An indication of a potential trend reversal, from the current downtrend, to an uptrend.
Regular bearish divergence: An indication of a potential trend reversal, from the current uptrend, to a downtrend.
Hidden bullish divergence: An indication of a potential uptrend continuation.
Hidden bearish divergence: An indication of a potential downtrend continuation.
Setting alerts.
With this indicator you can set alerts to notify you when any/all of the above types of divergences occur, on any chart timeframe you choose, also when the triple timeframe Stochastic RSI overbought and oversold confluences occur, as well as when custom signals are printed.
Configurable pivot period values.
You can adjust the default pivot period values to suit your prefered trading style and timeframe. If you like to trade a shorter time frame, lowering the default lookback values will make the divergences drawn more sensitive to short term price action. By default, this indicator has enabled the automatic adjustment of the pivot periods for 4 configurable time frames, in a bid to optimize the divergences drawn when the indicator is loaded onto any of the 4 time frames selected. These time frames and their associated pivot periods can be fully reconfigured within the settings menu. By default, these have been further optimized for the low timeframe scalper trading on the 1-15 minute time frames.
How do traders use divergences in their trading?
A divergence is considered a leading indicator in technical analysis , meaning it has the ability to indicate a potential price move in the short term future.
Hidden bullish and hidden bearish divergences, which indicate a potential continuation of the current trend are sometimes considered a good place for traders to begin, since trend continuation occurs more frequently than reversals, or trend changes.
When trading regular bullish divergences and regular bearish divergences, which are indications of a trend reversal, the probability of it doing so may increase when these occur at a strong support or resistance level . A common mistake new traders make is to get into a regular divergence trade too early, assuming it will immediately reverse, but these can continue to form for some time before the trend eventually changes, by using forms of support or resistance as an added confluence, such as when price reaches a moving average, the success rate when trading these patterns may increase.
Typically, traders will manually draw lines across the swing highs and swing lows of both the price chart and the oscillator to see whether they appear to present a divergence, this indicator will draw them for you, quickly and clearly, and can notify you when they occur.
How do traders use overbought and oversold levels in their trading?
The oversold level is when the Stochastic RSI is above the 80 level is typically interpreted as being 'overbought', and below the 20 level is typically considered 'oversold'. Traders will often use the Stochastic RSI at, or crossing down from an overbought level as a confluence for entry into a short position, and the Stochastic RSI at, or crossing up from an oversold level as a confluence for an entry into a long position. These levels do not mean that price will necessarily reverse at those levels in a reliable way, however. This is why this version of the Stoch RSI employs the triple timeframe overbought and oversold confluence, in an attempt to add a more confluence and reliability to this usage of the Stoch RSI.
This indicator is intended for use in conjunction with related panel indicators including the TSI+ (True Strength Indicator + Realtime Divergences), UO+ (Ultimate Oscillator + Realtime Divergences), and optionally the STRSI+ (MTF Stochastic RSI + Realtime Divergences) and MFI+ (Money Flow Index + Realtime Divergences) available via this authors’ Tradingview profile, under the scripts section. The realtime divergence drawing code will not identify all divergences, so it is suggested that you also have panel indicators to observe. Each panel indicator also offers additional means of entry confirmation into divergence trades, for example, the Stochastic can indicate when it is crossing down from overbought or up from oversold, the TSi can indicate when the 2 TSI bands cross over one another upward or downward, and the UO and MFI can indicate an entry confluence when they are nearing, or crossing their centerlines, for more confidence in your divergence trade entries.
Additional information on the settings for this indicator can be found via the tooltips within the settings menu itself. Further information on feature updates, and usage tips & tricks will be added to the comments section below in due course.
Disclaimer: This indicator uses code adapted from the Divergence for Many v4 indicator authored by Lonesometheblue, and several stock indicators authored by Tradingview. With many thanks.

Williams %R (v.4)This is an upgrade and an update of my Williams %R indicator modification.
As before this implementation is enhanced with CCI in the form of background colors. These colors can be used as a confirmation signal and indication of a current trend. Thee also can be employed in deciding when to enter/exit the market.
Besides, added is a scaling function and Lower/Upper Bound inputs.
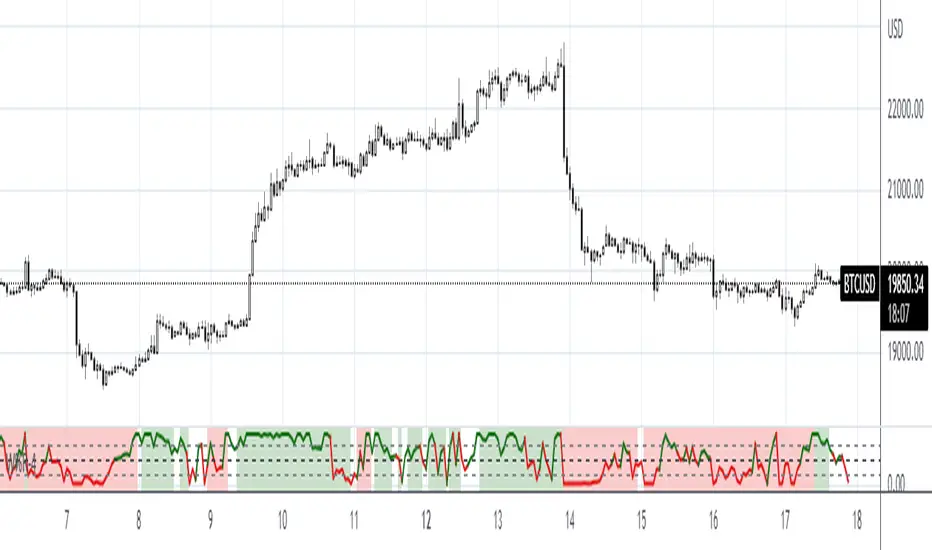
Indian Bank Nifty ScreenerIndian Bank Nifty Screener (IBNS) is a comprehensive table displaying the following parameters for Bank Nifty constituents:
Op = Open Price of the Day.
LaP = Last Price.
O-L = Open Price of the Day - Last Price.
ROC = Rate of Change .
SMA20 = Simple Moving Average 20 period.
S20d = Last Price - SMA 20.
SMA50 = Simple Moving Average 50 period.
S50d = Last Price - SMA 50.
SMA200 = Simple Moving Average 200 period.
S200d = Last Price - SMA 200.
ADX(14) = Average Directional Index.
RSI(14) = Relative Strength Index.
CCI(20) = Commodity Channel Index.
ATR(14) = Average True Range.
MOM(10) = Momentum.
CMF(20) = Chaikin Money Flow.
MACD = Moving Average Convergence Divergence.
Sig = MACD signal.
The first row displays individual banks on selection from Input Box in “Settings”.
User after visiting the “Settings” menu simply is required to select the “input symbol” from the stock listed in the “Option” Box. Automatically the selected bank name with parameter details is displayed in first row.
The other rows starting with “Nifty50” and with ” Bank Nifty” in second row, displays static individual Bank Nifty stocks starting from third row.

NimblrTA InSwing Public 1.0 (Beta)Hey Folks!
Presenting you the NimblrTA InSwing Beta Template.
This indicator is specifically to be used for Intraday (Time Frame 5M or 3M ) and Swing Trades (Time Frame 30M), that’s why the name “Intraday + Swing (InSwing)”
This script has taken in to concept of NimblrTA which is a combination of Candlestick ( IC / MC Breakout) + Multi timeframe CCI + Ascending/Descending Waves & Previous day high/low values.
Blue Line denotes previous day high
Orange Line denotes previous day low
Black line denotes Intraday Open
The Black dot is plotted above and below momentum candle which tells that there is volume support in momentum candle.
The white body candles are Indecision candles ( IC ), Red & Green body candles are momentum candles ( MC ) in the price flow. Blue candle is IC / MC Breakout up & Maroon candle is IC / MC Breakout down.
Template plots Buy & Sell Signal for easy tracking. All trades get ripe from Intraday so this template will help in timing the entries on real time rather than eod signals.
Later you can align Daily & Weekly TF for Medium to Longer term holding.
Alert option is also added so you can set Buy & Sell alert for easy tracking on your watch listed stocks.
The first Buy & Sell Signal is provisional and gets confirmed with second signal in the template. After that all signals are just adding the strength in the momentum you can use it for pyramiding or ignore it.
Pls note if you are swing trading on 30M TF then first buy/sell signal is enough to build positions don’t wait for confirmatory second signal.
Protip: whenever stock is in sell momentum from last 2-3 days and fresh buy is generated intraday, it’s a clear sign of quick change in trend.
Please note that you need to take Nimblr Waves concept (Overlaps & Impulse) in consideration along with Buy & Sell alerts/signal which is basic requirement to understand the structure of the trend.
For waves tracking (i.e HH, HL, LH & LL )you can use below zig zag indicator
Higher High Lower Low - Live
Following settings you can configure: Period 10, Source: Close/Open
After confirmatory Buy & Sell signal there can be chance stocks gives a Pullback so you can use Nimblr Wave concept to check pullback. Easiest way to check pullback is after confirmatory signal stocks pullback and takes support/resistance near previous day high/low or Intra open. Kindly use this template on decent volume stocks for proper signals.
Pls keep risk management in check and have proper money management plan while trading. After Buy/Sell signal stop loss you can use is Low/High of the day or Previous day close.
Any queries/suggestions do post on Trading View Forum.
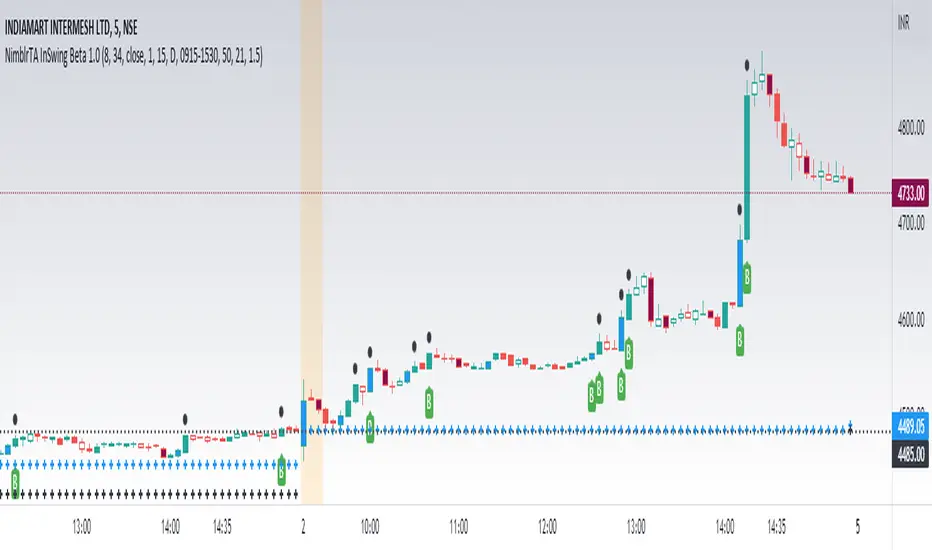
[blackcat] L3 Swing Trading ZonesLevel 3
Background
For swing trading, I consider a combination of multiple technical indicators to indicate periods of long and short positions.
Function
First, judge the daily-level long and short recommendations by the J value of the KDJ indicator in the weekly cycle. in addition. Second, draw bull-bear lines by integrating existing technical indicators such as rsi, adx, cci, dmi, etc. The bull line is above 0, the bear line is below 0, and the other is offsetting each other. When both are relatively close to the zero axis, it means that the strength is equal, and there will be signs of sideways.
Remarks
"D" timeframe ONLY.
Feedbacks are appreciated.
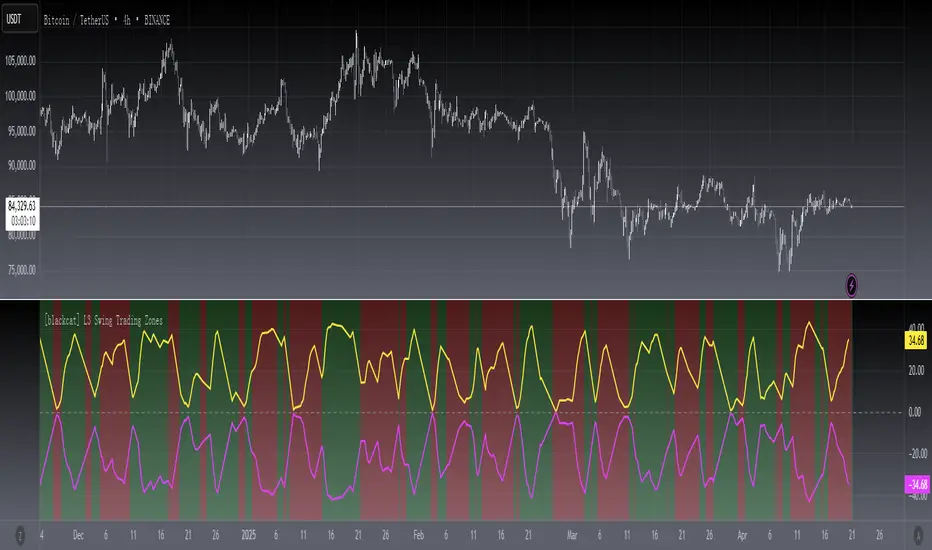
Nasdaq 100 ScreenerNasdaq 100 screener is comprehensive table displaying the following parameters :
Op = Open Price of the Day.
LaP = Last Price.
O-L = Open Price of the Day - Last Price.
ROC = Rate of Change .
SMA20 = Simple Moving Average 20 period.
S20d = Last Price - SMA 20.
SMA50 = Simple Moving Average 50 period.
S50d = Last Price - SMA 50.
SMA200 = Simple Moving Average 200 period.
S200d = Last Price - SMA 200.
ADX(14) = Average Directional Index.
RSI(14) = Relative Strength Index.
CCI(20) = Commodity Channel Index.
ATR(14) = Average True Range.
MOM(10) = Momentum.
AcDis(K) = Accumulation/Distribution.
CMF(20) = Chaikin Money Flow.
MACD = Moving Average Convergence Divergence.
Sig = MACD signal.
Nasdaq 100 stocks are divided into following alphabetical grouping for input access purpose under “Options” in “Settings” menu.
A to B 21 stocks “Input symbols” are listed under the “Options” in “Input A to B”
C to E 18 stocks “Input symbols” are listed under the head “Options” in “Input C to E”
F to L 19 stocks “Input symbols” are listed under the head “Options” in “Input F to L”
M to P 22 stocks “Input symbols” are listed under the head “Options” in “Input M to P”
R to Z 20 stocks “Input symbols” are listed under the head “Options” in “Input R to Z”
A to Z 100 stocks “Input symbols” are listed under the head “Options” in “Input A to Z”
User after visiting the “Settings” menu simply is required to select the “input symbol” from the stock listed under respective alphabetical Input lists to which the particular stock belongs. The resultant data is tabulated under respective row in Table .At a time User can see 5 different stocks i.e one each in different alphabetical lists in respective alphabetical order rows stated in the Table. User can scroll in each list to access and shift to any other stock in the list. In addition a Master list of all 100 stocks is given under “ Input A to Z “ at the last row of table.
Nasdaq 100 screener is a simple table , which facilitate to view 6 different stocks at a time (inclusive one from Master list of “Input A to Z” with a display of 19 parameters.
