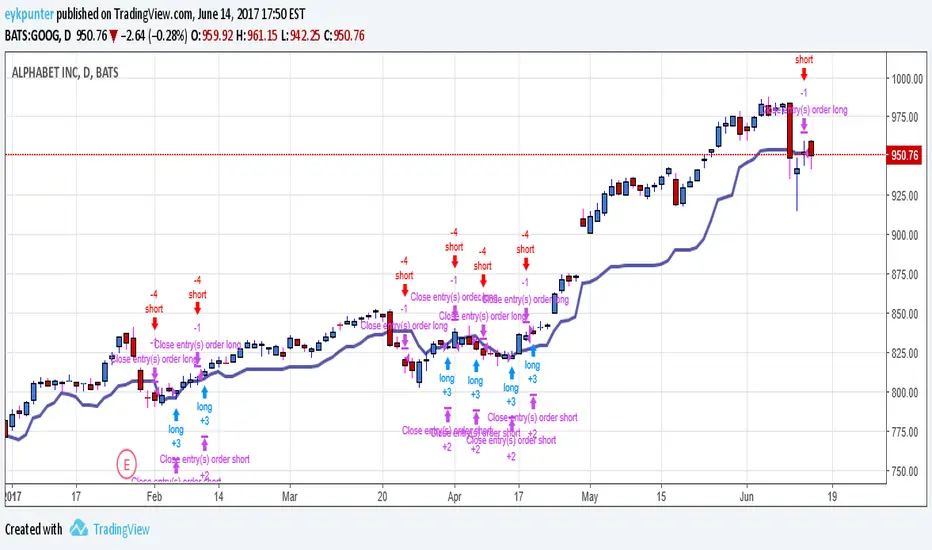
2-Period RSI strategy (with filter)2-period RSI strategy backtest described in several books of the trader Larry Connors . This strategy uses a 2 periods RSI , one slow arithmetic moving average and one fast arithmetic moving average.
Entry signal:
- RSI 2 value below oversold level (Larry Connors usually sets oversold to be below 5, but other authors prefer to work below 10 due to the higher number of signals).
- Closing above the slow average (200 periods).
- Entry at closing of candle or opening of next candle.
Exit signal:
- Occurs when the candlestick closes above the fast average (the most common fast average is 5 periods, but some traders also suggest the 10 period average).
Entry Filter (modification made by me):
- Applied an RSI2 arithmetic moving average to smooth out oscillations.
- Entered only when RSI2 is below oversold level and RSI2 moving average is below 30.
* NOTE: In the stocks that I evaluate daily the averages of 4 and 6 periods work very well as a filter.
Comments:
This strategy works very well in Daily charts but can be applied in other chart times as well. As this is a strategy to catch market fluctuations, it presents different results with different stocks.
I have been applying this strategy to the stocks of the Brazilian market (BOVESPA) and have enjoyed the result. Every day I evaluate the stocks that are generating entry signals and choose which one to trade based on the stocks with the highest Profit Value.
The RSI 2 averaging filter probably will reduce profit of the backtests because reduces the number of signals, but the Profit Value will usually increase. For me this was a good thing because without the filter, this strategy usually shows more signals than I have capital to allocate.
Before entering a trade I look at which fast average the paper has the highest Profit Value and then I use this average as my output signal for that trade (this change has greatly improved the result of the outputs).
This strategy does not use Stop Loss because normally Stop Loss decreases effectiveness (profit). In any case, the option to apply a percentage Stop Loss if desired is added in the script. As the strategy does not use stop, extra caution with risk management is advisable. I advise not to allocate more than 20% of the trade capital in the same operation.
I'm still studying ways to improve this strategy, but so far this is the best setup I've found. Suggestions are always welcome and we can test to see if they improve the backtest result.
Good luck and good trades.
================================================
Backtest das estratégia do IFR de 2 períodos descrita em varios livros do trader Larry Connors . Esta estratégia usa um IFR de 2 períodos, uma média movel aritmética lenta e uma média movel aritmética rápida.
Sinal de entrada:
- Valor do IFR 2 abaixo do nível de sobrevenda (Larry Connors usualmente define sobrevenda sendo abaixo de 5, mas outros autores preferem trabalhar abaixo de 10 devido ao maior número de sinais).
- Fechamento acima da média lenta (200 períodos).
- Realizado a compra no fechamento do candle ou na abertura do candle seguinte.
Sinal de saída:
- Ocorre quando o candle fecha acima da média rápida (a média rápida mais comum é a de 5 períodos, mas alguns traders sugerem também a média de 10 períodos).
Filtro para entrada (modificação feita por mim):
- Aplicado uma média móvel aritmética do IFR2 para suavisar as oscilações.
- Realizado a entrada apenas quando o IFR2 está abaixo do nível de sobrevenda e a média móvel do IFR2 está abaixo de 30.
*OBS: nos ativos que avalio diariamente as médias de 4 e 6 períodos funcionam muito bem como filtro.
Comentários:
Esta estratégia funciona muito bem no tempo gráfico Diário mas pode ser aplicada tambem em outros tempos gráficos. Como trata-se de uma estratégia para pegar oscilações do mercado, ela apresenta diferentes resultados com diferentes ativos.
Eu venho aplicando esta estratégia nos ativos do mercado brasileiro (BOVESPA) e tenho gostado do resultado. Diariamente eu avalio os papeis que estão gerando entrada e escolho qual irei realizar o trade baseado nos papeis que apresentam maior Profit Value.
O filtro da média do IFR 2 reduz o lucro nos backtests pois reduz também a quantidade de sinais, mas em compensação o Profit Value irá normalmente aumentar. Para mim isto foi algo positivo pois, sem o filtro, normalmente esta estratégia apresenta mais sinais do que possuo capital para alocar.
Antes de entrar em um trade eu olho em qual média rápida o papel apresenta maior Profit Value e então eu utilizo está média como meu sinal de saída para aquele trade (esta mudança tem melhorado bastante o resultado das saídas).
Está estratégia não utiliza Stop Loss pois normalmente o Stop Loss diminui a eficácia (lucro). De qualquer maneira, foi acrescentado no script a opção de aplicar um Stop Loss percentual caso seja desejado. Como a estratégia não utiliza stop é aconselhável um cuidado redobrado com o gerenciamento de risco. Eu aconselho não alocar mais de 20% do capital de trade em uma mesma operação.
Ainda estou estudando formas de melhorar esta estratégia, mas até o momento está é a melhor configuração que encontrei. Sugestões são sempre bem vindas e podemos testar para verificar se melhoram o resultado do backtest.
Boa sorte e bons trades.
Search in scripts for "algo"

Volty Expan Close StrategyVolty Expan Close Strategy, didnt really do anything except for change the parameters, would like to use a genetic algo to find the best params but i will leave it like this.

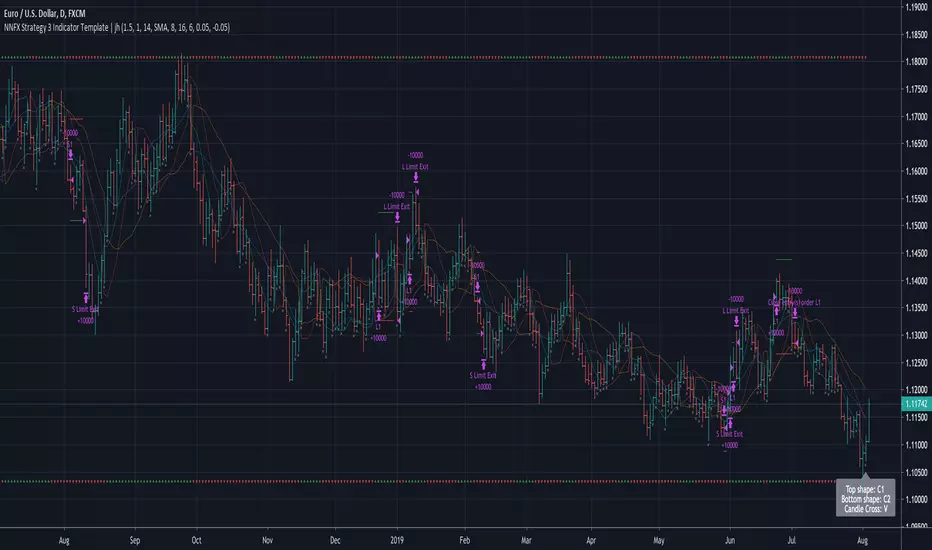
No Nonsense NNFX VP Strategy for Back Testing 3 x Indicators| jhAfter testing your individual indicators, it's time to build up your algo with additional indicators and further backtest the strategy.
Using SSL twice here, faster SSL for 1st confirmation, slower SSL for 2nd confirmation and TDFI for volume validation.


Matt's MACD Algo v1This script is meant to be viewed with the Heiken Ashi candlestick chart. I use it for pretty much everything. It has a lot of extra stuff just for visual reference, but the trades are based on the MACD (3,5,9) indicator. I found that speeding up the intervals of the MACD makes for a much more reactive chart. In this heavily volatile market, it has been performing well. If the market is not very volatile, it tends to have too many noisy signals. Any help or criticism would be greatly appreciated.

BTC Swinger v1Daily interval swing trading algorithm based on momentum techniques using ATR Stops. Made by Kory Hoang from Stably.
Shout out to the Advanced Crypto Asset Trading crew! ;)

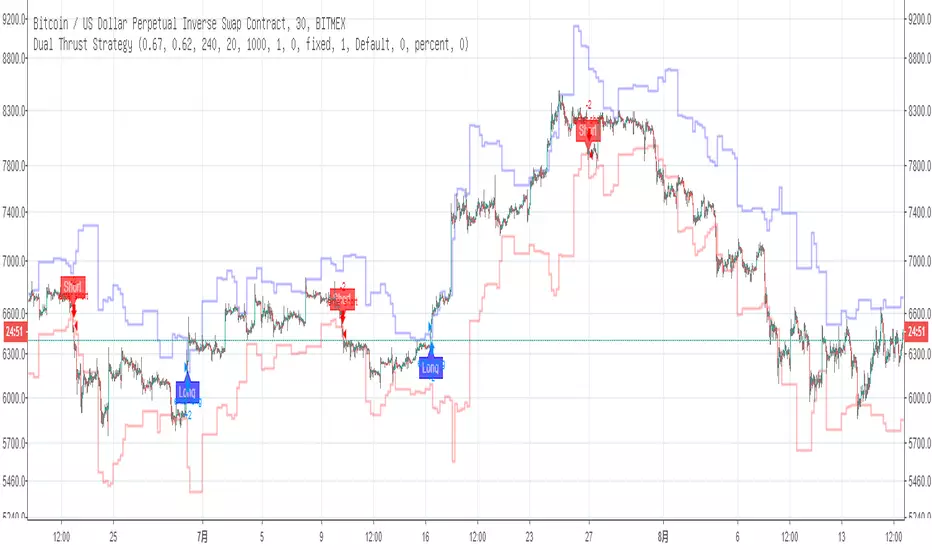
Dual Thrust StrategyThe Dual Thrust trading algorithm is a famous strategy developed by Michael Chalek. Its logical prototype is one of the most common Day trading strategies. The opening range breakout strategy is based on today’s opening price plus or minus a certain percentage of yesterday’s amplitude to determine the upper and lower rails. When the price breaks through the upper track, it will buy long, and when it breaks the lower track, it will sell short.
When using this strategy, on the one hand, you can refer to the optimal parameters of historical data testing. On the other hand, you can start to adjust K1 and K2 in stages according to your own judgment of the post-trend or from other major cycle technical indicators.
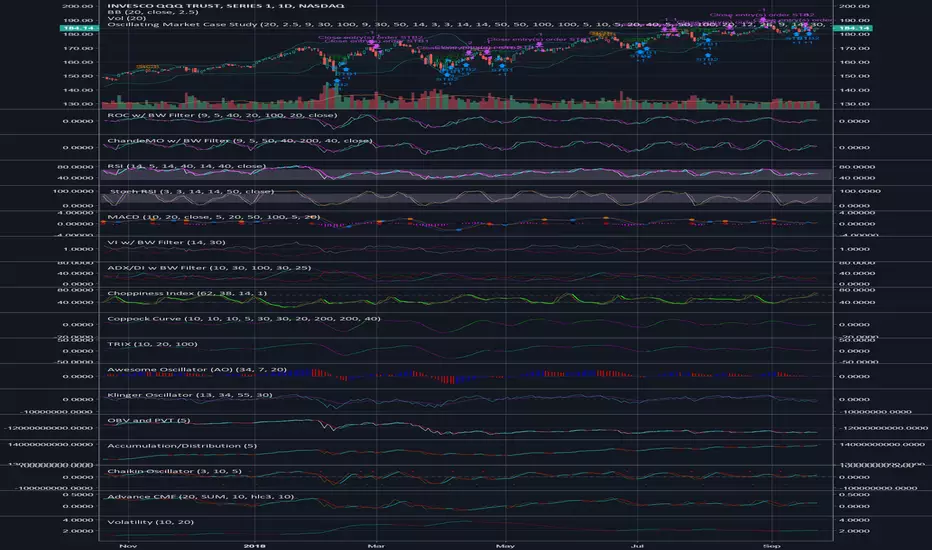
Oscillating Market Case StudyThis is a little something I created to analyze the market. Ultimately, I wanted to create something that could encapsulate the entire market as best as possible. The idea was simple, use technical analysis to create cases that would indicate entry positions and exit positions for long positions initially. After completing that, I decided to add a few shorting cases.
A combination of 25-30 indicators were used to create this, and the indicators were modified with a filter to create a smoothed overlay.
So here's the breakdown:
- 10 total cases: 7 long, 3 short
- The 7 long cases are broken down into three categories; long term, medium term, short term
- Short Term: OC1, OC2, STB1, STB2
- Medium Term: STB1, STB2
- Long Term: LTB1
- Shorting Cases: SC1, SC2, SC3
- The cases are both plotted as text and entry orders; this can be toggled on and off through the format menu.
I suggest you use the format menu to get the most out of this script. The menu consists of toggles to turn of the plots and/or the entries. It's pretty self explanatory. Use it to keep the chart cleared and concise so you only visualise the cases that you need.
Personally, the cases that have worked the best for me are:
- Long Cases: OC1, OC2, STB2, LTB1
- Shorting Cases: SC2, SC3
I kept this description as short as possible, but please feel free to reach out if you have any questions.
Pretty much, use the cases and see if it works for you.
Trend following with HAThis is my first script and it is basically a MA crossover/under strategy that uses heikin ashi closing prices. I've also used limit orders based on HA opening prices of the previous day for entry which improves the performance. However, this impose a restriction when prices are moving too fast and the algo is unable to enter the trade, resulting in a bad position for a long period, which I believe is preventing this strategy from performing better. Will appreciate any comments/ suggestions to improve this (such as enter market prices the next day when failed to enter on HA price - not sure if this is possible) as I'm still starting out and will be more than happy to learn from the community here. Cheers!
Momentum Line StrategyI got the idea of an algorithm using a gap, which would behave a bit like RSI, therefore I called it momentum. Don't know if it's very useful or how to improve it, it can keeps you in trends, however it suffers from whipsawing. My first attempt in programming a strategy.
Everyday 0003 _ MAC Pullback I recently posted a Moving Averge Crossover strategy for my Everyday project - a project I've given myself where I try to create one strategy everyday in between 15 minutes and 2 hours.
In the comments of my last published idea, user SignalTradersUK was very kind and suggested I try the following in my next study:
"i think your next study should be, to workout what to do after the Moving Average cross! If you look just on the chart you have posted, Price would appear to always come back to the levels where the 2 MA's cross and then go back in the direction of the crossing of the MA's. It's a great pull back strategy."
I'm really just beginning to learn about coding strategies so I'm not 100% sure I correctly understood his suggestion.
I admit I had difficulties wrapping my head around how to do this.
Anyway, the result is a strategy which runs alongside the main Moving Average Crossover.
'The Algorithm'
When the fast and slow MA cross the strategy traces back 40 days to find a swing low.
This swing low and the price at the MA cross is used to calculate a fib 1.272 extension.
The price at this 1.272 extension is used to place a Pullback short order.
Since we're shorting a bull trend, a tight stop is used.
If the pullback reaches down to the fib 0.618 we take profit (close the short).
Like I said, I don't know if I correctly understood SignalTradersUK feedback, but I really appreciate the
feedback and advice!
As always I'm hoping to learn from the community, so all feedback, corrections and advice is very welcome!
Thanks!
/pbergden

Put/call ratio cross - buy and sell SPYWhen 50DMA and 200DMA cross on PC, algo trades SPY accordingly

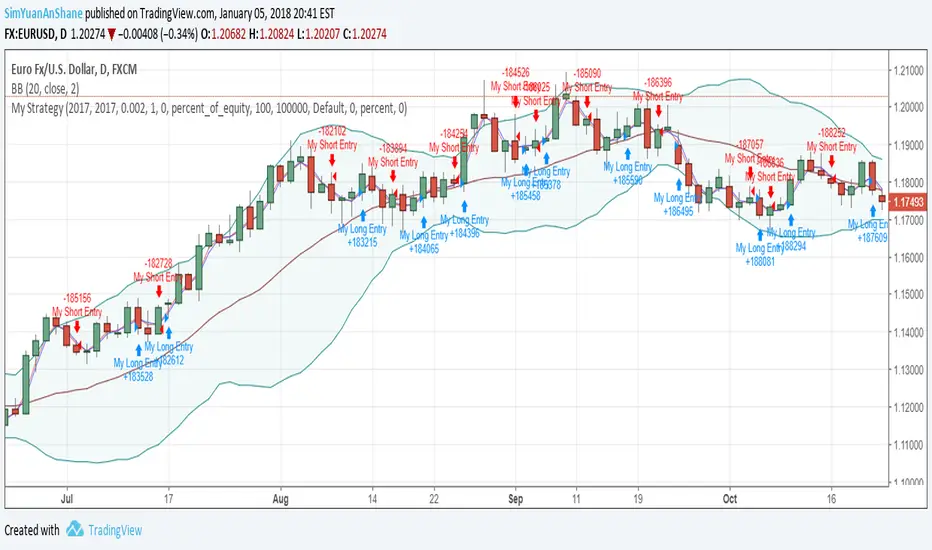
Forex Master (EUR/USD)ATTENTION:
This is a symmetrical algorithm designed only for trading EUR/USD on the 1h time frame. For other currency pairs and time frames, you need to re-calibrate the RSI-EMAs as well as the profit targets and stop losses.
BACKTEST CONDITIONS:
Initial equity = $100,000 (no leverage)
Order size = 100% of equity
Pyramiding = disabled
TRADING RULES:
Long entry = EMA20(RSI10) cross> 50
Profit limit = 50 pips
Stop loss = 50 pips
Short entry = EMA30(RSI30) cross< 50
Profit limit = 50 pips
Stop loss = 50 pips
Long entry = Short exit
Short entry = long exit
DISCLAIMER: None of my ideas and posts are investment advice. Past performance is not an indication of future results. This strategy was constructed with the benefit of hindsight and its future performance cannot be guaranteed.
