Simple RSI-MA Algo Beats DOW By Huge Margin Over Past 100 Years!This simple RSI-MA long/short algorithm beats the Dow by a FREAKING HUGE margin over the past century (excluding dividends and trading costs).
The algorithm uses a fast SMA of the RSI as a buy/cover signal and a slow SMA of the RSI as a sell/short signal.
Backtest period = 09/17/1916 - 11/02/2015
Dow = 98 --> 17,830 = +18,094% = 5.38% CAGR
Algorithm = net profit + open P/L = +43,349% = 6.31% CAGR
Notice how the algorithm dodged both the 30s' Great Depression and the 2008 Crisis. Pretty cool huh? :)
ALGORITHM'S FORMULA (use weekly chart):
Buy/Cover = MA10(RSI10) cross> 50
Sell/Short = MA50(RSI10) cross< 50
STRATEGY TESTER'S SETTINGS:
- Initial cash = $10,000
- Pyramiding disabled
- Re-investment enabled (order size = 100% of equity )
- Trade re-calculations disabled
DISCLAIMER: None of my ideas and posts are investment advice. Past performance is not an indication of future results. This strategy was constructed with the benefit of hindsight and its future performance cannot be guaranteed.
Search in scripts for "algo"

GRID SPOT TRADING ALGORITHM - GRID BOT TRADING STRATEGYGRID SPOT TRADING ALGORITHM : LONG ONLY STRATEGY OPEN SOURCE
This is a long only strategy for spot assets.
HOW IT WORKS
Grid trading is a trading strategy where an investor creates a so-called "price grid". The basic idea of the strategy is to repeatedly buy at the pre-specified price and then wait for the price to rise above that level and then sell the position (and vice versa with shorting or hedging).
FEATURES
Grids: This algorithm has a total of 10 grids.
Take profit: The trader can increase or decrease the distance between the grids from the User Interface panel, the distance between one grid and another represents the take profit.
Management: The algorithm buys 10% of the capital every time the price breaks down a grid and sells during a rise to the next higher grid. The initial capital is invested in 10 sizes which represent 10% of the capital per trade.
Stop Loss: The algorithm knows no stop loss as long as it is not activated from the User Interface panel. By activating the stop loss from the User Interface panel the algorithm will insert a close condition on all trades which will be calculated from the last lower grid.
Trades: Trades are opened only if the price is within the grid. If the market leaves the grid the algorithm will not buy new positions or sell new positions.
Optimal market conditions: The favorable market for this algorithm is the sideways market.
LIMITATIONS OF THE MODEL
The trader must take into account that this is a static model. It only works perfectly well if the market is in a sideways phase and incurs heavy losses if the market takes a downward trend. The model is unusable for an uptrend. The trader must therefore carefully analyze the market where he intends to use this strategy, making sure that the price is in a sideways phase.
USES
Indispensable research and backtesting tool for those using bots for their investments. The algorithm produces a backtesting of the strategy for past history. It is used by professional traders to understand if this strategy has been profitable on a market and what parameters to use for bots using this strategy (Kucoin, Binance etc.).
If you would like to develop your own algorithm with customized conditions based on a grid strategy, please contact us.
If you need help in using this tool, please contact us without hesitation.

Forex Master v4.0 (EUR/USD Mean-Reversion Algorithm)DESCRIPTION
Forex Master v4.0 is a mean-reversion algorithm currently optimized for trading the EUR/USD pair on the 5M chart interval. All indicator inputs use the period's closing price and all trades are executed at the open of the period following the period where the trade signal was generated.
There are 3 main components that make up Forex Master v4.0:
I. Trend Filter
The algorithm uses a version of the ADX indicator as a trend filter to trade only in certain time periods where price is more likely to be range-bound (i.e., mean-reverting). This indicator is composed of a Fast ADX and a Slow ADX, both using the same look-back period of 50. However, the Fast ADX is smoothed with a 6-period EMA and the Slow ADX is smoothed with a 12-period EMA. When the Fast ADX is above the Slow ADX, the algorithm does not trade because this indicates that price is likelier to trend, which is bad for a mean-reversion system. Conversely, when the Fast ADX is below the Slow ADX, price is likelier to be ranging so this is the only time when the algorithm is allowed to trade.
II. Bollinger Bands
When allowed to trade by the Trend Filter, the algorithm uses the Bollinger Bands indicator to enter long and short positions. The Bolliger Bands indicator has a look-back period of 20 and a standard deviation of 1.5 for both upper and lower bands. When price crosses over the lower band, a Long Signal is generated and a long position is entered. When price crosses under the upper band, a Short Signal is generated and a short position is entered.
III. Money Management
Rule 1 - Each trade will use a limit order for a fixed quantity of 50,000 contracts (0.50 lot). The only exception is Rule
Rule 2 - Order pyramiding is enabled and up to 10 consecutive orders of the same signal can be executed (for example: 14 consecutive Long Signals are generated over 8 hours and the algorithm sends in 10 different buy orders at various prices for a total of 350,000 contracts).
Rule 3 - Every order will include a bracket with both TP and SL set at 50 pips (note: the algorithm only closes the current open position and does not enter the opposite trade once a TP or SL has been hit).
Rule 4 - When a new opposite trade signal is generated, the algorithm sends in a larger order to close the current open position as well as open a new one (for example: 14 consecutive Long Signals are generated over 8 hours and the algorithm sends in 10 different buy orders at various prices for a total of 350,000 contracts. A Short Signal is generated shortly after the 14th Long Signal. The algorithm then sends in a sell order for 400,000 contracts to close the 350,000 contracts long position and open a new short position of 50,000 contracts).

ISM Indicator As a Strategy Here's a very easy code, plotting the ISM against the SPX. In this exercise, i wanted to see if one could use the ISM indicator only to generate buy/sell signal, and what would be the performance.
What is the ISM
The ISM Manufacturing Index monitors employment, production inventories, new orders and supplier deliveries.By monitoring the ISM Manufacturing Index, investors are able to better understand national economic conditions. When this index is increasing, investors can assume that the stock markets should increase because of higher corporate profits. The opposite can be thought of the bond markets, which may decrease as the ISM Manufacturing Index increases because of sensitivity to potential inflation.
Buy/Sell Signal
ISM above 50 usually good economic condition and vice versa when below 50 . For this code I used 48.50 as my buy/sell signal line.
Results
To test this on a longer time period, I use the SPX index instead of SPY. The results are surprisingly good. 76.92% profitability with 3.03 profit factor.
Conclusion
Investors could use the ISM with other indicators to determine better entry and exit point. I will see if combining the ISM with other custom indicators , could generate better result. Feel free to share your results here.
Cheers
Algo.

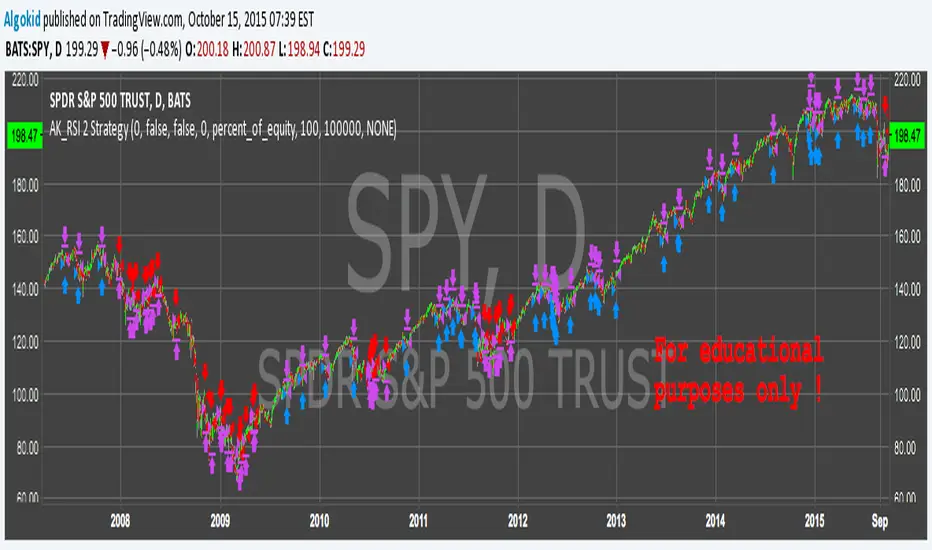
AK_RSI 2 Strategy ( based on Chris Moody RSI(2) indicator )Good Morning,
Republishing this in the script section to make the code visible to everyone. This strategy is based on Chris Moody's RSi(2) indicator. Good success rate on SPY. Again, this is for educational purposes only .
cheers
Algo
SPY Master v1.0This is a simple swing trading algorithm that uses a fast RSI-EMA to trigger buy/cover signals and a slow RSI-EMA to trigger sell/short signals for SPY, an xchange-traded fund for the S&P 500.
The idea behind this strategy follows the premise that most profitable momentum trades usually occur during periods when price is trending up or down. Periods of flat price actions are usually where most unprofitable trades occur. Because we cannot predict exactly when trending periods will occur, the algorithm basically bets money on all trade opportunities during all market conditions. Despite an accuracy rate of only 40%, the algorithm's asymmetric risk/reward profile allows the average winner to be 2x the average loser. The end result is a positive (profitable) net payout.
TRADING RULES:
Buy/Cover = EMA3(RSI2) cross> 50
Sell/Short = EMA5(RSI2) cross< 50
BACKTEST SETTINGS:
- Period = March 2011 - Present
- Initial capital = $10,000
- Dividends excluded
- Trading costs excluded
PERFORMANCE COMPARISON:
There are 657 trades, which means 1,314 orders. Assuming each order costs $2 (what I pay for at Interactive Brokers), total trading costs should be $2,628.
-SPY (buy & hold) = 132.73 ---> 193.22 = +45.57% (dividends excluded)
-SPY Master v1.0 = $12,649 - $2,628 = $10,021 = +100.21%
DISCLAIMER: None of my ideas and posts are investment advice. Past performance is not an indication of future results. This strategy was constructed with the benefit of hindsight and its future performance cannot be guaranteed.

Session Breakout Scalper Trading BotHi Traders !
Introduction:
I have recently been exploring the world of automated algorithmic trading (as I prefer more objective trading strategies over subjective technical analysis (TA)) and would like to share one of my automation compatible (PineConnecter compatible) scripts “Session Breakout Scalper”.
The strategy is really simple and is based on time conditional breakouts although has more ”relatively” advanced optional features such as the regime indicators (Regime Filters) that attempt to filter out noise by adding more confluence states and the ATR multiple SL that takes into account volatility to mitigate the down side risk of the trade.
What is Algorthmic Trading:
Firstly what is algorithmic trading? Algorithmic trading also known as algo-trading, is a method of using computer programs (in this case pine script) to execute trades based on predetermined rules and instructions (this trading strategy). It's like having a robot trader who follows a strict set of commands to buy and sell assets automatically, without any human intervention.
Important Note:
For Algorithmic trading the strategy will require you having an essential TV subscription at the minimum (so that you can set alerts) plus a PineConnecter subscription (scroll down to the .”How does the strategy send signals” headings to read more)
The Strategy Explained:
Is the Time input true ? (this can be changed by toggling times under the “TRADE MEDIAN TIMES” group for user inputs).
Given the above is true the strategy waits x bars after the session and then calculates the highest high (HH) to lowest low (LL) range. For this box to form, the user defined amount of bars must print after the session. The box is symmetrical meaning the HH and LL are calculated over a lookback that is equal to the sum of user defined bars before and after the session (+ 1).
The Strategy then simultaneously defines the HH as the buy level (green line) and the LL as the sell level (red line). note the strategy will set stop orders at these levels respectively.
Enter a buy if price action crosses above the HH, and then cancel the sell order type (The opposite is true for a stop order).
If the momentum based regime filters are true the strategy will check for the regime / regimes to be true, if the regime if false the strategy will exit the current trade, as the regime filter has predicted a slowing / reversal of momentum.
The image below shows the strategy executing these trading rules ( Regime filters, "Trades on chart", "Signal & Label" and "Quantity" have been omitted. "Strategy label plots" has been switched to true)
Other Strategy Rules:
If a new session (time session which is user defined) is true (blue vertical line) and the strategy is currently still in a trade it will exit that trade immediately.
It is possible to also set a range of percentage gain per day that the strategy will try to acquire, if at any point the strategy’s profit is within the percentage range then the position / trade will be exited immediately (This can be changed in the “PERCENT DAY GAIN” group for user inputs)
Stops and Targets:
The strategy has either static (fixed) or variable SL options. TP however is only static. The “STRAT TP & TP” group of user inputs is responsible for the SL and TP values (quoted in pips). Note once the ATR stop is set to true the SL values in the above group no longer have any affect on the SL as expected.
What are the Regime Filters:
The Larry Williams Large Trade Index (LWLTI): The Larry Williams Large Trade Index (LWTI) is a momentum-based technical indicator developed by iconic trader Larry Williams. It identifies potential entries and exits for trades by gauging market sentiment, particularly the buying and selling pressure from large market players. Here's a breakdown of the LWTI:
LWLTI components and their interpretation:
Oscillator: It oscillates between 0 and 100, with 50 acting as the neutral line.
Sentiment Meter: Values above 75 suggest a bearish market dominated by large selling, while readings below 25 indicate a bullish market with strong buying from large players.
Trend Confirmation: Crossing above 75 during an uptrend and below 25 during a downtrend confirms the trend's continuation.
The Andean Oscillator (AO) : The Andean Oscillator is a trend and momentum based indicator designed to measure the degree of variations within individual uptrends and downtrends in the prices.
Regime Filter States:
In trading, a regime filter is a tool used to identify the current state or "regime" of the market.
These Regime filters are integrated within the trading strategy to attempt to lower risk (equity volatility and/or draw down). The regime filters have different states for each market order type (buy and sell). When the regime filters are set to true, if these regime states fail to be true the trade is exited immediately.
For Buy Trades:
LWLTI positive momentum state: Quotient of the lagged trailing difference and the ATR > 50
AO positive momentum state: Bull line > Bear line (signal line is omitted)
For Sell Trades:
LWLTI negative momentum stat: Quotient of the lagged trailing difference and the ATR < 50
AO negative momentum state: Bull line < Bear line (signal line is omitted)
How does the Strategy Send Signals:
The strategy triggers a TV alert (you will neet to set a alert first), TV then sends a HTTP request to the automation software (PineConnecter) which receives the request and then communicates to an MT4/5 EA to automate the trading strategy.
For the strategy to send signals you must have the following
At least a TV essential subscription
This Script added to your chart
A PineConnecter account, which is paid and not free. This will provide you with the expert advisor that executes trades based on these strategies signals.
For more detailed information on the automation process I would recommend you read the PineConnecter documentation and FAQ page.
Dashboard:
This Dashboard (top right by defualt) lists some simple trading statistics and also shows when a trade is live.
Important Notice:
- USE THIS STRATEGY AT YOUR OWN RISK AND ALWAYS DO YOUR OWN RESEARCH & MANUAL BACKTESTING !
- THE STRATEGY WILL NOT EXHIBIT THE BACKTEST PERFORMANCE SEEN BELOW IN ALL MARKETS !

Orion Algo Strategy v2.0Hi everyone.
I decided to make the latest Orion Algo open to people. I don't have enough time to work on it lately, so I figured it would be best that everyone can have it to work on it. I took out some stuff from the original but it should give an idea on how things work. I made two strategies with this so far so you can use that to come up with your own. I recommend the DCA strategy because it gives you the most bang for Orion Algo's buck. It's pretty good at finding long entries.
Overall I hope you guys like this one. Also, Banano is the best crypto currency :)
-INFO-
Orion Algo is a trading algorithm designed to help traders find the highs and lows of the market before, during, and after they happen. We wanted to give an indicator to people that was simple to use. In fact we created the algorithm in such a way that it currently only needs a single input from the user. Since no indicator can predict the market perfectly, Orion should be used as just another tool (although quite a sharp one) for you to trade with. Fundamental knowledge of price action and TA should be used with Orion Algo.
Being an oscillator, Orion currently has a bias towards market volatility . So you will want to be trading markets over 30% volatility . We have plans to develop future versions that take this into account and adjust automatically for dead conditions. Also, while there are some similarities across all oscillators, what sets ours apart is the prediction curve. The prediction curve looks at the current signal values and gives it a relative score to approximate tops and bottoms 1-2 bars ahead of the signal curve. We also designed a velocity curve that attempts to predict the signal curve 2+ bars ahead. You can find the relative change in velocity in the Info panel. The bottom momentum wave is based on the signal curve and helps find overall market direction of higher time-frames while in a lower one.
Settings and How to Use them:
User Agreement – Orion Algo is a tool for you to use while trading. We aren’t responsible for losses OR the gains you make with it. By clicking the checkbox on the left you are agreeing to the terms.
Super Smooth – Smooths the main signal line based on the value inside the box. Lower values shift the pivot points to the left but also make things more noisy. Higher values move things to the right making it lag a bit more while creating a smoother signal. 8 is a good value to start with.
Theme – Changes the color scheme of Orion.
Dashboard – Turns on a dashboard with useful stats, such as Delta v, Volatility , Rsi , etc. Changing the value box will move the dashboard left and right.
Prediction – A secondary prediction model that attempts to predict a reversal before it happens (0-2bars). This can be noisy some times so make your best judgement. Curve will toggle a curve view of the prediction. Pivots will toggle bull/bear dots.
∆v – Delta v (change in velocity). This shows momentum of the signal. Crossing 0 signals a reversal. If you see the delta v changing direction, it may signify a reversal in the several bars depending on the overall momentum of the market.
Momentum Wave – Uses the signal as a macro trend indicator. Changes in direction of the wave can signify macro changes in the market. Average will toggle an averaging algorithm of the momentum waves and makes it easy to understand.
-STRATEGIES-
Simple - Just buy and sell on the dots
DCA - Uses the settings in the script for entries. If a buy dot appears then it will buy, if the price goes below the percentage it will wait for another dot before entering. This drastically improves DCA potential.

Mustang Algo - Momentum Trend Zone Backtest🐎 MUSTANG ALGO - Momentum Trend Zone Strategy
A complete trading system combining MACD momentum analysis with visual trend zones, full backtesting capabilities, and advanced risk management tools.
══════════════════════════════════════════════════════════════════════════
🔹 OVERVIEW
Mustang Algo transforms traditional MACD analysis into a powerful visual trading system. It instantly identifies market bias through colored background zones and provides clear entry/exit signals with customizable stop loss and take profit management.
══════════════════════════════════════════════════════════════════════════
🔹 KEY FEATURES
✅ Visual Trend Zones (Green = Bullish | Red = Bearish)
✅ Clear Buy/Sell Triangles on Chart
✅ Full Backtesting Engine
✅ Multiple Stop Loss Types
✅ Multiple Take Profit Types
✅ Trailing Stop Option
✅ Time Filter for Backtesting
✅ Real-time Info Panel
✅ Customizable Alerts
══════════════════════════════════════════════════════════════════════════
🔹 HOW IT WORKS
The strategy uses a smoothed MACD system to detect trend changes:
- MACD Line (White): Fast EMA minus Slow EMA - shows raw momentum
- Signal Line (Yellow): EMA of MACD - shows smoothed trend direction
- Trend Zone: Changes when the smoothed signal line crosses zero
- Entry Signals: Generated at zone transitions
When the trend line crosses above zero → GREEN zone → BUY signal 🔺
When the trend line crosses below zero → RED zone → SELL signal 🔻
══════════════════════════════════════════════════════════════════════════
🔹 STOP LOSS OPTIONS
🛑 Percentage: Fixed percentage from entry price
🛑 ATR-Based: Dynamic SL based on market volatility
🛑 Fixed Points: Set number of points/pips
🛑 Swing Low/High: Uses recent swing levels as stops
══════════════════════════════════════════════════════════════════════════
🔹 TAKE PROFIT OPTIONS
🎯 Percentage: Fixed percentage target
🎯 ATR-Based: Dynamic TP based on volatility
🎯 Fixed Points: Set number of points/pips
🎯 Risk Reward: Automatic TP based on R:R ratio (e.g., 2:1, 3:1)
══════════════════════════════════════════════════════════════════════════
🔹 TRAILING STOP
📈 Percentage-Based: Trail by a fixed percentage
📈 ATR-Based: Trail using ATR multiplier for dynamic adjustment
══════════════════════════════════════════════════════════════════════════
🔹 SETTINGS
MACD Parameters:
- Fast Length (default: 12)
- Slow Length (default: 26)
- Signal Length (default: 9)
- Trend Smoothing (default: 5)
Risk Management:
- Enable/Disable Stop Loss
- Enable/Disable Take Profit
- Enable/Disable Trailing Stop
- Customize all SL/TP parameters
Visual Options:
- Show/Hide Buy/Sell Triangles
- Show/Hide SL/TP Lines
- Show/Hide Labels
Time Filter:
- Set Start Date for backtest
- Set End Date for backtest
══════════════════════════════════════════════════════════════════════════
🔹 SIGNALS EXPLAINED
🟢 GREEN TRIANGLE (Below Bar):
Bullish zone detected - Consider LONG entry
🔴 RED TRIANGLE (Above Bar):
Bearish zone detected - Consider SHORT entry
🟢 GREEN BACKGROUND:
Currently in bullish trend zone
🔴 RED BACKGROUND:
Currently in bearish trend zone
══════════════════════════════════════════════════════════════════════════
🔹 INFO PANEL
The real-time info panel (top right) displays:
- Current Trend Zone status
- MACD value
- Signal Line value
- Active SL Type
- Active TP Type
══════════════════════════════════════════════════════════════════════════
🔹 ALERTS
Set up alerts for:
🔔 Buy Signals: "🐎 Mustang Algo: BUY Signal on {ticker} at {price}"
🔔 Sell Signals: "🐎 Mustang Algo: SELL Signal on {ticker} at {price}"
══════════════════════════════════════════════════════════════════════════
🔹 BEST PRACTICES
1. Use higher timeframes (1H, 4H, Daily) for more reliable signals
2. Combine with price action and support/resistance levels
3. Adjust ATR multipliers based on asset volatility
4. Use Risk Reward ratio for consistent risk management
5. Backtest on your preferred asset before live trading
══════════════════════════════════════════════════════════════════════════
🔹 RECOMMENDED TIMEFRAMES
⏱️ Scalping: 5M, 15M (more signals, more noise)
⏱️ Day Trading: 1H, 4H (balanced signals)
⏱️ Swing Trading: Daily, Weekly (fewer but stronger signals)
══════════════════════════════════════════════════════════════════════════
🔹 MARKETS
Works on all markets:
📈 Forex
📈 Crypto
📈 Stocks
📈 Indices
📈 Commodities
📈 Futures
══════════════════════════════════════════════════════════════════════════
🐎 RIDE THE TREND WITH MUSTANG ALGO!
══════════════════════════════════════════════════════════════════════════
⚠️ DISCLAIMER
This indicator/strategy is for educational and informational purposes only. It is not financial advice. Trading involves substantial risk of loss and is not suitable for all investors. Past performance is not indicative of future results. Always use proper risk management, do your own research, and consider consulting a financial advisor before making any trading decisions. Use at your own risk.
══════════════════════════════════════════════════════════════════════════
📝 VERSION HISTORY
v1.0 - Initial Release
- MACD-based trend detection
- Visual trend zones
- Multiple SL/TP options
- Full backtesting support
- Trailing stop functionality
- Time filter
- Info panel
- Alert system
══════════════════════════════════════════════════════════════════════════
💬 FEEDBACK
If you find this strategy useful, please leave a comment or suggestion!
Your feedback helps improve future updates.
🐎 Happy Trading!

AUTOMATIC GRID BOT STRATEGY [ilovealgotrading]
OVERVIEW:
This Grid trading strategy can help you maximize your profit in a ranging sideways market with no clear direction.
INDICATOR:
We can get some money by taking advantage of the movement of the price between the range we have determined.
Short positions are opened while the price is rising, long positions are opened while the price is falling.
Therefore, there is no need to predict the trend direction.
What is different in this indicator:
I want to say thank you to © thequantscience. His GRID SPOT TRADING ALGORITHM - GRID BOT TRADING strategy helped me when I was writing my indicator.
I want to explain what I have improved:
1- Grid strategy is a type of strategy that can be traded in very short time frames and users can trade this strategy algorithmically by connecting this strategy to their own accounts with the help of API systems. For this reason, I have developed a software that can give us signals by dynamically changing the long and short messages when users are trading.
2- We can change the start and end dates of our grid bot as we want. It is necessary to use this setting when setting up automatic bots, so that previously opened transactions are not taken into account.
3 - Lot or quantity size should not be excessively small when users are taking automatic trades because exchanges have limitations, to avoid this problem, I have prevented this error by automatically rounding up to the nearest quantity size inside the software.
4 - Users can avoid excessive losses by using stop loss on this grid bot if they wish.
5 - When our price is over the range high or below the range low, our open positions are closed, if the stop button is active. We can also change which close price time frame we take as a basis from the settings.
6 -Users can set how many dollars they can enter per transaction while performing their transactions automatically.
IMPLEMENTATION DETAILS – SETTINGS:
This script allows the user to choose the highs and lows leves of our range. Our bot trades in the specified range.
1. This strategy allows us to set start and end backtest dates.
2. We can change range high and range low leves of our bot
3. IF people want to trade algorithmically with the help of this bot, there are 6 different input systems that will receive the Json codes as an alarm
4. IF the price closes above the upper line or below the lower line, all transactions will be closed. We can determine in which time frame our transactions will be stopped if the price closes outside these levels.We can adjust how our bot works by activating or turning off the Stop Loss button.
5. In this strategy, you can determine your dollar cost for per position.
6. The user can also divide the interval we have determined into 10 parts or 20 equal parts.
7. The grid is divided and colored at the interval we set. At the same time, if we don't want we can turn off colored channels.
Notes:
If you're going to connect this bot to an automatic Long and Short direction,
Don’t forget! you need to Webhook URL,
Don’t miss paste this code to your message window {{strategy.order.alert_message}}
ALSO:
Set your range below the support zones and above the resistance zones.
Don't be afraid to take a wide range, it doesn't matter if you make a little money, the important thing is that you don't lose money.
If you have any ideas what to add to my work to add more sources or make calculations cooler, suggest in DM .

BTC and ETH Long strategy - version 1I will start with a small introduction about myself. I'm now trading cryto currencies manually for almost 2 years. I decided to start after watching a documentary on the TV showing people who made big money during the Bitcoin pump which happened at the end of 2017.
The next day, I asked myself "Why should I not give it a try and learn how to trade".
This was in February 2018 and the price of Bitcoin was around 11500USD.
I didn't know how to trade. In fact, I didn't know the trading industry at all.
So, my first step into trading was to open an account with a broken. Then I directly bought 200$ worst of BTC . At that time, I saw the graph and thought "This can only go back in the upward direction!" :)
I didn't know anything about Stop loss, Take profit and Risk management.
Today, almost 2 years after, I think that I know how to trade and can also confirm that I still hold this bag of 200$ of bitcoin from 2018 :)
I did spend the 2 last years to learn technical analysis , risk management and leverage trading.
Today (14/05/2020), I know what I'm doing and I'm happy to see that the 2 last years have been positive in terms of gains. Of course, I did not make crazy money with my saving but at least I made more than if I would have kept it in my bank account.
Even if I like trading, I have a full time job which requires my full energy and lots of focus, so, the biggest problem I had is that I didn't have enough time to look at the charts.
Also, I realized that sometimes, neither technical analysis , nor fundamentals worked with crypto currency (at least for short time trading). So, as I have a developer background I decided to try to have a look at algo trading.
The goal for me was neither to make complex algos nor to beat the market but just to automate my trading with simple bot catching the big waves.
I then started to take a look at TV pine script and played with it.
I did my first LONG script in February 2020 to Long the BTC Market. It has some limitations but works well enough for me for the time being. Even if the real trades will bring me half of what the back testing shows, this will still be a lot more than what I was used to win during the last 2 years with my manual trading.
So, here we are! Below you will find some details about my first LONG script. I'm happy to share it with you.
Feel free to play with it, give your comments and bring improvements to it.
But please note that it only works fine with the candle size and crypto pair that I have mentioned below. If you use other settings this algo might loose money!
- Crypto pairs : XBTUSD and ETHXBT
- Candle size: 2 Hours
- Indicator used: Volatility , MACD (12, 26, 7), SMA (100), SMA (200), EMA (20)
- Default StopLoss: -1.5%
- Entry in position if: Volatility < 2%
AND MACD moving up
AND AME (20) moving up
AND SMA (100) moving up
AND SMA (200) moving up
AND EMA (20) > SAM (100)
AND SMA (100) > SMA (200)
- Exit the postion if: Stoploss is reached
OR EMA (20) crossUnder SMA (100)
Here is a summary of the results for this script:
XBTUSD : 01/01/2019 --> 14/05/2020 = +107%
ETHXBT : 01/01/2019 --> 14/05/2020 = +39%
ETHUSD : 01/01/2019 --> 14/05/2020 = +112%
It is far away from being perfect. There are still plenty of things which can be done to improve it but I just wanted to share it :) .
Enjoy playing with it....

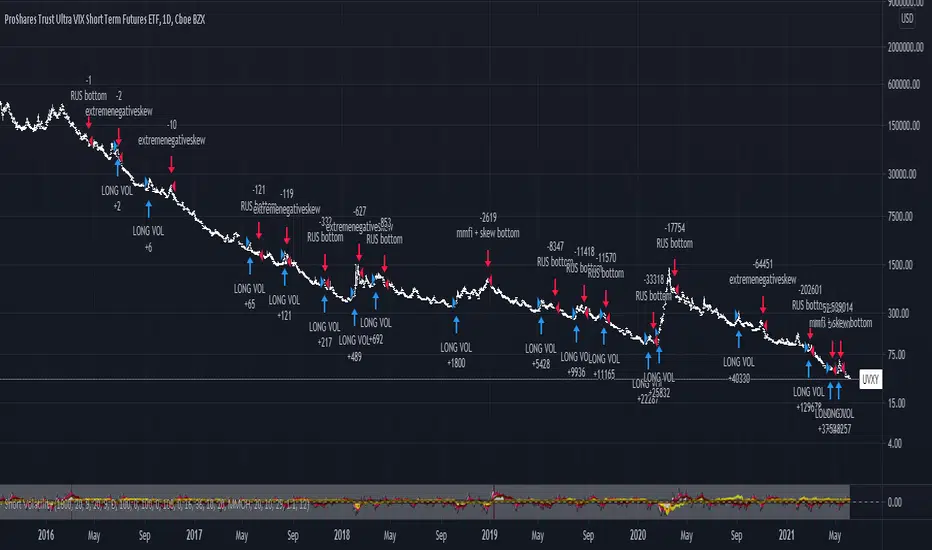
Long/Short Volatility AlgoA modification of my leveraged ETF algorithm. Giving out for free because it's a sloppy algorithm, and I personally use a much more refined algorithm developed by someone much smarter than me.
Hulk Grid Algorithm V2 - The Quant ScienceIt's the latest proprietary grid algorithm developed by our team. This software represents a clearer and more comprehensive modernization of the deprecated Hulk Grid Algorithm. In this new release, we have optimized the source code architecture and investment logic, which we will describe in detail below.
Overview
Hulk Grid Algorithm V2 is designed to optimize returns in sideways market conditions. In this scenario, the algorithm divides purchases with long orders at each level of the grid. Unlike a typical grid algorithm, this version applies an anti-martingale model to mitigate volatility and optimize the average entry price. Starting from the lower level, the purchase quantity is increased at each new subsequent level until reaching the upper level. The initial quantity of the first order is fixed at 0.50% of the initial capital. With each new order, the initial quantity is multiplied by a value equal to the current grid level (where 1 is the lower level and 10 is the upper level).
Example: Let's say we have an initial capital of $10,000. The initial capital for the first order would be $50 * 1 = $50, for the second order $50 * 2 = $100, for the third order $50 * 3 = $150, and so on until reaching the upper level.
All previously opened orders are closed using a percentage-based stop-loss and take-profit, calculated based on the extremes of the grid.
Set Up
As mentioned earlier, the user's goal is to analyze this strategy in markets with a lack of trend, also known as sideways markets. After identifying a price range within which the asset tends to move, the user can choose to create the grid by placing the starting price at the center of the range. This way, they can consider trading the asset, if the backtesting generates a return greater than the Buy & Hold return.
Grid Configuration
To create the grid, it's sufficient to choose the starting price during the launch phase. This level will be the center of the grid from which the upper and lower levels will be calculated. The grid levels are computed using an arithmetic method, adding and subtracting a configurable fixed amount from the user interface (Grid Step $).
Example: Let's imagine choosing 1000 as the starting price and 50 as the Grid Step ($). The upper levels will be 1000, 1050, 1100, 1150, 1200. The lower levels will be 950, 900, 850, 800, and 750.
Markets
This software can be used in all markets: stocks, indices, commodities, cryptocurrencies, ETFs, Forex, etc.
Application
With this backtesting software, is possible to analyze the strategy and search for markets where it can generate better performance than Buy & Hold returns. There are no alerts or automatic investment mechanisms, and currently, the strategy can only be executed manually.
Design
Is possible to modify the grid style and customize colors by accessing the Properties section of the user interface.

Grid Spot Trading Algorithm V2 - The Quant ScienceGrid Spot Trading Algorithm V2 is the last grid trading algorithm made by our developer team.
Grid Spot Trading Algorithm V2 is a fixed 10-level grid trading algorithm. The grid is divided into an accumulation area (red) and a selling area (green).
In the accumulation area, the algorithm will place new buy orders, selling the long positions on the top of the grid.
BUYING AND SELLING LOGIC
The algorithm places up to 5 limit orders on the accumulation section of the grid, each time the price cross through the middle grid. Each single order uses 20% of the equity.
Positions are closed at the top of the grid by default, with the algorithm closing all orders at the first sell level. The exit level can be adjusted using the user interface, from the first level up to the fifth level above.
CONFIGURING THE ALGORITHM
1) Add it to the chart: Add the script to the current chart that you want to analyze.
2) Select the top of the grid: Confirm a price level with the mouse on which to fix the top of the grid.
3) Select the bottom of the grid: Confirm a price level with the mouse on which to fix the bottom of the grid.
4) Wait for the automatic creation of the grid.
USING THE ALGORITHM
Once the grid configuration process is completed, the algorithm will generate automatic backtesting.
You can add a stop loss that destroys the grid by setting the destruction price and activating the feature from the user interface. When the stop loss is activated, you can view it on the chart.

Ichimoku Cloud Strategy Long Only [Bitduke]Slightly modificated and optimized for Pine Script 4.0, Ichimoku Cloud Strategy which, suddenly, good suitable for the several crypto assets.
Details:
Enter position when conversion line crosses base line up, and close it when the opposite happens.
Additional condition for open / close the trade is lagging span, it should be higher than cloud to open position and below - to close it.
Backtesting:
Backtested on SOLUSDT ( FTX, Binance )
+150% for 2021 year, 8% dd
+191% for all time, 32% dd
Disadvantages:
- Small number of trades
- Need to vary parameters for different coins (not very robust)
Should be tested carefully for other coins / stock market. Different parameters could be needed or even algo modifications.
Strategy doesn't repaint.

Risk Reward Calculator [lovealgotrading]
OVERVIEW:
This Risk Reward Calculator strategy can help you maximize your RR value with help of algorithmic trading.
INDICATOR:
I wanted to setup my trades more easier with this indicator, I didn't want to calculate everytime before orders, with help this indicator we can calculate R:R value, avarage price, stoploss price, take-profit price, order prices, all position cost and more ...
Our strategy is a risk revard calculation indicator that is made easy to use by using visualized lines and panels, and also has algorithmic trading support.
With the help of this indicator, we can quickly and easily calculate our risk reward values and enter the positions.
If we want to ensure that our balance grows regularly while trading in the stock market, we need to manage the risks and rewards otherwise we may fall below our initial balance at the end of the day, even if we seem to be winning.
What is the Risk-Reward value ?
This value is a value that shows how many times the amount of risk we take when entering the position is successful, we will earn.
- For example, you risked $100 while entering the trade, so if your trade stops, you will lose 100 $.
Your Risk-Reward(RR) value is 2 means that if your position is successful, you will have 200 $ in your pocket.
A trader's success is determined by the amount of R he earns monthly or yearly, not how much money he makes.
What is different in this indicator ?
I want to say thank you to © EvoCrypto. His Calculator (weighted) – evo indicator helped me when I was developed my indicator.
I want to explain what I have improved:
1-In this strategy, we can determine the time period in which we want to open our positions.
2-We can open a maximum of 4 positions in the same direction and close our positions at a single level. StopLoss or TakeProfit
3-This indicator, which works in the form of a strategy, shows where our positions have been opened or closed. With the help of this, it helps us to determine our strategy in our future positions more accurately.
4-The most important improvement is that we do not miss our positions with the help of alarms (WEB HOOK). if we want, we receive by quickly connecting all these positions to our robot, the software can enter and exit the position while we are busy.
IMPLEMENTATION DETAILS – SETTINGS:
1 - We can set the start and end dates of the positions we will take.
2- We can set our take profit, stoploss levels.
3- If your trade is stopped, we can determine the amount of the trade that we will lose.
4- We can adjust our entry levels to positions and our position sizes at entry levels.
(Sum of positions weight must be 100%)
5- We can receive our positions even if we are busy with the help of algorithmic trading. For this, we must paste our Jshon codes into the fields specified in the settings panel.
6- Finally, we can change the settings we want and don't want to have in our visual elements.
Let's make a LONG side example together
We have determined our positions to enter stoploss, take profit and long positions. We did not forget to set the start time of our strategy
Our strategy appear on the graph as follows.
Our strategy has calculated the total position size, our R-R value, the distance of the current price to the stop and take profit levels, in short, a lot of things we could look visually.
Notes:
If you're going to connect this bot to an automatic Long or Short direction,
Don’t forget! you need to Webhook URL,
Don’t miss paste this code to your message window {{strategy.order.alert_message}}
ALSO:
If you have any ideas what to add to my work to add more sources or make calculations cooler, feel free to write me.

iMoku (Ichimoku Complete Tool) - The Quant Science iMoku™ is a professional all-in-one solution for the famous Ichimoku Kinko Hyo indicator.
The algorithm includes:
1. Backtesting spot
2. Visual tool
3. Auto-trading functions
With iMoku you can test four different strategies.
Strategy 1: Cross Tenkan Sen - Kijun Sen
A long position is opened with 100% of the invested capital ($1000) when "Tenkan Sen" crossover "Kijun Sen".
Closing the long position on the opposite condition.
There are 3 different strength signals for this strategy: weak, normal, strong.
Weak : the signal is weak when the condition is true and the price is above the 'Kumo'
Normal : the signal is normal when the condition is true and the price is within the 'Kumo'
Strong : the signal is strong when the condition is true and the price is below the 'Kumo'
Strategy 2: Cross Price - Kijun Sen
A long position is opened with 100% of the invested capital ($1000) when the price crossover the 'Kijun Sen'.
Closing the long position on the opposite condition.
There are 3 different strength signals for this strategy: weak, normal, strong.
Weak : the signal is weak when the condition is true and the price is above the 'Kumo'
Normal : the signal is normal when the condition is true and the price is inside the 'Kumo'
Strong : the signal is strong when the condition is true and the price is below the 'Kumo'
Strategy 3: Kumo Breakout
A long position is opened with 100% of the invested capital ($1000) when the price breakup the 'Kumo'.
Closing the long position with a percentage stop loss and take profit on the invested capital.
Strategy 4: Kumo Twist
A long position is opened with 100% of the invested capital ($1000) when the 'Kumo' goes from negative to positive (called "Twist").
Closing the long position on the opposite condition.
There are 2 different strength signals for this strategy: weak, and strong.
Weak : the signal is weak when the condition is true and the price is above the 'Kumo'
Strong : the signal is strong when the condition is true and the price is below the 'Kumo'
This script is compliant with algorithmic trading.
You can use this script with trading terminals such as 3Commas or CryptoHopper. Connecting this script is very easy.
1. Enter the user interface
2. Select and activate a strategy
3. Copy your bot's links into the dedicated fields
4. Create and activate alert
Disclaimer: algorithmic trading involves risk, the user should consider aspects such as slippage, liquidity and costs when evaluating an asset. The Quant Science is not responsible for any kind of damage resulting from use of this script. By using this script you take all the responsibilities and risks.

Mutanabby_AI | Algo Pro Strategy# Mutanabby_AI | Algo Pro Strategy: Advanced Candlestick Pattern Trading System
## Strategy Overview
The Mutanabby_AI Algo Pro Strategy represents a systematic approach to automated trading based on advanced candlestick pattern recognition and multi-layered technical filtering. This strategy transforms traditional engulfing pattern analysis into a comprehensive trading system with sophisticated risk management and flexible position sizing capabilities.
The strategy operates on a long-only basis, entering positions when bullish engulfing patterns meet specific technical criteria and exiting when bearish engulfing patterns indicate potential trend reversals. The system incorporates multiple confirmation layers to enhance signal reliability while providing comprehensive customization options for different trading approaches and risk management preferences.
## Core Algorithm Architecture
The strategy foundation relies on bullish and bearish engulfing candlestick pattern recognition enhanced through technical analysis filtering mechanisms. Entry signals require simultaneous satisfaction of four distinct criteria: confirmed bullish engulfing pattern formation, candle stability analysis indicating decisive price action, RSI momentum confirmation below specified thresholds, and price decline verification over adjustable lookback periods.
The candle stability index measures the ratio between candlestick body size and total range including wicks, ensuring only well-formed patterns with clear directional conviction generate trading signals. This filtering mechanism eliminates indecisive market conditions where pattern reliability diminishes significantly.
RSI integration provides momentum confirmation by requiring oversold conditions before entry signal generation, ensuring alignment between pattern formation and underlying momentum characteristics. The RSI threshold remains fully adjustable to accommodate different market conditions and volatility environments.
Price decline verification examines whether current prices have decreased over a specified period, confirming that bullish engulfing patterns occur after meaningful downward movement rather than during sideways consolidation phases. This requirement enhances the probability of successful reversal pattern completion.
## Advanced Position Management System
The strategy incorporates dual position sizing methodologies to accommodate different account sizes and risk management approaches. Percentage-based position sizing calculates trade quantities as equity percentages, enabling consistent risk exposure across varying account balances and market conditions. This approach proves particularly valuable for systematic trading approaches and portfolio management applications.
Fixed quantity sizing provides precise control over trade sizes independent of account equity fluctuations, offering predictable position management for specific trading strategies or when implementing precise risk allocation models. The system enables seamless switching between sizing methods through simple configuration adjustments.
Position quantity calculations integrate seamlessly with TradingView's strategy testing framework, ensuring accurate backtesting results and realistic performance evaluation across different market conditions and time periods. The implementation maintains consistency between historical testing and live trading applications.
## Comprehensive Risk Management Framework
The strategy features dual stop loss methodologies addressing different risk management philosophies and market analysis approaches. Entry price-based stop losses calculate stop levels as fixed percentages below entry prices, providing predictable risk exposure and consistent risk-reward ratio maintenance across all trades.
The percentage-based stop loss system enables precise risk control by limiting maximum loss per trade to predetermined levels regardless of market volatility or entry timing. This approach proves essential for systematic trading strategies requiring consistent risk parameters and capital preservation during adverse market conditions.
Lowest low-based stop losses identify recent price support levels by analyzing minimum prices over adjustable lookback periods, placing stops below these technical levels with additional buffer percentages. This methodology aligns stop placement with market structure rather than arbitrary percentage calculations, potentially improving stop loss effectiveness during normal market fluctuations.
The lookback period adjustment enables optimization for different timeframes and market characteristics, with shorter periods providing tighter stops for active trading and longer periods offering broader stops suitable for position trading approaches. Buffer percentage additions ensure stops remain below obvious support levels where other market participants might place similar orders.
## Visual Customization and Interface Design
The strategy provides comprehensive visual customization through eight predefined color schemes designed for different chart backgrounds and personal preferences. Color scheme options include Classic bright green and red combinations, Ocean themes featuring blue and orange contrasts, Sunset combinations using gold and crimson, and Neon schemes providing high visibility through bright color selections.
Professional color schemes such as Forest, Royal, and Fire themes offer sophisticated alternatives suitable for business presentations and professional trading environments. The Custom color scheme enables precise color selection through individual color picker controls, maintaining maximum flexibility for specific visual requirements.
Label styling options accommodate different chart analysis preferences through text bubble, triangle, and arrow display formats. Size adjustments range from tiny through huge settings, ensuring appropriate visual scaling across different screen resolutions and chart configurations. Text color customization maintains readability across various chart themes and background selections.
## Signal Quality Enhancement Features
The strategy incorporates signal filtering mechanisms designed to eliminate repetitive signal generation during choppy market conditions. The disable repeating signals option prevents consecutive identical signals until opposing conditions occur, reducing overtrading during consolidation phases and improving overall signal quality.
Signal confirmation requirements ensure all technical criteria align before trade execution, reducing false signal occurrence while maintaining reasonable trading frequency for active strategies. The multi-layered approach balances signal quality against opportunity frequency through adjustable parameter optimization.
Entry and exit visualization provides clear trade identification through customizable labels positioned at relevant price levels. Stop loss visualization displays active risk levels through colored line plots, ensuring complete transparency regarding current risk management parameters during live trading operations.
## Implementation Guidelines and Optimization
The strategy performs effectively across multiple timeframes with optimal results typically occurring on intermediate timeframes ranging from fifteen minutes through four hours. Higher timeframes provide more reliable pattern formation and reduced false signal occurrence, while lower timeframes increase trading frequency at the expense of some signal reliability.
Parameter optimization should focus on RSI threshold adjustments based on market volatility characteristics and candlestick pattern timeframe analysis. Higher RSI thresholds generate fewer but potentially higher quality signals, while lower thresholds increase signal frequency with corresponding reliability considerations.
Stop loss method selection depends on trading style preferences and market analysis philosophy. Entry price-based stops suit systematic approaches requiring consistent risk parameters, while lowest low-based stops align with technical analysis methodologies emphasizing market structure recognition.
## Performance Considerations and Risk Disclosure
The strategy operates exclusively on long positions, making it unsuitable for bear market conditions or extended downtrend periods. Users should consider market environment analysis and broader trend assessment before implementing the strategy during adverse market conditions.
Candlestick pattern reliability varies significantly across different market conditions, with higher reliability typically occurring during trending markets compared to ranging or volatile conditions. Strategy performance may deteriorate during periods of reduced pattern effectiveness or increased market noise.
Risk management through stop loss implementation remains essential for capital preservation during adverse market movements. The strategy does not guarantee profitable outcomes and requires proper position sizing and risk management to prevent significant capital loss during unfavorable trading periods.
## Technical Specifications
The strategy utilizes standard TradingView Pine Script functions ensuring compatibility across all supported instruments and timeframes. Default configuration employs 14-period RSI calculations, adjustable candle stability thresholds, and customizable price decline verification periods optimized for general market conditions.
Initial capital settings default to $10,000 with percentage-based equity allocation, though users can adjust these parameters based on account size and risk tolerance requirements. The strategy maintains detailed trade logs and performance metrics through TradingView's integrated backtesting framework.
Alert integration enables real-time notification of entry and exit signals, stop loss executions, and other significant trading events. The comprehensive alert system supports automated trading applications and manual trade management approaches through detailed signal information provision.
## Conclusion
The Mutanabby_AI Algo Pro Strategy provides a systematic framework for candlestick pattern trading with comprehensive risk management and position sizing flexibility. The strategy's strength lies in its multi-layered confirmation approach and sophisticated customization options, enabling adaptation to various trading styles and market conditions.
Successful implementation requires understanding of candlestick pattern analysis principles and appropriate parameter optimization for specific market characteristics. The strategy serves traders seeking automated execution of proven technical analysis techniques while maintaining comprehensive control over risk management and position sizing methodologies.

Trendline Breaks with Multi Fibonacci Supertrend StrategyTMFS Strategy: Advanced Trendline Breakouts with Multi-Fibonacci Supertrend
Elevate your algorithmic trading with institutional-grade signal confluence
Strategy Genesis & Evolution
This advanced trading system represents the culmination of a personal research journey, evolving from my custom " Multi Fibonacci Supertrend with Signals " indicator into a comprehensive trading strategy. Built upon the exceptional trendline detection methodology pioneered by LuxAlgo in their " Trendlines with Breaks " indicator, I've engineered a systematic framework that integrates multiple technical factors into a cohesive trading system.
Core Fibonacci Principles
At the heart of this strategy lies the Fibonacci sequence application to volatility measurement:
// Fibonacci-based factors for multiple Supertrend calculations
factor1 = input.float(0.618, 'Factor 1 (Weak/Fibonacci)', minval = 0.01, step = 0.01)
factor2 = input.float(1.618, 'Factor 2 (Medium/Golden Ratio)', minval = 0.01, step = 0.01)
factor3 = input.float(2.618, 'Factor 3 (Strong/Extended Fib)', minval = 0.01, step = 0.01)
These precise Fibonacci ratios create a dynamic volatility envelope that adapts to changing market conditions while maintaining mathematical harmony with natural price movements.
Dynamic Trendline Detection
The strategy incorporates LuxAlgo's pioneering approach to trendline detection:
// Pivotal swing detection (inspired by LuxAlgo)
pivot_high = ta.pivothigh(swing_length, swing_length)
pivot_low = ta.pivotlow(swing_length, swing_length)
// Dynamic slope calculation using ATR
slope = atr_value / swing_length * atr_multiplier
// Update trendlines based on pivot detection
if bool(pivot_high)
upper_slope := slope
upper_trendline := pivot_high
else
upper_trendline := nz(upper_trendline) - nz(upper_slope)
This adaptive trendline approach automatically identifies key structural market boundaries, adjusting in real-time to evolving chart patterns.
Breakout State Management
The strategy implements sophisticated state tracking for breakout detection:
// Track breakouts with state variables
var int upper_breakout_state = 0
var int lower_breakout_state = 0
// Update breakout state when price crosses trendlines
upper_breakout_state := bool(pivot_high) ? 0 : close > upper_trendline ? 1 : upper_breakout_state
lower_breakout_state := bool(pivot_low) ? 0 : close < lower_trendline ? 1 : lower_breakout_state
// Detect new breakouts (state transitions)
bool new_upper_breakout = upper_breakout_state > upper_breakout_state
bool new_lower_breakout = lower_breakout_state > lower_breakout_state
This state-based approach enables precise identification of the exact moment when price breaks through a significant trendline.
Multi-Factor Signal Confluence
Entry signals require confirmation from multiple technical factors:
// Define entry conditions with multi-factor confluence
long_entry_condition = enable_long_positions and
upper_breakout_state > upper_breakout_state and // New trendline breakout
di_plus > di_minus and // Bullish DMI confirmation
close > smoothed_trend // Price above Supertrend envelope
// Execute trades only with full confirmation
if long_entry_condition
strategy.entry('L', strategy.long, comment = "LONG")
This strict requirement for confluence significantly reduces false signals and improves the quality of trade entries.
Advanced Risk Management
The strategy includes sophisticated risk controls with multiple methodologies:
// Calculate stop loss based on selected method
get_long_stop_loss_price(base_price) =>
switch stop_loss_method
'PERC' => base_price * (1 - long_stop_loss_percent)
'ATR' => base_price - long_stop_loss_atr_multiplier * entry_atr
'RR' => base_price - (get_long_take_profit_price() - base_price) / long_risk_reward_ratio
=> na
// Implement trailing functionality
strategy.exit(
id = 'Long Take Profit / Stop Loss',
from_entry = 'L',
qty_percent = take_profit_quantity_percent,
limit = trailing_take_profit_enabled ? na : long_take_profit_price,
stop = long_stop_loss_price,
trail_price = trailing_take_profit_enabled ? long_take_profit_price : na,
trail_offset = trailing_take_profit_enabled ? long_trailing_tp_step_ticks : na,
comment = "TP/SL Triggered"
)
This flexible approach adapts to varying market conditions while providing comprehensive downside protection.
Performance Characteristics
Rigorous backtesting demonstrates exceptional capital appreciation potential with impressive risk-adjusted metrics:
Remarkable total return profile (1,517%+)
Strong Sortino ratio (3.691) indicating superior downside risk control
Profit factor of 1.924 across all trades (2.153 for long positions)
Win rate exceeding 35% with balanced distribution across varied market conditions
Institutional Considerations
The strategy architecture addresses execution complexities faced by institutional participants with temporal filtering and date-range capabilities:
// Time Filter settings with flexible timezone support
import jason5480/time_filters/5 as time_filter
src_timezone = input.string(defval = 'Exchange', title = 'Source Timezone')
dst_timezone = input.string(defval = 'Exchange', title = 'Destination Timezone')
// Date range filtering for precise execution windows
use_from_date = input.bool(defval = true, title = 'Enable Start Date')
from_date = input.time(defval = timestamp('01 Jan 2022 00:00'), title = 'Start Date')
// Validate trading permission based on temporal constraints
date_filter_approved = time_filter.is_in_date_range(
use_from_date, from_date, use_to_date, to_date, src_timezone, dst_timezone
)
These capabilities enable precise execution timing and market session optimization critical for larger market participants.
Acknowledgments
Special thanks to LuxAlgo for the pioneering work on trendline detection and breakout identification that inspired elements of this strategy. Their innovative approach to technical analysis provided a valuable foundation upon which I could build my Fibonacci-based methodology.
This strategy is shared under the same Attribution-NonCommercial-ShareAlike 4.0 International (CC BY-NC-SA 4.0) license as LuxAlgo's original work.
Past performance is not indicative of future results. Conduct thorough analysis before implementing any algorithmic strategy.

Pivot Reversal Strategy + alerts via TradingConnector to indicesSoftware part of algotrading is simpler than you think. TradingView is a great place to do this actually. To present it, I'm publishing each of the default strategies you can find in Pinescript editor's "built-in" list with slight modification - I'm only adding 2 lines of code, which will trigger alerts, ready to be forwarded to your broker via TradingConnector and instantly executed there. Alerts added in this script: 14 and 22.
How it works:
1. TradingView alert fires.
2. TradingConnector catches it and forwards to MetaTrader4/5 you got from your broker.
3. Trade gets executed inside MetaTrader within 1 second of fired alert.
When configuring alert, make sure to select "alert() function calls only" in CreateAlert popup. One alert per ticker is required.
Adding stop-loss, take-profit, trailing-stop, break-even or executing pending orders is also possible. These topics have been covered in other example posts.
This routing works for Forex, indices, stocks, crypto - anything your broker offers via their MetaTrader4 or 5.
Disclaimer: This concept is presented for educational purposes only. Profitable results of trading this strategy are not guaranteed even if the backtest suggests so. By no means this post can be considered a trading advice. You trade at your own risk.
If you are thinking to execute this particular strategy, make sure to find the instrument, settings and timeframe which you like most. You can do this by your own research only.

RSI Strategy with alerts via TradingConnector to ForexSoftware part of algotrading is simpler than you think. TradingView is a great place to do this actually. To present it, I'm publishing each of the default strategies you can find in Pinescript editor's "built-in" list with slight modification - I'm only adding 2 lines of code, which will trigger alerts, ready to be forwarded to your broker via TradingConnector and instantly executed there. Alerts added in this script: 12 and 17.
How it works:
1. TradingView alert fires.
2. TradingConnector catches it and forwards to MetaTrader4/5 you got from your broker.
3. Trade gets executed inside MetaTrader within 1 second of fired alert.
When configuring alert, make sure to select "alert() function calls only" in CreateAlert popup. One alert per ticker is required.
Adding stop-loss, take-profit, trailing-stop, break-even or executing pending orders is also possible. These topics have been covered in other example posts.
This routing works for Forex, indices, stocks, crypto - anything your broker offers via their MetaTrader4 or 5.
Disclaimer: This concept is presented for educational purposes only. Profitable results of trading this strategy are not guaranteed even if the backtest suggests so. By no means this post can be considered a trading advice. You trade at your own risk.
If you are thinking to execute this particular strategy, make sure to find the instrument, settings and timeframe which you like most. You can do this by your own research only.

[New series!] [Consistent Losing Strategies] 34 EMA Scalping//---------------------------INTRO------------------------------
Hi All!
Let me introduce myself as a semi-successful forex trader & lover of automation.
I've taken to algo trading and have been hunting down strategies (that usually use indicators) to automate, backtest, and hopefully implement in MT4.
Unfortunately, most strategies are complete bulls*** and the select cases that are shown to "prove" success are limited.
These strategy sources often do not provide useful analytics either.
I want to change that approach to trading! We can really benefit each other and the community by being methodical about backtesting
as well as evaluating our results with some kind of scoring heuristic.
As for what that standardized process looks like..well I'm still working on it.
I'm pretty much on Tv for multiple hours of the day, screening strategies via Pinescript and I'd like to start sharing my progress!
This is a new series I'd like to start on consistently losing strategies. I'll make all the code public, so if you think I've made a blunder
or approached a problem the wrong way, then drop me a DM or paste your fix into the comments.
//---------------------------STRAT------------------------------
34 EMA Scalping strategy (ref. forextradingstrategies4u )
How you're supposed to trade it:
BUY:
1. Market is in an down trend as shown by the 34 EMA
2. Price breaks above a downwards trend line
3. Price breaks above the 34 EMA
4. Look for a very bullish candlestick or chart pattern
SELL:
1. Look for the 34 EMA to show we are in an uptrend
2. Price breaks below an upwards sloping trend line
3. Price breaks below 34 EMA
4. Look for a bearish candlestick or a chart pattern
//---------------------------CONC------------------------------
Q: Why does it fail?
A: I believe this strategy relies too much on subjective input (aka, trendlines).
Q: Why does it fail as an algo?
A: The 34 EMA is no more predictive than any other EMA, although it does a good job at filtering out noise.
Q: Should I try it out?
A: No, it's trash. This is the proof that it is trash.

Safe Supertrend Strategy (No Repaint)Overview
The Safe Supertrend is a repaint-free version of the popular Supertrend trend-following indicator.
Most Supertrend indicators appear perfect on historical charts because they flip intrabar and then repaint after the candle closes.
This version fixes that by using close-of-bar confirmation only, making every trend flip 100% stable, safe, and non-repainting.
Why This Supertrend Doesn’t Repaint
Most Supertrend indicators calculate their trend direction using the current bar’s data.
But during a live candle:
ATR expands and contracts
The upper/lower bands move
Price moves above/below the band temporarily
A false flip appears → then disappears when the candle closes
That is classic repainting.
This indicator avoids all of that by using:
close > upper
close < lower
This means:
Trend direction flips only based on the previous candle,
No intrabar calculations,
No flickering signals,
No “perfect but fake” historical performance.
Every signal you see on the chart is exactly what was available in real-time.
How It Works
Calculates ATR (Average True Range) and SMA centerline
Builds upper and lower volatility bands
Confirms trend flips only after the previous bar closes
Plots clear bull and bear reversal signals
Works on all markets (crypto, stocks, forex, indices)
No repainting, no recalc, no misleading flips.
Bullish Signal (Trend Up)
A bullish trend begins only when:
The previous candle closes above the upper ATR band,
And this flip is fully confirmed.
A green triangle marks the start of a new uptrend.
Bearish Signal (Trend Down)
A bearish trend begins only when:
The previous candle closes below the lower ATR band,
And the downtrend is confirmed.
A red triangle signals the start of a new downtrend.
Inputs
ATR Length - default 10
ATR Multiplier - default 3.0
Works on all timeframes and market
Simple, but powerful.
Why Use This Version Instead of a Regular Supertrend?
Most Supertrends:
Look great historically
But repaint continuously on live charts
Give false trend flips intrabar
Cannot be reliably used in strategies
This version:
Uses strict previous-bar logic
Never repaints trend direction
Works perfectly in live trading
Backtests accurately
Is ideal for algorithmic strategies
Ideal For:
Trend-following strategies
Breakout trading
Algo trading systems
Reversal detection
Filtering market noise
Swing trading & scalping
Final Note
This is a safer, more reliable Supertrend designed for real-world use — not perfect-looking repaint illusions.
If you use Supertrend in your trading system, this no-repaint version ensures your signals are trustworthy and consistent.
