Trend Signals with TP & SL [UAlgo]The "Trend Signals with TP & SL " indicator is a versatile tool designed to assist traders in identifying potential trend continuation opportunities within financial markets Utilizing a combination of technical indicators and user-defined parameters, this indicator aims to provide clear and actionable signals to aid traders in making informed trading decisions.
🔶 Features:
Trend Continuation Signals : The indicator generates signals to identify potential trend continuation points based on the input parameters such as sensitivity, ATR length, and cloud moving average length.
Take-Profit and Stop-Loss Levels: It calculates and plots three levels of take-profit (1R, 2R, 3R) and stop-loss levels based on the entry price of the trade.
Short Position Example:
Long Position Example:
Visualization: The script visualizes the trend signals, entry points, take-profit levels, and stop-loss levels on the price chart, making it easier for traders to interpret the signals.
Alert System: The indicator includes an alert system that notifies the user when there is a change in trend direction or when a buy/sell signal is generated. The alerts provide essential information such as entry price, take-profit levels, and stop-loss levels.
🔶 Calculations :
Trend Calculation: Trend signals are determined based on the comparison between the current closing price and the upper and lower bounds calculated using the Average True Range (ATR) multiplied by a sensitivity factor. A trend is considered bullish if the closing price is above the upper bound and bearish if it's below the lower bound.
Entry, Stop Loss, and Take Profit Calculation: Entry points for long and short positions are identified when there's a change in trend direction.
Stop-loss levels are calculated as a percentage of the entry price, where users can define the percentage based on their risk tolerance.
Take-profit levels are calculated as multiples of the stop-loss level (1R, 2R, 3R).
Cloud Moving Averages: Simple moving averages (SMAs) are calculated for high and low prices over a specified period to create a "cloud" visualization on the chart.
MACD Clouds: Moving Average Convergence Divergence (MACD) indicator is used to determine the market's momentum and trend direction. Positive and negative clouds are plotted based on the MACD line and its signal line, indicating potential bullish or bearish trends.
Signal Generation: Buy and sell signals are generated based on specific conditions such as RSI, CMO (Chande Momentum Oscillator), and pivot points.
Signals are triggered when certain criteria are met, indicating potential opportunities for entering or exiting trades.
🔶 Disclaimer:
Use at Your Own Risk: Trading involves significant risk, and this script is provided for educational and informational purposes only. It does not guarantee profitable trades, and users should exercise caution and perform their own analysis before making trading decisions.
Parameter Sensitivity: The effectiveness of the indicator may vary depending on the chosen parameters, market conditions, and timeframe. Users are encouraged to backtest the script thoroughly and adjust the parameters according to their trading preferences.
Not Financial Advice: The information provided by this script should not be considered as financial advice. Users are solely responsible for their trading decisions and should consult with a qualified financial advisor if needed.
Backtesting and Validation: Before implementing this indicator in live trading, users are strongly encouraged to conduct rigorous backtesting and validation to assess its performance under various market conditions. Past performance is not indicative of future results, and users should carefully evaluate the effectiveness of the indicator based on their individual trading preferences and risk tolerance.
Search in scripts for "averages"

Supertrended RSI [AlgoAlpha]🚀📈 Introducing the Supertrended RSI Indicator by AlgoAlpha!
Designed to empower your trading decisions, this innovative Pine Script™ creation marries the precision of the Relative Strength Index (RSI) with the dynamic prowess of the SuperTrend methodology. Whether you’re charting the course of cryptos, riding the waves of stock markets, or navigating the futures landscape, our SuperTrended RSI Indicator is your go-to tool for uncovering unique trend insights and crafting trading strategies. 🌟
Key Features:
🔍 Enhanced RSI Analysis: Combines the traditional RSI with a supertrend calculation for a dynamic look at market trends.
🔄 Multiple Moving Averages: Offers a selection of moving averages including SMA, HMA, EMA, and more for tailored analysis.
🎨 Customizable Visuals: Choose your own color scheme for uptrends and downtrends to match your trading dashboard.
📊 Flexible Input Settings: Tailor the indicator with customizable lengths, factors, and smoothing options.
⚡ Real-Time Alerts: Set alerts for bullish and bearish reversals to stay ahead of market movements.
Quick Guide to Using the Supertrended RSI Indicator
Maximize your trading with the Supertrended RSI by following these streamlined steps! 🚀✨
🛠 Add the Indicator: Search for "Supertrended RSI " in TradingView's Indicators & Strategies. Customize settings like RSI length, MA type, and Supertrend factors to fit your trading style.
🎨 Visual Customization: Adjust uptrend and downtrend colors for clear trend visualization.
📊 Market Analysis: Watch for the Supertrend color change for trend reversals. Use the 70 and 30 lines to spot overbought/oversold conditions.
🔔 Alerts: Enable notifications for reversal conditions to capture trading opportunities without constant chart monitoring.
How It Works:
At the core of this indicator is the combination of the Relative Strength Index (RSI) and the Supertrend framework, it does so by applying the SuperTrend on the RSI. The RSI settings can be adjusted for length and smoothing, with the option to select the data source. The Supertrend calculation takes into account a specified trend factor and the Average True Range (ATR) over a given period to determine trend direction.
Visual elements include plotting the RSI, its moving average, and the Supertrend line, with customizable colors for clarity. Overbought and oversold conditions are highlighted, and trend changes are filled with distinct colors.
🔔 Alerts: Enable alerts for crossover and crossunder events to catch every trading opportunity.
🌈 Whether you're a seasoned trader or just starting, the Supertrended RSI offers a fresh perspective on market trends. 📈
💡 Tip: Experiment with different settings to find the perfect balance for your trading style!
🔗 Explore, customize, and enhance your trading experience with the Supertrended RSI Indicator! Happy trading! 🎉

MA+ ProjectionThe "MA+ Projection" indicator is designed to visualize the potential future direction of a moving average, taking into account the impact of historical data loss. It is primarily aimed at providing a practical perspective on how moving averages could evolve as older data points are no longer considered.
Key Features:
Supported Moving Averages: SMA, EMA, WMA, VWMA, and VAWMA (Volume Adjusted WMA).
Flexible Time Span Settings: Customize the moving average length in bars, minutes, or days.
Adjustable Projection Scope: Set a percentage of the measurement to project forward.
Projection 'Cone': Show/hide the deviation and control the multiple.
Use Last Source Value: An option to add the latest known value to the moving window instead of only letting the window shrink. (Enabled by default.)
How It Works:
Given the specified parameters, it takes the selected moving average type (a known formula like SMA, EMA, or WMA), and projects the future data points by continuing to move the data 'window' forward without adding any more data. By default, it extends the average by assuming the price hasn't changed after the last bar. Alternatively, the projection can be the result of shrinking the window as it moves forward without adding any new data points.
Note:
This tool is for visual projection, not prediction. Its purpose is to aid in the analysis of potential future trends based on historical data, not to provide definitive market forecasts.

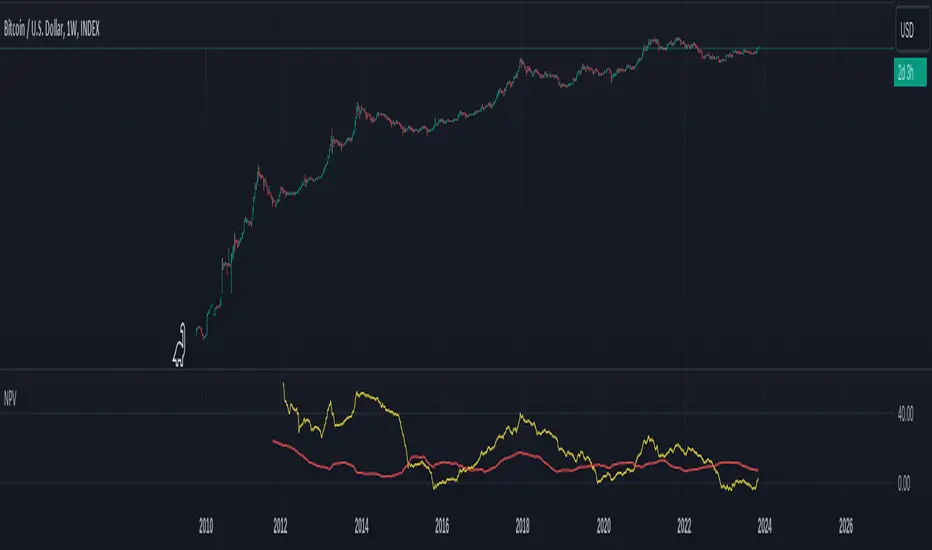
Normalized Price VolumeThe Normalized Price Volume (NPV) indicator is a unique tool designed to offer insights into the relationship between price movements and trading volume. By normalizing these factors, NPV helps traders identify potential price trends and reversals with greater precision.
Key Features:
Normalization: NPV leverages the Average True Range (ATR) to normalize price changes, making them comparable across different assets and timeframes.
Price and Volume Ratios: The indicator calculates the ratio of normalized price changes and volume to provide valuable information about the dynamics between price and trading activity.
Sum of Changes: NPV also presents the sum of normalized price changes over a user-defined period, allowing you to gauge the overall trend strength.
Customizable Averages: Adjust the length of the moving averages used in the price and volume ratios to fine-tune the sensitivity of the indicator to your trading strategy.
NPV is a versatile tool that can be used for various trading and investment approaches. Whether you're a day trader, swing trader, or investor, NPV can help you make more informed decisions by shedding light on the interactions between price and volume in the market.
Disclaimer: This indicator is for educational and informational purposes only. It should be used in conjunction with other analysis techniques and not solely for making trading decisions.
SML SuiteIntroducing the "SML Suite" Indicator
The "SML Suite" is a powerful and easy-to-use trading indicator designed to help traders make informed decisions in the world of financial markets. Whether you're a seasoned trader or a novice, this indicator is your trusty sidekick for evaluating market trends.
Key Features:
Three Moving Averages: The indicator employs three different moving averages, each with a distinct length, allowing you to adapt to various market conditions.
Customizable Parameters: You can easily customize the moving average lengths and source data to tailor the indicator to your specific trading strategy.
Standard Deviation Multiplier: Adjust the standard deviation multiplier to fine-tune the indicator's sensitivity to market fluctuations.
Binary Results: The indicator provides clear binary signals (1 or -1) based on whether the current price is above or below certain bands. This simplifies your decision-making process.
SML Calculation: The SML (Short, Medium, Long) calculation is a smart combination of the binary results, offering you an overall sentiment about the market.
Color-Coded Visualization: Visualize market sentiment with color-coded bars, making it easy to spot trends at a glance.
Interactive Table: A table is displayed on your chart, giving you a quick overview of the binary results and the overall SML sentiment.
With the "SML Suite" indicator, you don't need to be a coding expert to harness the power of technical analysis. Stay ahead of the game and enhance your trading strategy with this user-friendly tool. Make your trading decisions with confidence and clarity, backed by the insights provided by the "SML Suite" indicator.

Volume and Price Z-Score [Multi-Asset] - By LeviathanThis script offers in-depth Z-Score analytics on price and volume for 200 symbols. Utilizing visualizations such as scatter plots, histograms, and heatmaps, it enables traders to uncover potential trade opportunities, discern market dynamics, pinpoint outliers, delve into the relationship between price and volume, and much more.
A Z-Score is a statistical measurement indicating the number of standard deviations a data point deviates from the dataset's mean. Essentially, it provides insight into a value's relative position within a group of values (mean).
- A Z-Score of zero means the data point is exactly at the mean.
- A positive Z-Score indicates the data point is above the mean.
- A negative Z-Score indicates the data point is below the mean.
For instance, a Z-Score of 1 indicates that the data point is 1 standard deviation above the mean, while a Z-Score of -1 indicates that the data point is 1 standard deviation below the mean. In simple terms, the more extreme the Z-Score of a data point, the more “unusual” it is within a larger context.
If data is normally distributed, the following properties can be observed:
- About 68% of the data will lie within ±1 standard deviation (z-score between -1 and 1).
- About 95% will lie within ±2 standard deviations (z-score between -2 and 2).
- About 99.7% will lie within ±3 standard deviations (z-score between -3 and 3).
Datasets like price and volume (in this context) are most often not normally distributed. While the interpretation in terms of percentage of data lying within certain ranges of z-scores (like the ones mentioned above) won't hold, the z-score can still be a useful measure of how "unusual" a data point is relative to the mean.
The aim of this indicator is to offer a unique way of screening the market for trading opportunities by conveniently visualizing where current volume and price activity stands in relation to the average. It also offers features to observe the convergent/divergent relationships between asset’s price movement and volume, observe a single symbol’s activity compared to the wider market activity and much more.
Here is an overview of a few important settings.
Z-SCORE TYPE
◽️ Z-Score Type: Current Z-Score
Calculates the z-score by comparing current bar’s price and volume data to the mean (moving average with any custom length, default is 20 bars). This indicates how much the current bar’s price and volume data deviates from the average over the specified period. A positive z-score suggests that the current bar's price or volume is above the mean of the last 20 bars (or the custom length set by the user), while a negative z-score means it's below that mean.
Example: Consider an asset whose current price and volume both show deviations from their 20-bar averages. If the price's Z-Score is +1.5 and the volume's Z-Score is +2.0, it means the asset's price is 1.5 standard deviations above its average, and its trading volume is 2 standard deviations above its average. This might suggest a significant upward move with strong trading activity.
◽️ Z-Score Type: Average Z-Score
Calculates the custom-length average of symbol's z-score. Think of it as a smoothed version of the Current Z-Score. Instead of just looking at the z-score calculated on the latest bar, it considers the average behavior over the last few bars. By doing this, it helps reduce sudden jumps and gives a clearer, steadier view of the market.
Example: Instead of a single bar, imagine the average price and volume of an asset over the last 5 bars. If the price's 5-bar average Z-Score is +1.0 and the volume's is +1.5, it tells us that, over these recent bars, both the price and volume have been consistently above their longer-term averages, indicating sustained increase.
◽️ Z-Score Type: Relative Z-Score
Calculates a relative z-score by comparing symbol’s current bar z-score to the mean (average z-score of all symbols in the group). This is essentially a z-score of a z-score, and it helps in understanding how a particular symbol's activity stands out not just in its own historical context, but also in relation to the broader set of symbols being analyzed. In other words, while the primary z-score tells you how unusual a bar's activity is for that specific symbol, the relative z-score informs you how that "unusualness" ranks when compared to the entire group's deviations. This can be particularly useful in identifying symbols that are outliers even among outliers, indicating exceptionally unique behaviors or opportunities.
Example: If one asset's price Z-Score is +2.5 and volume Z-Score is +3.0, but the group's average Z-Scores are +0.5 for price and +1.0 for volume, this asset’s Relative Z-Score would be high and therefore stand out. This means that asset's price and volume activities are notably high, not just by its own standards, but also when compared to other symbols in the group.
DISPLAY TYPE
◽️ Display Type: Scatter Plot
The Scatter Plot is a visual tool designed to represent values for two variables, in this case the Z-Scores of price and volume for multiple symbols. Each symbol has it's own dot with x and y coordinates:
X-Axis: Represents the Z-Score of price. A symbol further to the right indicates a higher positive deviation in its price from its average, while a symbol to the left indicates a negative deviation.
Y-Axis: Represents the Z-Score of volume. A symbol positioned higher up on the plot suggests a higher positive deviation in its trading volume from its average, while one lower down indicates a negative deviation.
Here are some guideline insights of plot positioning:
- Top-Right Quadrant (High Volume-High Price): Symbols in this quadrant indicate a scenario where both the trading volume and price are higher than their respective mean.
- Top-Left Quadrant (High Volume-Low Price): Symbols here reflect high trading volumes but prices lower than the mean.
- Bottom-Left Quadrant (Low Volume-Low Price): Assets in this quadrant have both low trading volume and price compared to their mean.
- Bottom-Right Quadrant (Low Volume-High Price): Symbols positioned here have prices that are higher than their mean, but the trading volume is low compared to the mean.
The plot also integrates a set of concentric squares which serve as visual guides:
- 1st Square (1SD): Encapsulates symbols that have Z-Scores within ±1 standard deviation for both price and volume. Symbols within this square are typically considered to be displaying normal behavior or within expected range.
- 2nd Square (2SD): Encapsulates those with Z-Scores within ±2 standard deviations. Symbols within this boundary, but outside the 1 SD square, indicate a moderate deviation from the norm.
- 3rd Square (3SD): Represents symbols with Z-Scores within ±3 standard deviations. Any symbol outside this square is deemed to be a significant outlier, exhibiting extreme behavior in terms of either its price, its volume, or both.
By assessing the position of symbols relative to these squares, traders can swiftly identify which assets are behaving typically and which are showing unusual activity. This visualization simplifies the process of spotting potential outliers or unique trading opportunities within the market. The farther a symbol is from the center, the more it deviates from its typical behavior.
◽️ Display Type: Columns
In this visualization, z-scores are represented using columns, where each symbol is presented horizontally. Each symbol has two distinct nodes:
- Left Node: Represents the z-score of volume.
- Right Node: Represents the z-score of price.
The height of these nodes can vary along the y-axis between -4 and 4, based on the z-score value:
- Large Positive Columns: Signify a high or positive z-score, indicating that the price or volume is significantly above its average.
- Large Negative Columns: Represent a low or negative z-score, suggesting that the price or volume is considerably below its average.
- Short Columns Near 0: Indicate that the price or volume is close to its mean, showcasing minimal deviation.
This columnar representation provides a clear, intuitive view of how each symbol's price and volume deviate from their respective averages.
◽️ Display Type: Circles
In this visualization style, z-scores are depicted using circles. Each symbol is horizontally aligned and represented by:
- Solid Circle: Represents the z-score of price.
- Transparent Circle: Represents the z-score of volume.
The vertical position of these circles on the y-axis ranges between -4 and 4, reflecting the z-score value:
- Circles Near the Top: Indicate a high or positive z-score, suggesting the price or volume is well above its average.
- Circles Near the Bottom: Represent a low or negative z-score, pointing to the price or volume being notably below its average.
- Circles Around the Midline (0): Highlight that the price or volume is close to its mean, with minimal deviation.
◽️ Display Type: Delta Columns
There's also an option to utilize Z-Score Delta Columns. For each symbol, a single column is presented, depicting the difference between the z-score of price and the z-score of volume.
The z-score delta essentially captures the disparity between how much the price and volume deviate from their respective mean:
- Positive Delta: Indicates that the z-score of price is greater than the z-score of volume. This suggests that the price has deviated more from its average than the volume has from its own average. Such a scenario could point to price movements being more significant or pronounced compared to the changes in volume.
- Negative Delta: Represents that the z-score of volume is higher than the z-score of price. This might mean that there are substantial volume changes, yet the price hasn't moved as dramatically. This can be indicative of potential build-up in trading interest without an equivalent impact on price.
- Delta Close to 0: Means that the z-scores for price and volume are almost equal, indicating their deviations from the average are in sync.
◽️ Display Type: Z-Volume/Z-Price Heatmap
This visualization offers a heatmap either for volume z-scores or price z-scores across all symbols. Here's how it's presented:
Each symbol is allocated its own horizontal row. Within this row, bar-by-bar data is displayed using a color gradient to represent the z-score values. The heatmap employs a user-defined gradient scale, where a chosen "cold" color represents low z-scores and a chosen "hot" color signifies high z-scores. As the z-score increases or decreases, the colors transition smoothly along this gradient, providing an intuitive visual indication of the z-score's magnitude.
- Cold Colors: Indicate values significantly below the mean (negative z-score)
- Mild Colors: Represent values close to the mean, suggesting minimal deviation.
- Hot Colors: Indicate values significantly above the mean (positive z-score)
This heatmap format provides a rapid, visually impactful means to discern how each symbol's price or volume is behaving relative to its average. The color-coded rows allow you to quickly spot outliers.
VOLUME TYPE
The "Volume Type" input allows you to choose the nature of volume data that will be factored into the volume z-score calculation. The interpretation of indicator’s data changes based on this input. You can opt between:
- Volume (Regular Volume): This is the classic measure of trading volume, which represents the volume traded in a given time period - bar.
- OBV (On-Balance Volume): OBV is a momentum indicator that accumulates volume on up bars and subtracts it on down bars, making it a cumulative indicator that sort of measures buying and selling pressure.
Interpretation Implications:
- For Volume Type: Regular Volume:
Positive Z-Score: Indicates that the trading volume is above its average, meaning there's unusually high trading activity .
Negative Z-Score: Suggests that the trading volume is below its average, signifying unusually low trading activity.
- For Volume Type: OBV:
Positive Z-Score: Signifies that “buying pressure” is above its average.
Negative Z-Score: Signifies that “selling pressure” is above its average.
When comparing Z-Score of OBV to Z-Score of price, we can observe several scenarios. If Z-Price and Z-Volume are convergent (have similar z-scores), we can say that the directional price movement is supported by volume. If Z-Price and Z-Volume are divergent (have very different z-scores or one of them being zero), it suggests a potential misalignment between price movement and volume support, which might hint at possible reversals or weakness.

Blockchain FundamentalThis indicator is made for traders to harness fundamental blockchain data for better decision-making. Unlike traditional tools, this indicator doesn't depend on standard technical indicators. It offers a novel perspective by focusing on core blockchain metrics like capitalization, miner activity, and other intrinsic data elements. I've designed a distinct scoring logic, exclusive to BF, ensuring it's user-friendly and provides actionable insights for traders at all levels.
Mainly created for Bitcoin , but can be applied to any other crypto assets in cost of losing some metrics in the analysis.
Ethereum chart:
Features:
Customizable Moving Averages:
Choose from an array of moving averages, with the flexibility to adjust the length for a tailored analysis, aiding in pinpointing asset trends.
Blockchain Metrics Integration:
Incorporates a range of blockchain metrics such as Market Cap to Realised Cap ratio, Spent Output Profit Ratio, ATH Drawdown, and more.
Blockchain Metrics Evaluation:
Each metric can be toggled on/off to customize the analysis. Using default settings, traders can use all of the metrics combined.
Every metric is essentially evaluated on a scale from -100 to 100 and then combined with others. If any metric is uncertain about its direction (equals to 0), then the score of it is not accounted in a final calculation.
Kalman Filter:
This indicator offers the option to apply a Kalman filter to the signals, enhancing the smoothness and accuracy of the indicator’s output. This is my approach to mitigate the noise in the final output.
Signal Oscillator:
Displays the aggregated score of all selected blockchain metrics.
Offers visual signals with adjustable upper and lower bounds for easy interpretation based on particular asset observation.
Visual Elements:
Signal Oscillator:
A visual representation of the aggregated blockchain fundamental score.
(White line for a raw calculation, orange line for kalman-filtered one)
Signal Counter:
Displays the count of metrics currently being considered in the fundamental score calculation. (grey line at the middle of an indicator)
Buy/Sell Signal Coloring:
The background color changes to indicate potential buying or selling opportunities based on user-defined bounds.
Usage:
Analysis:
Use the signal oscillator to identify potential market tops and bottoms based on blockchain fundamental data.
Adjust the bounds to customize the sensitivity of buy/sell signals.
Customization:
Enable/disable specific blockchain metrics to tailor the indicator to your analytical needs.
Adjust the moving average type and length for better analysis.
Integration:
Combine with other technical indicators to create a comprehensive trading strategy.
Utilize in conjunction with volume and price action analysis for enhanced decision-making. Every output could be used in traders custom strategies and indicators.

MA Directional Table"MA Directional Table" primary objective is to analyze the direction of the trend based on two Moving Averages (MA) for various timeframes and customizing the inputs to match your preferred style.
Features:
Moving Average Type: You can select which type of Moving Average to use (SMA, EMA, VWMA).
Moving Average Lengths: You can set the lengths for the short-term and long-term moving averages.
Table Position: The indicator provides a table which can be placed at the top or bottom, and to the left or right of the chart. It shows the trend status for multiple timeframes (1 min, 5 min, 15 min, 1 hour, 4 hours, 1 day).
Table Orientation: The table can be oriented either horizontally or vertically.
Price Condition: Optionally, the table color can be set to yellow if the current price deviates from the Moving Average trend and crosses MA1.
Cloud Settings: You can opt to show a cloud between the two moving averages. The color of the cloud changes based on the direction of the trend (bullish or bearish).
Extra MA: Optionally, an extra Moving Average can be plotted on the chart.

Adjustable Bull Bear Candle Indicator (V1.2)Indicator Description: Adjustable Bull Bear Candle Indicator
This indicator, named "Adjustable Bull Bear Candle Indicator ," is designed to assist traders in identifying potential bullish and bearish signals within price charts. It combines candlestick pattern analysis, moving average crossovers, and RSI (Relative Strength Index) conditions to offer insights into potential trading opportunities.
Disclaimer:
Trading involves substantial risk and is not suitable for every investor. This indicator is a tool designed to aid in technical analysis, but it does not guarantee successful trades. Always exercise your own judgment and seek professional advice before making any trading decisions.
Key Features:
Preceding Candles Analysis:
The indicator examines the behavior of the previous 'n' candles to identify specific patterns that indicate bearish or bullish momentum.
Candlestick Pattern and Momentum:
It considers the relationship between the opening and closing prices of the current candle to determine if it's bullish or bearish. The indicator then assesses the absolute price difference and compares it to the cumulative absolute differences of preceding candles.
Moving Averages:
The indicator calculates two Simple Moving Averages (SMAs) – Close SMA and Far SMA – to help identify trends and crossovers in price movement.
Relative Strength Index (RSI):
RSI is used as an additional measure to gauge momentum. It analyzes the current price's magnitude of recent gains and losses and compares it to past data.
Time Constraint:
If enabled, the indicator operates within a specific time window defined by the user. This feature can help traders focus on specific market hours.
Customizable Alerts:
The indicator includes an alert system that can be enabled or disabled. You can also adjust the specific alert conditions to align with your trading strategy.
How to Use:
This indicator generates buy signals when specific conditions are met, including a bullish candlestick pattern, positive price difference, closing price above the SMAs, RSI above a threshold, preceding bearish candles, and optionally within a specified time window. Conversely, short signals are generated under conditions opposite to those of the buy signal.
Disclosure and Risk Warning:
Educational Tool: This indicator is meant for educational purposes and to aid traders in their technical analysis. It's not a trading strategy in itself.
Risk of Loss: Trading carries inherent risks, including the potential for substantial loss. Always manage risk and consider using proper risk management techniques.
Diversification: Do not rely solely on this indicator. A well-rounded trading approach includes fundamental analysis, risk management, and proper diversification.
Consultation: It's strongly advised to consult with a financial professional before making any trading decisions.
Conclusion:
The "Bullish Candle after Bearish Candles with Momentum Indicator" can be a valuable tool in your technical analysis toolkit. However, successful trading requires a deep understanding of market dynamics, risk management, and continual learning. Use this indicator in conjunction with other tools and strategies to enhance your trading decisions.
Remember that past performance is not indicative of future results. Always be cautious and informed when participating in the financial markets.

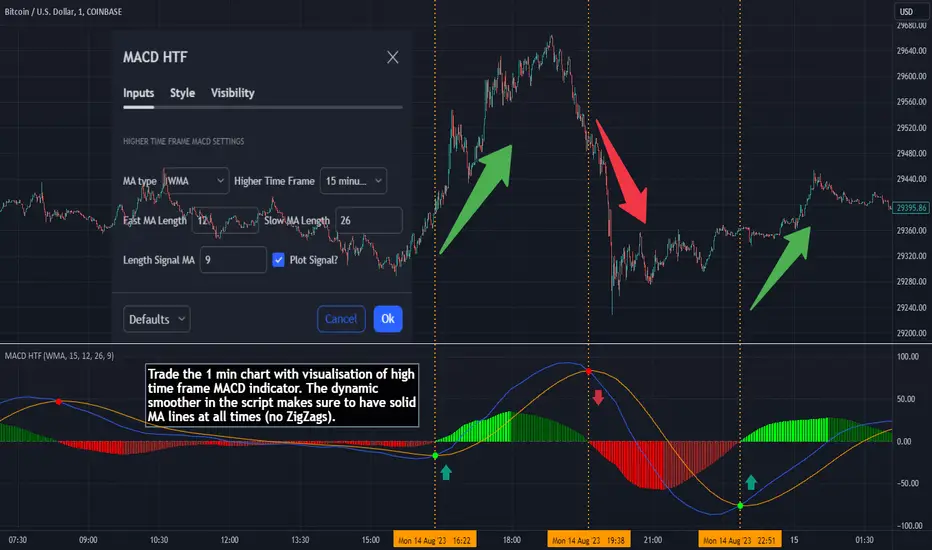
MACD HTF - Dynamic SmoothingEnhancing Your 1-Minute Trades with Dynamic HTF MACD Smoothing
Ever found yourself glued to a 1-minute chart, trying to catch every minor price movement, yet feeling like you're missing the bigger picture? Picture this: a solid MACD line on that chart, dynamically smoothed from a higher timeframe (HTF). This tool offers two significant benefits over other existing HTF MACD indicators:
User-Friendly Interface: No need to manually adjust input parameters every time you switch to a different timeframe.
Smooth Charting: Say goodbye to the zigzag lines that often result from plotting higher time frame resolutions on a lower time frame.
Understanding the MACD
The Moving Average Convergence Divergence (MACD) is one of the most widely used and trusted technical indicators in the trading community. Invented by Gerald Appel in the late 1970s, the MACD helps traders understand the relationship between two moving averages of a security's price. It consists of the MACD line (difference between a 12-period and 26-period Exponential Moving Average) and the Signal line (9-period EMA of the MACD line). When the MACD line crosses above the Signal line, it's viewed as a bullish signal, and vice versa. The difference between the two lines is represented as a histogram, providing insights into potential buy or sell opportunities.
Features of the Dynamic HTF MACD Smoothing Script
Time Frame Flexibility: Choose a higher timeframe to derive MACD values and apply dynamic smoothing to your current timeframe.
Multiple Moving Averages: The script supports various MA types like EMA, SMA, DEMA, TEMA, WMA and HMA.
Alerts: Get real-time alerts for MACD crossover and crossunder.
Customizability: From the type of moving average to its length, customize as per your strategy.
Visual Indicators: Clearly plots signals when MACD crossover or crossunder occurs for potential entries.
At last
A massive shoutout to all the wizards and generous contributors in the community! You inspire innovations and new tools, paving the path forward. Here's to a community where we learn and build together. Cheers to collective growth!
Major and Minor Trend Indicator by Nikhil34a V 2.2Title: Major and Minor Trend Indicator by Nikhil34a V 2.2
Description:
The Major and Minor Trend Indicator v2.2 is a comprehensive technical analysis script designed for use with the TradingView platform. This powerful tool is developed in Pine Script version 5 and helps traders identify potential buying and selling opportunities in the stock market.
Features:
SMA Trend Analysis: The script calculates two Simple Moving Averages (SMAs) with user-defined lengths for major and minor trends. It displays these SMAs on the chart, allowing traders to visualize the prevailing trends easily.
Surge Detection: The indicator can detect buying and selling surges based on specific conditions, such as volume, RSI, MACD, and stochastic indicators. Both Buying and Selling surges are marked in black on the chart.
Option Buy Zone Detection: The script identifies the option buy zone based on SMA crossovers, RSI, and MACD values. The buy zone is categorized as "CE Zone" or "PE Zone" and displayed in the table along with the trigger time.
Two-Day High and Low Range: The script calculates the highest high and lowest low of the previous two trading days and plots them on the chart. The area between these points is shaded in semi-transparent green and red colors.
Crossover Analysis: The script analyzes moving average crossovers on multiple timeframes (2-minute, 3-minute, and 5-minute) and displays buy and sell signals accordingly.
Trend Identification: The script identifies the major and minor trends as either bullish or bearish, providing valuable insights into the overall market sentiment.
Usage:
Customize Major and Minor SMA Periods: Adjust the lengths of major and minor SMAs through input parameters to suit your trading preferences.
Enable/Disable Moving Averages: Choose which SMAs to display on the chart by toggling the "showXMA" input options.
Set Surge and Option Buy Zone Thresholds: Modify the surgeThreshold, volumeThreshold, RSIThreshold, and StochThreshold inputs to refine the surge and buy zone detection.
Analyze Crossover Signals: Monitor the crossover signals in the table, categorized by timeframes (2-minute, 3-minute, and 5-minute).
Explore Market Bias and Distance to 2-Day High/Low: The table provides information on market bias, current price movement relative to the previous two-day high and low, and the option buy zone status.
Additional Use Cases:
Surge Indicator:
The script includes a Surge Indicator that detects sudden buying or selling surges in the market. When a buying surge is identified, the "BSurge" label will appear below the corresponding candle with black text on a white background. Similarly, a selling surge will display the "SSurge" label in white text on a black background. These indicators help traders quickly spot strong buying or selling activities that may influence their trading decisions. These surges can be used to identify sudden premium dump zones.
Option Buy Zone:
The Option Buy Zone is an essential feature that identifies potential zones for buying call options (CE Zone) or put options (PE Zone) based on specific technical conditions. The indicator evaluates SMA crossovers, RSI, and MACD values to determine the current market sentiment. When the option buy zone is triggered, the script will display the respective zone ("CE Zone" or "PE Zone") in the table, highlighted with a white background. Additionally, the time when the buy zone was triggered will be shown under the "Option Buy Zone Trigger Time" column.
Price Movement Relative to 2-Day High/Low:
The script calculates the highest high and lowest low of the previous two trading days (high2DaysAgo and low2DaysAgo) and plots these points on the chart. The area between these two points is shaded in semi-transparent green and red colors. The green region indicates the price range between the highpricetoconsider (highest high of the previous two days) and the lower value between highPreviousDay and high2DaysAgo. Similarly, the red region represents the price range between the lowpricetoconsider (lowest low of the previous two days) and the higher value between lowPreviousDay and low2DaysAgo.
Entry Time and Current Zone:
The script identifies potential entry times for trades within the option buy zone. When a valid buy zone trigger occurs, the script calculates the entryTime by adding the durationInMinutes (user-defined) to the startTime. The entryTime will be displayed in the "Entry Time" column of the table. Depending on the comparison between optionbuyzonetriggertime and entryTime, the background color of the entry time will change. If optionbuyzonetriggertime is greater than entryTime, the background color will be yellow, indicating that a new trigger has occurred before the specified duration. Otherwise, the background color will be green, suggesting that the entry time is still within the defined duration.
Current Zone Indicator:
The script further categorizes the current zone as either "CE Zone" (call option zone) or "PE Zone" (put option zone). When the market is trending upwards and the minor SMA is above the major SMA, the currentZone will be set to "CE Zone." Conversely, when the market is trending downwards and the minor SMA is below the major SMA, the currentZone will be "PE Zone." This information is displayed in the "Current Zone" column of the table.
These additional use cases empower traders with valuable insights into market trends, buying and selling surges, option buy zones, and potential entry times. Traders can combine this information with their analysis and risk management strategies to make informed and confident trading decisions.
Note:
The script is optimized for identifying trends and potential trade opportunities. It is crucial to perform additional analysis and risk management before executing any trades based on the provided signals.
Happy Trading!

Pseudo-Entropy Oscillator with Standard Deviation (modified)Intuition: The Pseudo-Entropy Oscillator with Standard Deviation (PEO_SD) was created to provide traders with a way to analyze market momentum and potential reversals. It combines the concepts of entropy, standard deviation, and moving averages to offer insights into market behavior.The oscillator's core idea is to measure the pseudo-entropy of the market using standard deviation. Pseudo-entropy refers to the degree of disorder or randomness in the price data. By calculating the standard deviation of the closing prices over a specified period, the oscillator quantifies the market's volatility.To enhance the usefulness of the pseudo-entropy measurement, the oscillator incorporates moving averages. The entropy delta is calculated by applying momentum analysis to the pseudo-entropy values. This helps identify short-term changes in the entropy, indicating shifts in market sentiment or momentum.The oscillator further smoothes the pseudo-entropy values by calculating the simple moving average (SMA) over a specified length. This helps filter out noise and provides a clearer representation of the market's overall momentum.
------------------------------------------------------------------------------------------------------------------------------------------------------------------------------------------------------------------------------------------------
The "Pseudo-Entropy Oscillator with Standard Deviation" (PEO_SD) is a custom indicator designed to help traders analyze market momentum and potential reversal points. It can be applied to various markets like stocks, commodities, forex, or cryptocurrencies. By using this indicator, you can gain insights into the market's behavior and make more informed trading decisions.
The PEO_SD indicator plots three lines on your chart: the fast pseudo-entropy line, the medium pseudo-entropy line, and the slow pseudo-entropy line. Each line represents the combined pseudo-entropy values, which are calculated using standard deviation and moving averages.
The lines are color-coded for easy identification. The fast line is represented by blue, the medium line by yellow, and the slow line by red. Additionally, three horizontal reference lines are plotted: the mid line (at 50), the lower bound (at 20), and the upper bound (at 80).
To use this indicator effectively, you can observe the interactions of the lines with the reference lines. For example, when any of the lines cross above the mid line, it might indicate a bullish signal, suggesting an upward price movement. Conversely, a crossover below the mid line could be a bearish signal, indicating a potential downward price movement. If the lines reach the upper bound, it might suggest that the market is overbought, and a reversal could be imminent. Conversely, reaching the lower bound may indicate that the market is oversold, possibly leading to a price reversal.
By applying the PEO_SD indicator and studying the lines' movements, you can gain valuable insights into market momentum, identify potential reversal points, and make more informed trading decisions.

Ratio To Average - The Quant ScienceRatio To Average - The Quant Science is a quantitative indicator that calculates the percentage ratio of the market price in relation to a reference average. The indicator allows the calculation of the ratio using four different types of averages: SMA, EMA, WMA, and HMA. The ratio is represented by a series of histograms that highlight periods when the ratio is positive (in green) and periods when the ratio is negative (in red).
What is the Ratio to Average?
The Ratio to Average is a measure that tracks the price movements with one of its averages, calculating how much the price is above or below its own average, in percentage terms.
USER INTERFACE
Lenght: it adjusts the number of bars to include in the calculation of the average.
Moving Average: it allows you to choose the type of average to use.
Color Up/Color Down : it allows you to choose the color of the indicator for positive and negative ratios.

Scalping Strategy (5min)This indicator is designed for scalping strategies on a 5-minute timeframe. It generates signals based on two RSI crossovers and incorporates moving averages to identify trends. Additionally, a Bollinger Band is included to eliminate the need for an additional Bollinger Band on the chart.
Please note that this indicator does not guarantee 100% accurate signals and may produce false signals. It is recommended to use this indicator in conjunction with other indicators such as Stochastic, MACD, SuperTrend, or any other suitable indicators to enhance the accuracy of trading decisions.
1) Signal Generation: The indicator generates buy and sell signals based on two RSI crossovers. A buy signal is generated when the fast RSI crosses above the slow RSI, indicating potential bullish momentum. Conversely, a sell signal is generated when the fast RSI crosses below the slow RSI, suggesting potential bearish momentum.
2) To adjust the indicator to your specific chart and trading preferences, you have the flexibility to modify the RSI and moving average (MA) values. By changing the RSI values (slow RSI length and fast RSI length), you can fine-tune the sensitivity of the RSI crossovers to suit different timeframes and market conditions. Similarly, adjusting the MA values (slow MA period and fast MA period) allows you to adapt the indicator to the desired trend identification and short-term trend confirmation.
3) Pay attention to trades that are confirmed by the short-term moving average (MA) aligning with the desired direction. For buy signals, ensure that the short MA is tending upward, indicating a potential uptrend. For sell signals, confirm that the short MA is trending downward, suggesting a potential downtrend.
4) Moving Averages: The indicator uses a 200-period moving average (MA) to identify the overall trend and a short-term MA for additional confirmation.
5) Bollinger Band: The included Bollinger Band is not directly used in the indicator's calculations. However, it is provided for convenience so that users don't need to add another Bollinger Band to their chart separately.
6) Exercise caution when the short MA is below the 200-period MA but showing signs of attempting an upward move. These situations may indicate a potential reversal or consolidation, and it is advisable to avoid taking trades solely based on the 200-period MA crossover in such cases.
Remember that these guidelines are intended to provide additional insights and should be used in combination with your trading judgment and analysis.

Multiple Moving Average ToolkitFeatures Overview:
Multiple Moving Averages: The script allows you to plot up to five different Moving Averages (MAs) on your chart at the same time. You can choose the type of MA (EMA, SMA, HMA, WMA, DEMA, VWMA, VWAP) and the length of each one.
Color Ribbon: You can turn the MAs into a color ribbon by selecting the "Turn into Color Ribbon?" option. This will make the area between the MAs colored and can help you identify trends more easily.
MA Value Table: You can draw a table on your chart that displays the current values of each MA, whether the trend is bullish or bearish along with the length of the MAs. The current ATR value is also shown in the last cell of the table. You can choose the location of the table (Top Left, Top Right, Bottom Left, Bottom Right) and the transparency of the background color.
Crosses: The script can detect when two MAs cross over each other (1st MA crosses 5th MA and vice versa), indicating a potential trend reversal. It will plot crosses on the chart at the point of the crossover and give an alert if the "Bullish Cross Detected" or "Bearish Cross Detected" condition is met.
How to use:
Once the script is added to your chart, you can customize the settings to fit your preferences. You can choose the type and length of each MA, whether to turn them into a color ribbon, whether to plot crosses, and whether to draw the MA Value Table.
The MA Value Table can be moved to a different location on the chart by selecting the "Location of Table" option and choosing Top Left, Top Right, Bottom Left, or Bottom Right.
Watch for MA crossovers and alerts to identify potential trend reversals. The script can help you identify bullish and bearish trends by color-coding the area between the MAs and displaying the current values of each MA in the table.
Breakdown of the script:
User Inputs
The first section of the script defines several user inputs that allows you to customize the indicator. These include options for turning the MAs into a color ribbon, plotting crosses when there is a bullish or bearish cross of the MAs, drawing a table of the MA values, and setting the transparency of the ribbon. You can also select the location of the MA value table and customize the settings for each individual MA.
Moving Average Calculation
The script defines a function called "getMA" that calculates the moving average for a given type and length. The function uses a switch statement to determine which type of moving average to use, such as an exponential moving average (EMA), simple moving average (SMA), Hull moving average (HMA), weighted moving average (WMA), double exponential moving average (DEMA), volume-weighted moving average (VWMA), or volume-weighted average price (VWAP).
The script then calls this function to calculate the values of up to five different MAs, depending on the user input. The ATR (average true range) is also calculated using the TA library.
Color Filter and Cross Detection
The script sets a color filter based on the relationship between the MAs. If the shorter-term MAs are above the longer-term MAs, the filter is set to green to indicate a bullish trend, and if the shorter-term MAs are below the longer-term MAs, the filter is set to red to indicate a bearish trend. You can adjust the transparency of the ribbon to make it more or less visible.
The script also detects when there is a bullish or bearish cross of the MAs and can generate alerts to notify you.
MA Plotting
The script plots up to five MAs on the chart, depending on the user input. The MAs are plotted as lines with different colors and thicknesses, and you can choose to turn them into a color ribbon if desired.
Cross Plotting
The script plots crosses on the chart when there is a bullish or bearish cross of the MAs. The crosses are plotted as X shapes at the location of the cross and are color-coded to indicate the direction of the cross.
MA Value Table
Finally, the script draws a table of the MA values on the chart, displaying the values of each MA as well as the current trend and the ATR. You can customize the location of the table, and the table is colored to match the color filter of the MAs.
Feel free to message me or comment on the post with any questions or issues!
Much more to come!
Thanks for reading, enjoy!

L_Trade_BoundariesLibrary "L_Trade_Boundaries"
Trade Boundaries suggest a strength of the security with respect to previous lows. The "L" implies library, and the trade boundaries implies it could be utilized for price strengths. Though, this should not be used as a single parameter to trade wildly. This library can be imported to a custom indicator to utilized the custom functions. There are moving averages attached at the bottom right of the canvas (overlay) to benchmark the closing price with respect to Moving Averages: 20, 28, and 200 (i.e., "D" if timeframe == "D") respectively. The Volume Indicator located at the top of the canvas is a default function (function already made by the trading view) this shows the volume with respect to the selected time frame. All of the indicators tell a story with regard to the security price (in strength terms).
What is available in this Library?
Litmus Color
> This is a function will change color of two numbers, if the first number is less than the second, the color will be red; otherwise, the color will be green.
Lister
> This is simply using an array by revisiting previous lows and plotting to the current time frame (i.e., "D"). There is a custom frequency input for the function, it will go back as much as the implied/specified length. Note: I am still learning how to use array, use this function with discretion. I would also appreciate if there are suggestions commented below.
Moving Average
> This function invokes three moving average metrics: 20, 28, and 200 respectively. The values are displayed at the bottom right of the canvas.
Timeframe Highlight
> This function checks for the input timeframe (i.e., "D", "W", "M") and if the time frame happens to be the same, it will give a "true" result. This result can be utilized for highlighting the positive results on the canvas (the red lines).
litmus_color(value1, value2)
Parameters:
value1
value2
lister(length)
Parameters:
length
moving_averages()
timeframe_highlight(timeframe)
Parameters:
timeframe

Oscillator Workbench — Chart [LucF]█ OVERVIEW
This indicator uses an on-chart visual framework to help traders with the interpretation of any oscillator's behavior. The advantage of using this tool is that you do not need to know all the ins and outs of a particular oscillator such as RSI, CCI, Stochastic, etc. Your choice of oscillator and settings in this indicator will change its visuals, which allows you to evaluate different configurations in the context of how the workbench models oscillator behavior. My hope is that by using the workbench, you may come up with an oscillator selection and settings that produce visual cues you find useful in your trading.
The workbench works on any symbol and timeframe. It uses the same presentation engine as my Delta Volume Channels indicator; those already familiar with it will feel right at home here.
█ CONCEPTS
Oscillators
An oscillator is any signal that moves up and down a centerline. The centerline value is often zero or 50. Because the range of oscillator values is different than that of the symbol prices we look at on our charts, it is usually impossible to display an oscillator on the chart, so we typically put oscillators in a separate pane where they live in their own space. Each oscillator has its own profile and properties that dictate its behavior and interpretation. Oscillators can be bounded , meaning their values oscillate between fixed values such as 0 to 100 or +1 to -1, or unbounded when their maximum and minimum values are undefined.
Oscillator weight
How do you display an oscillator's value on a chart showing prices when both values are not on the same scale? The method I use here converts the oscillator's value into a percentage that is used to weigh a reference line. The weight of the oscillator is calculated by maintaining its highest and lowest value above and below its centerline since the beginning of the chart's history. The oscillator's relative position in either of those spaces is then converted to a percentage, yielding a positive or negative value depending on whether the oscillator is above or below its centerline. This method works equally well with bounded and unbounded oscillators.
Oscillator Channel
The oscillator channel is the space between two moving averages: the reference line and a weighted version of that line. The reference line is a moving average of a type, source and length which you select. The weighted line uses the same settings, but it averages the oscillator-weighted price source.
The weight applied to the source of the reference line can also include the relative size of the bar's volume in relation to previous bars. The effect of this is that the oscillator's weight on bars with higher total volume will carry greater weight than those with lesser volume.
The oscillator channel can be in one of four states, each having its corresponding color:
• Bull (teal): The weighted line is above the reference line.
• Strong bull (lime): The bull condition is fulfilled and the bar's close is above the reference line and both the reference and the weighted lines are rising.
• Bear (maroon): The weighted line is below the reference line.
• Strong bear (pink): The bear condition is fulfilled and the bar's close is below the reference line and both the reference and the weighted lines are falling.
Divergences
In the context of this indicator, a divergence is any bar where the slope of the reference line does not match that of the weighted line. No directional bias is assigned to divergences when they occur. You can also choose to define divergences as differences in polarity between the oscillator's slope and the polarity of close-to-close values. This indicator's divergences are designed to identify transition levels. They have no polarity; their bullish/bearish bias is determined by the behavior of price relative to the divergence channel after the divergence channel is built.
Divergence Channel
The divergence channel is the space between two levels (by default, the bar's low and high ) saved when divergences occur. When price has breached a channel and a new divergence occurs, a new channel is created. Until that new channel is breached, bars where additional divergences occur will expand the channel's levels if the bar's price points are outside the channel.
Price breaches of the divergence channel will change its state. Divergence channels can be in one of five different states:
• Bull (teal): Price has breached the channel to the upside.
• Strong bull (lime): The bull condition is fulfilled and the oscillator channel is in the strong bull state.
• Bear (maroon): Price has breached the channel to the downside.
• Strong bear (pink): The bear condition is fulfilled and the oscillator channel is in the strong bear state.
• Neutral (gray): The channel has not been breached.
█ HOW TO USE THE INDICATOR
Load the indicator on an active chart (see here if you don't know how).
The default configuration displays:
• The Divergence channel's levels.
• Bar colors using the state of the oscillator channel.
The default settings use:
• RSI as the oscillator, using the close source and a length of 20 bars.
• An Arnaud-Legoux moving average on the close and a length of 20 bars as the reference line.
• The weighted version of the reference line uses only the oscillator's weight, i.e., without the relative volume's weight.
The weighted line is capped to three standard deviations of the reference.
• The divergence channel's levels are determined using the high and low of the bars where divergences occur.
Breaches of the channel require a bar's low to move above the top of the channel, and the bar's high to move below the channel's bottom.
No markers appear on the chart; if you want to create alerts from this script, you will need first to define the conditions that will trigger the markers, then create the alert, which will trigger on those same conditions.
To learn more about how to use this indicator, you must understand the concepts it uses and the information it displays, which requires reading this description. There are no videos to explain it.
█ FEATURES
The script's inputs are divided in five sections: "Oscillator", "Oscillator channel", "Divergence channel", "Bar Coloring" and "Marker/Alert Conditions".
Oscillator
This is where you configure the oscillator you want to study. Thirty oscillators are available to choose from, but you can also use an oscillator from another indicator that is on your chart, if you want. When you select an external indicator's plot as the oscillator, you must also specify the value of its centerline.
Oscillator Channel
Here, you control the visibility and colors of the reference line, its weighted version, and the oscillator channel between them.
You also specify what type of moving average you want to use as a reference line, its source and its length. This acts as the oscillator channel's baseline. The weighted line is also a moving average of the same type and length as the reference line, except that it will be calculated from the weighted version of the source used in the reference line. By default, the weighted line is capped to three standard deviations of the reference line. You can change that value, and also elect to cap using a multiple of ATR instead. The cap provides a mechanism to control how far the weighted line swings from the reference line. This section is also where you can enable the relative volume component of the weight.
Divergence Channel
This is where you control the appearance of the divergence channel and the key price values used in determining the channel's levels and breaching conditions. These choices have an impact on the behavior of the channel. More generous level prices like the default low and high selection will produce more conservative channels, as will the default choice for breach prices.
In this section, you can also enable a mode where an attempt is made to estimate the channel's bias before price breaches the channel. When it is enabled, successive increases/decreases of the channel's top and bottom levels are counted as new divergences occur. When one count is greater than the other, a bull/bear bias is inferred from it. You can also change the detection mode of divergences, and choose to display a mark above or below bars where divergences occur.
Bar Coloring
You specify here:
• The method used to color chart bars, if you choose to do so.
• If you want to hollow out the bodies of bars where volume has not increased since the last bar.
Marker/Alert Conditions
Here, you specify the conditions that will trigger up or down markers. The trigger conditions can include a combination of state transitions of the oscillator and the divergence channels. The triggering conditions can be filtered using a variety of conditions.
Configuring the marker conditions is necessary before creating an alert from this script, as the alert will use the marker conditions to trigger.
Realtime values will repaint, as is usually the case with oscillators, but markers only appear on bar closes, so they will not repaint. Keep in mind, when looking at markers on historical bars, that they are positioned on the bar when it closes — NOT when it opens.
Raw values
The raw values calculated by this script can be inspected using the Data Window, including the oscillator's value and the weights.
█ INTERPRETATION
Except when mentioned otherwise, this section's charts use the indicator's default settings, with different visual components turned on or off.
The aim of the oscillator channel is to provide a visual representation of an oscillator's general behavior. The simplest characteristic of the channel is its bull/bear state, determined by whether the weighted line is above or below the reference line. One can then distinguish between its bull and strong bull states, as transitions from strong bull to bull states will generally happen when trends are losing steam. While one should not infer a reversal from such transitions, they can be a good place to tighten stops. Only time will tell if a reversal will occur. One or more divergences will often occur before reversals. This shows the oscillator channel, with the reference line and the thicker, weighted line:
The nature of the divergence channel 's design makes it particularly adept at identifying consolidation areas if its settings are kept on the conservative side. The divergence channel will also reveal transition areas. A gray divergence channel should usually be considered a no-trade zone. More adventurous traders can use the oscillator channel to orient their trade entries if they accept the risk of trading in a neutral divergence channel, which by definition will not have been breached by price. This show only the divergence channels:
This chart shows divergence channels and their levels, and colors bars on divergences and on the state of the oscillator channel, which is not visible on the chart:
If your charts are already busy with other stuff you want to hold on to, you could consider using only the chart bar coloring component of this indicator. Here we only color bars using the combined state of the oscillator and divergence channel, and we do not color the bodies of bars where volume has not increased. Note that my chart's settings do not color the candle bodies:
At its simplest, one way to use this indicator would be to look for overlaps of the strong bull/bear colors in both the oscillator channel and a divergence channel, as these identify points where price is breaching the divergence channel when the oscillator's state is consistent with the direction of the breach.
Tip
One way to use the Workbench is to combine it with my Delta Volume Channels indicator. If both indicators use the same MA as a reference line, you can display its delta volume channel instead of the oscillator channel.
This chart shows such a setup. The Workbench displays its divergence levels, the weighted reference line using the default RSI oscillator, and colors bars on divergences. The DV Channels indicator only displays its delta volume channel, which uses the same MA as the workbench for its baseline. This way you can ascertain the volume delta situation in contrast with the visuals of the Workbench:
█ LIMITATIONS
• For some of the oscillators, assumptions are made concerning their different parameters when they are more complex than just a source and length.
See the `oscCalc()` function in this indicator's code for all the details, and ask me in a comment if you can't find the information you need.
• When an oscillator using volume is selected and no volume information is available for the chart's symbol, an error will occur.
• The method I use to convert an oscillator's value into a percentage is fragile in the early history of datasets
because of the nascent expression of the oscillator's range during those early bars.
█ NOTES
Working with this workbench
This indicator is called a workbench for a reason; it is designed for traders interested in exploring its behavior with different oscillators and settings, in the hope they can come up with a setup that suits their trading methodology. I cannot tell you which setup is the best because its setup should be compatible with your trading methodology, which may require faster or slower transitions, thus different configurations of the settings affecting the calculations of the divergence channels.
For Pine Script™ Coders
• This script uses the new overload of the fill() function which now makes it possible to do vertical gradients in Pine. I use it for both channels displayed by this script.
• I use the new arguments for plot() 's `display` parameter to control where the script plots some of its values,
namely those I only want to appear in the script's status line and in the Data Window.
• I used my ta library for some of the oscillator calculations and helper functions.
• I also used TradingView's ta library for other oscillator calculations.
• I wrote my script using the revised recommendations in the Style Guide from the Pine v5 User Manual.

Cutlers RSICutlers' RSI is a variation of the original RSI Developed by Welles Wilder.
This variation uses a simple moving average instead of an exponetial.
Since a simple moving average is used by this variation, a longer length tends to give better results compared to a shorter length.
CALCULATION
Step1: Calculating the Gains and Losses within the chosen period.
Step2: Calculating the simple moving averages of gains and losses.
Step3: Calculating Cutler’s Relative Strength (RS). Calculated using the following:
-> Cutler’s RS = SMA(gains,length) / SMA(losses,length)
Step 4: Calculating the Cutler’s Relative Strength Index (RSI). Calculated used the following:
-> RSI = 100 —
I have added some signals and filtering options with moving averages:
Trend OB/OS: Uptrend after above Overbought Level. Downtrend after below Oversold Level.
OB/OS: When above Overbought, or below oversold
50-Cross: Above 50 line is uptrend, below is downtrend
Direction: Moving up or down
RSI vs MA: RSI above MA is an uptrend, RSI below MA is a downtrend
The signals I added are just some potential ideas, always backtest your own strategies.

Delta Volume Channels [LucF]█ OVERVIEW
This indicator displays on-chart visuals aimed at making the most of delta volume information. It can color bars and display two channels: one for delta volume, another calculated from the price levels of bars where delta volume divergences occur. Markers and alerts can also be configured using key conditions, and filtered in many different ways. The indicator caters to traders who prefer chart visuals over raw values. It will work on historical bars and in real time, using intrabar analysis to calculate delta volume in both conditions.
█ CONCEPTS
Delta Volume
The volume delta concept divides a bar's volume in "up" and "down" volumes. The delta is calculated by subtracting down volume from up volume. Many calculation techniques exist to isolate up and down volume within a bar. The simplest techniques use the polarity of interbar price changes to assign their volume to up or down slots, e.g., On Balance Volume or the Klinger Oscillator . Others such as Chaikin Money Flow use assumptions based on a bar's OHLC values. The most precise calculation method uses tick data and assigns the volume of each tick to the up or down slot depending on whether the transaction occurs at the bid or ask price. While this technique is ideal, it requires huge amounts of data on historical bars, which usually limits the historical depth of charts and the number of symbols for which tick data is available.
This indicator uses intrabar analysis to achieve a compromise between the simplest and most precise methods of calculating volume delta. In the context where historical tick data is not yet available on TradingView, intrabar analysis is the most precise technique to calculate volume delta on historical bars on our charts. TradingView's Volume Profile built-in indicators use it, as do the CVD - Cumulative Volume Delta Candles and CVD - Cumulative Volume Delta (Chart) indicators published from the TradingView account . My Volume Delta Columns Pro indicator also uses intrabar analysis. Other volume delta indicators such as my Realtime 5D Profile use realtime chart updates to achieve more precise volume delta calculations. Indicators of that type cannot be used on historical bars however; they only work in real time.
This is the logic I use to assign intrabar volume to up or down slots:
• If the intrabar's open and close values are different, their relative position is used.
• If the intrabar's open and close values are the same, the difference between the intrabar's close and the previous intrabar's close is used.
• As a last resort, when there is no movement during an intrabar and it closes at the same price as the previous intrabar, the last known polarity is used.
Once all intrabars making up a chart bar have been analyzed and the up or down property of each intrabar's volume determined, the up volumes are added and the down volumes subtracted. The resulting value is volume delta for that chart bar, which can be used as an estimate of the buying/selling pressure on an instrument.
Delta Volume Percent (DV%)
This value is the proportion that delta volume represents of the total intrabar volume in the chart bar. Note that on some symbols/timeframes, the total intrabar volume may differ from the chart's volume for a bar, but that will not affect our calculations since we use the total intrabar volume.
Delta Volume Channel
The DV channel is the space between two moving averages: the reference line and a DV%-weighted version of that reference. The reference line is a moving average of a type, source and length which you select. The DV%-weighted line uses the same settings, but it averages the DV%-weighted price source.
The weight applied to the source of the reference line is calculated from two values, which are multiplied: DV% and the relative size of the bar's volume in relation to previous bars. The effect of this is that DV% values on bars with higher total volume will carry greater weight than those with lesser volume.
The DV channel can be in one of four states, each having its corresponding color:
• Bull (teal): The DV%-weighted line is above the reference line.
• Strong bull (lime): The bull condition is fulfilled and the bar's close is above the reference line and both the reference and the DV%-weighted lines are rising.
• Bear (maroon): The DV%-weighted line is below the reference line.
• Strong bear (pink): The bear condition is fulfilled and the bar's close is below the reference line and both the reference and the DV%-weighted lines are falling.
Divergences
In the context of this indicator, a divergence is any bar where the slope of the reference line does not match that of the DV%-weighted line. No directional bias is assigned to divergences when they occur.
Divergence Channel
The divergence channel is the space between two levels (by default, the bar's low and high ) saved when divergences occur. When price has breached a channel and a new divergence occurs, a new channel is created. Until that new channel is breached, bars where additional divergences occur will expand the channel's levels if the bar's price points are outside the channel.
Prices breaches of the divergence channel will change its state. Divergence channels can be in one of five different states:
• Bull (teal): Price has breached the channel to the upside.
• Strong bull (lime): The bull condition is fulfilled and the DV channel is in the strong bull state.
• Bear (maroon): Price has breached the channel to the downside.
• Strong bear (pink): The bear condition is fulfilled and the DV channel is in the strong bear state.
• Neutral (gray): The channel has not been breached.
█ HOW TO USE THE INDICATOR
Load the indicator on an active chart (see here if you don't know how).
The default configuration displays:
• The DV channel, without the reference or DV%-weighted lines.
• The Divergence channel, without its level lines.
• Bar colors using the state of the DV channel.
The default settings use an Arnaud-Legoux moving average on the close and a length of 20 bars. The DV%-weighted version of it uses a combination of DV% and relative volume to calculate the ultimate weight applied to the reference. The DV%-weighted line is capped to 5 standard deviations of the reference. The lower timeframe used to access intrabars automatically adjusts to the chart's timeframe and achieves optimal balance between the number of intrabars inspected in each chart bar, and the number of chart bars covered by the script's calculations.
The Divergence channel's levels are determined using the high and low of the bars where divergences occur. Breaches of the channel require a bar's low to move above the top of the channel, and the bar's high to move below the channel's bottom.
No markers appear on the chart; if you want to create alerts from this script, you will need first to define the conditions that will trigger the markers, then create the alert, which will trigger on those same conditions.
To learn more about how to use this indicator, you must understand the concepts it uses and the information it displays, which requires reading this description. There are no videos to explain it.
█ FEATURES
The script's inputs are divided in four sections: "DV channel", "Divergence channel", "Other Visuals" and "Marker/Alert Conditions". The first setting is the selection method used to determine the intrabar precision, i.e., how many lower timeframe bars (intrabars) are examined in each chart bar. The more intrabars you analyze, the more precise the calculation of DV% results will be, but the less chart coverage can be covered by the script's calculations.
DV Channel
Here, you control the visibility and colors of the reference line, its weighted version, and the DV channel between them.
You also specify what type of moving average you want to use as a reference line, its source and length. This acts as the DV channel's baseline. The DV%-weighted line is also a moving average of the same type and length as the reference line, except that it will be calculated from the DV%-weighted source used in the reference line. By default, the DV%-weighted line is capped to five standard deviations of the reference line. You can change that value here. This section is also where you can disable the relative volume component of the weight.
Divergence Channel
This is where you control the appearance of the divergence channel and the key price values used in determining the channel's levels and breaching conditions. These choices have an impact on the behavior of the channel. More generous level prices like the default low and high selection will produce more conservative channels, as will the default choice for breach prices.
In this section, you can also enable a mode where an attempt is made to estimate the channel's bias before price breaches the channel. When it is enabled, successive increases/decreases of the channel's top and bottom levels are counted as new divergences occur. When one count is greater than the other, a bull/bear bias is inferred from it.
Other Visuals
You specify here:
• The method used to color chart bars, if you choose to do so.
• The display of a mark appearing above or below bars when a divergence occurs.
• If you want raw values to appear in tooltips when you hover above chart bars. The default setting does not display them, which makes the script faster.
• If you want to display an information box which by default appears in the lower left of the chart.
It shows which lower timeframe is used for intrabars, and the average number of intrabars per chart bar.
Marker/Alert Conditions
Here, you specify the conditions that will trigger up or down markers. The trigger conditions can include a combination of state transitions of the DV and the divergence channels. The triggering conditions can be filtered using a variety of conditions.
Configuring the marker conditions is necessary before creating an alert from this script, as the alert will use the marker conditions to trigger.
Markers only appear on bar closes, so they will not repaint. Keep in mind, when looking at markers on historical bars, that they are positioned on the bar when it closes — NOT when it opens.
Raw values
The raw values calculated by this script can be inspected using a tooltip and the Data Window. The tooltip is visible when you hover over the top of chart bars. It will display on the last 500 bars of the chart, and shows the values of DV, DV%, the combined weight, and the intermediary values used to calculate them.
█ INTERPRETATION
The aim of the DV channel is to provide a visual representation of the buying/selling pressure calculated using delta volume. The simplest characteristic of the channel is its bull/bear state. One can then distinguish between its bull and strong bull states, as transitions from strong bull to bull states will generally happen when buyers are losing steam. While one should not infer a reversal from such transitions, they can be a good place to tighten stops. Only time will tell if a reversal will occur. One or more divergences will often occur before reversals.
The nature of the divergence channel's design makes it particularly adept at identifying consolidation areas if its settings are kept on the conservative side. A gray divergence channel should usually be considered a no-trade zone. More adventurous traders can use the DV channel to orient their trade entries if they accept the risk of trading in a neutral divergence channel, which by definition will not have been breached by price.
If your charts are already busy with other stuff you want to hold on to, you could consider using only the chart bar coloring component of this indicator:
At its simplest, one way to use this indicator would be to look for overlaps of the strong bull/bear colors in both the DV channel and a divergence channel, as these identify points where price is breaching the divergence channel when buy/sell pressure is consistent with the direction of the breach. I have highlighted all those points in the chart below. Not all of them would have produced profitable trades, but nothing is perfect in the markets. Also, keep in mind that the circles identify the visual you would be looking for — not the trade's entry level.
█ LIMITATIONS
• The script will not work on symbols where no volume is available. An error will appear when that is the case.
• Because a maximum of 100K intrabars can be analyzed by a script, a compromise is necessary between the number of intrabars analyzed per chart bar
and chart coverage. The more intrabars you analyze per chart bar, the less coverage you will obtain.
The setting of the "Intrabar precision" field in the "DV channel" section of the script's inputs
is where you control how the lower timeframe is calculated from the chart's timeframe.
█ NOTES
Volume Quality
If you use volume, it's important to understand its nature and quality, as it varies with sectors and instruments. My Volume X-ray indicator is one way you can appraise the quality of an instrument's intraday volume.
For Pine Script™ Coders
• This script uses the new overload of the fill() function which now makes it possible to do vertical gradients in Pine. I use it for both channels displayed by this script.
• I use the new arguments for plot() 's `display` parameter to control where the script plots some of its values,
namely those I only want to appear in the script's status line and in the Data Window.
• I wrote my script using the revised recommendations in the Style Guide from the Pine v5 User Manual.
█ THANKS
To PineCoders . I have used their lower_tf library in this script, to manage the calculation of the LTF and intrabar stats, and their Time library to convert a timeframe in seconds to a printable form for its display in the Information box.
To TradingView's Pine Script™ team. Their innovations and improvements, big and small, constantly expand the boundaries of the language. What this script does would not have been possible just a few months back.
And finally, thanks to all the users of my scripts who take the time to comment on my publications and suggest improvements. I do not reply to all but I do read your comments and do my best to implement your suggestions with the limited time that I have.

[_ParkF]MA_PackageThis indicator is a comprehensive set of moving averages.
All settings are handled in the input menu.
1. 6 moving averages are included.
2. You can edit the source of 6 moving averages.
3. You can change the type of each moving average line.
4. You can change the period value of each moving average line.
5. You can change the color of each moving average line.
6. You can change the thickness of each moving average line.
7. The predictive value of each moving average line will be displayed as a dot, and this value will be changed according to the type of the moving average line.
--------------------------------------------------------------------------------------------------------------------------------------------------------------------------------------------------------
이 지표는 이동평균선의 종합선물세트 입니다.
모든 설정은 input 메뉴에서 다뤄집니다.
1. 6개의 이동평균선이 포함 되어 있습니다.
2. 6개의 이동평균선의 소스를 수정할 수 있습니다.
3. 각각의 이동평균선의 타입을 변경할 수 있습니다.
4. 각각의 이동평균선의 기간값을 변경할 수 있습니다.
5. 각각의 이동평균선의 색상을 변경할 수 있습니다.
6. 각각의 이동평균선의 두께를 변경할 수 있습니다.
7. 각각의 이동평균선의 예측값이 점으로 표시될 것이고 이 값은 해당 이동평균선의 타입에 맞춰 변경됩니다.
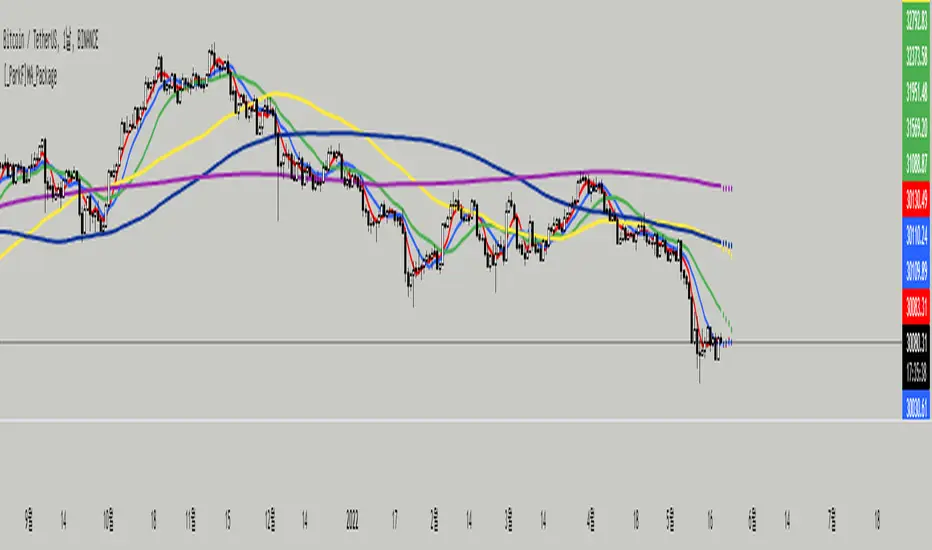
Awesome Oscillator PlusThe Awesome Oscillator is an indicator used to measure market momentum. AO calculates the difference of a 34 Period and 5 Period Simple Moving Averages. The Simple Moving Averages that are used are not calculated using closing price but rather each bar's midpoints. AO is generally used to affirm trends or to anticipate possible reversals.
The Awesome Oscillator's saucer is a trading signal that many analysts use to identify potential rapid changes in momentum. The saucer strategy involves looking for changes in three consecutive bars that are on the same side of the zero line.
AO's saucers can be either bullish or bearish. A bullish saucer can be identified when the awesome oscillator is above the zero line and there are two consecutive red bars – with the second bar being lower than the first – which are followed by a green bar.
On the other hand, a bearish saucer can be identified by two consecutive green bars below the zero line – with the second bar being lower than the first – which are immediately followed by a red bar.
Bullish saucer = Background and green arrow
Bearish saucer = Background and red arrow
Alerts can be triggered when a bullish or bearish saucer occurs.
Blue dots mean that the maximum or minimum of 150 periods has been exceeded (you can change the number of periods). Also added a signal line which can be exchanged for different moving averages.
The MACD line and histogram have a setting of Fast MA = 13, Slow MA = 21 and Signal = 8.
Added light blue dots as bullish signals (MACD line below zero and line crossing) and pink dots as bearish signals (MACD line above zero and line crossing). Alerts can be activated to notify such signals.

Multiple MAs + No Trend Zone + ATR WidgetThis is my first Pine Script attempt. Nothing special, just an "all in one" for the most common things I use, and what I have found to be the most common in a lot of strategies.
Great for free and limited accounts as it combines 7 total indicators into one.
-- First 5 indicators are Independant Moving Averages:
-Each one can be set for length, as well as source and type (SMA, EMA, SMMA, WMA, VWMA) individually
-- Second type (6th) of indicator is one I find extremly useful for staying OUT of consolidation trading. It's called a "No Trend Zone" indicator I swipped from the Hoffman Startegy. Basically, its set for a small deviation (0.5) of a 35 EMA, which creates a "Band" around the 35 line. When you have this "Band" flat or with no discernable incline/decline, with price action OR some or multiple moving averages inside this banded zone, it typically indicates a zone of consolidation. This will help you identify when you may be in one of those zones, that way you don't get trapped "waiting for paint to dry" before the market starts to move again with your position, and keep you from entering should you be considering the market at that time.
The last indicator is my favorite, and one I will refine a little deeper soon.
-- The ATR widget finishes us out. This widget can be customized for colors, turned on or off, and automatically rounds the ATR (ATR period based on the chart timeframe) to a nice readable number for what you're trading. It has settings to show or not, the length, what rounding style to use (forex pip 0.0001, forex/stock/etf/indicies 0.01) where to show it on the pane, a Multiplier Factor (for stop loss calculations automatically) and the colors.
***NOTE ABOUT ATR WIDGET:
I am primarily a forex trader, so the defaults are for Forex 0.0001. If you see some odd numbers (like 55798 on a current chart), check the inputs tab on the settings, and change the "ATR Style" from "Forex 0.0001" to "Forex/Stock/ETF/Indicies 0.01", and you should arrive with the correct number.

Moving Average StackTwo groups of moving averages.
Each group can have up to 3 three different moving averages.
You can choose between SMA, EMA, WMA, VWMA, or HMA for each group.
Integrated time locked capabilities so you can have long term moving averages shown on short timeframes.
Enjoy :)
