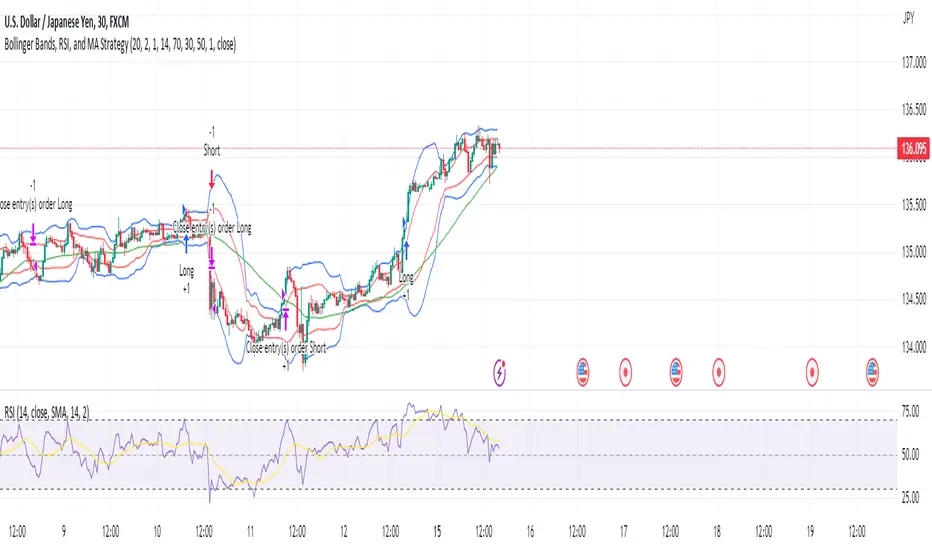
Bollinger Bands, RSI, and MA StrategyThe "Bollinger Bands, RSI and MA Strategy" is a trend-following strategy that combines the Bollinger Bands indicator, the Relative Strength Index (RSI), and a moving average (MA). It aims to identify potential entry and exit points in the market based on price volatility, momentum, and trend.
The strategy uses two Bollinger Bands with different standard deviations to create price channels. The default settings for the Bollinger Bands are a length of 20 periods and a standard deviation of 2.0. The upper and lower bands of the Bollinger Bands serve as dynamic resistance and support levels, respectively.
The RSI indicator is employed to gauge the strength of price momentum.
The strategy also incorporates a 50-period moving average (MA) to help identify the overall trend direction. When the price is above the MA, it suggests an uptrend, and when the price is below the MA, it suggests a downtrend.
The entry conditions for long trades are when the RSI is above the overbought level and there is no contraction in the Bollinger Bands. For short trades, the entry conditions are when the RSI is below the oversold level and there is no contraction in the Bollinger Bands.
The exit conditions for long trades are when the RSI drops below the overbought level or when the price closes below the 50-period MA.
For short trades, the exit conditions are when the RSI goes above the oversold level or when the price closes above the 50-period MA.
The strategy generates alerts for potential long and short entry signals, as well as for exit signals when the specified conditions are met. These alerts can be used to receive notifications or take further actions, such as placing trades manually or using automated trading systems.
It is important to note that this strategy serves as a starting point and should be thoroughly backtested and validated with historical data before applying it to live trading. Additionally, it is recommended to consider risk management techniques, including setting appropriate stop-loss and take-profit levels, to effectively manage trades.
Search in scripts for "bands"
Enhanced Bollinger Bands Strategy with SL/TP// Title: Enhanced Bollinger Bands Strategy with SL/TP
// Description:
// This strategy is based on the classic Bollinger Bands indicator and incorporates Stop Loss (SL) and Take Profit (TP) levels for automated trading. It identifies potential long and short entry points based on price crossing the lower and upper Bollinger Bands, respectively. The strategy allows users to customize several parameters to suit different market conditions and risk tolerances.
// Key Features:
// * **Bollinger Bands:** Uses Simple Moving Average (SMA) as the basis and calculates upper and lower bands based on a user-defined standard deviation multiplier.
// * **Customizable Parameters:** Offers extensive customization, including SMA length, standard deviation multiplier, Stop Loss (SL) in pips, and Take Profit (TP) in pips.
// * **Long/Short Position Control:** Allows users to independently enable or disable long and short positions.
// * **Stop Loss and Take Profit:** Implements Stop Loss and Take Profit levels based on pip values to manage risk and secure profits. Entry prices are set to the band levels on signals.
// * **Visualizations:** Provides options to display Bollinger Bands and entry signals on the chart for easy analysis.
// Strategy Logic:
// 1. **Bollinger Bands Calculation:** The strategy calculates the Bollinger Bands using the specified SMA length and standard deviation multiplier.
// 2. **Entry Conditions:**
// * **Long Entry:** Enters a long position when the closing price crosses above the lower Bollinger Band and the `Enable Long Positions` setting is enabled.
// * **Short Entry:** Enters a short position when the closing price crosses below the upper Bollinger Band and the `Enable Short Positions` setting is enabled.
// 3. **Exit Conditions:**
// * **Stop Loss:** Exits the position if the price reaches the Stop Loss level, calculated based on the input `Stop Loss (Pips)`.
// * **Take Profit:** Exits the position if the price reaches the Take Profit level, calculated based on the input `Take Profit (Pips)`.
// Input Parameters:
// * **SMA Length (length):** The length of the Simple Moving Average used to calculate the Bollinger Bands (default: 20).
// * **Standard Deviation Multiplier (mult):** The multiplier applied to the standard deviation to determine the width of the Bollinger Bands (default: 2.0).
// * **Enable Long Positions (enableLong):** A boolean value to enable or disable long positions (default: true).
// * **Enable Short Positions (enableShort):** A boolean value to enable or disable short positions (default: true).
// * **Pip Value (pipValue):** The value of a pip for the traded instrument. This is crucial for accurate Stop Loss and Take Profit calculations (default: 0.0001 for most currency pairs). **Important: Adjust this value to match the specific instrument you are trading.**
// * **Stop Loss (Pips) (slPips):** The Stop Loss level in pips (default: 10).
// * **Take Profit (Pips) (tpPips):** The Take Profit level in pips (default: 20).
// * **Show Bollinger Bands (showBands):** A boolean value to show or hide the Bollinger Bands on the chart (default: true).
// * **Show Entry Signals (showSignals):** A boolean value to show or hide entry signals on the chart (default: true).
// How to Use:
// 1. Add the strategy to your TradingView chart.
// 2. Adjust the input parameters to optimize the strategy for your chosen instrument and timeframe. Pay close attention to the `Pip Value`.
// 3. Backtest the strategy over different periods to evaluate its performance.
// 4. Use the `Enable Long Positions` and `Enable Short Positions` settings to customize the strategy for specific market conditions (e.g., only long positions in an uptrend).
// Important Notes and Disclaimers:
// * **Backtesting Results:** Past performance is not indicative of future results. Backtesting results can be affected by various factors, including market volatility, slippage, and transaction costs.
// * **Risk Management:** This strategy is provided for informational and educational purposes only and should not be considered financial advice. Always use proper risk management techniques when trading. Adjust Stop Loss and Take Profit levels according to your risk tolerance.
// * **Slippage:** The strategy takes into account slippage by specifying a slippage parameter on the `strategy` declaration. However, real-world slippage may vary.
// * **Market Conditions:** The performance of this strategy can vary significantly depending on market conditions. It may perform well in trending markets but poorly in ranging or choppy markets.
// * **Pip Value Accuracy:** **Ensure the `Pip Value` is correctly set for the specific instrument you are trading. Incorrect pip value will result in incorrect stop loss and take profit placement.** This is critical.
// * **Broker Compatibility:** The strategy's performance may vary depending on your broker's execution policies and fees.
// * **Disclaimer:** I am not a financial advisor, and this script is not financial advice. Use this strategy at your own risk. I am not responsible for any losses incurred while using this strategy.

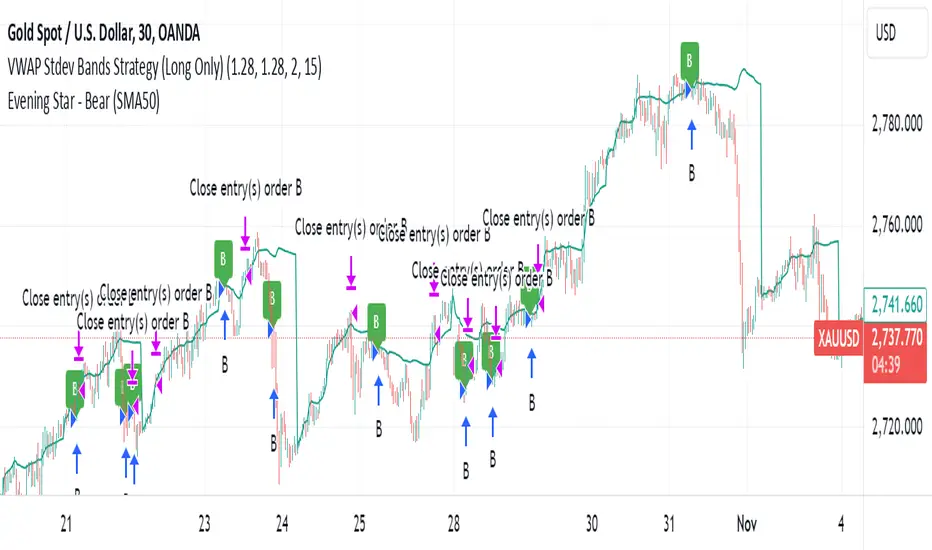
VWAP Stdev Bands Strategy (Long Only)The VWAP Stdev Bands Strategy (Long Only) is designed to identify potential long entry points in trending markets by utilizing the Volume Weighted Average Price (VWAP) and standard deviation bands. This strategy focuses on capturing upward price movements, leveraging statistical measures to determine optimal buy conditions.
Key Features:
VWAP Calculation: The strategy calculates the VWAP, which represents the average price a security has traded at throughout the day, weighted by volume. This is an essential indicator for determining the overall market trend.
Standard Deviation Bands: Two bands are created above and below the VWAP, calculated using specified standard deviations. These bands act as dynamic support and resistance levels, providing insight into price volatility and potential reversal points.
Trading Logic:
Long Entry Condition: A long position is triggered when the price crosses below the lower standard deviation band and then closes above it, signaling a potential price reversal to the upside.
Profit Target: The strategy allows users to set a predefined profit target, closing the long position once the specified target is reached.
Time Gap Between Orders: A customizable time gap can be specified to prevent multiple orders from being placed in quick succession, allowing for a more controlled trading approach.
Visualization: The VWAP and standard deviation bands are plotted on the chart with distinct colors, enabling traders to visually assess market conditions. The strategy also provides optional plotting of the previous day's VWAP for added context.
Use Cases:
Ideal for traders looking to engage in long-only positions within trending markets.
Suitable for intraday trading strategies or longer-term approaches based on market volatility.
Customization Options:
Users can adjust the standard deviation values, profit target, and time gap to tailor the strategy to their specific trading style and market conditions.
Note: As with any trading strategy, it is important to conduct thorough backtesting and analysis before live trading. Market conditions can change, and past performance does not guarantee future results.
EMA bands + leledc + bollinger bands trend following strategy v2The basics:
In its simplest form, this strategy is a positional trend following strategy which enters long when price breaks out above "middle" EMA bands and closes or flips short when price breaks down below "middle" EMA bands. The top and bottom of the middle EMA bands are calculated from the EMA of candle highs and lows, respectively.
The idea is that entering trades on breakouts of the high EMAs and low EMAs rather than the typical EMA based on candle closes gives a bit more confirmation of trend strength and minimizes getting chopped up. To further reduce getting chopped up, the strategy defaults to close on crossing the opposite EMA band (ie. long on break above high EMA middle band and close below low EMA middle band).
This strategy works on all markets on all timeframes, but as a trend following strategy it works best on markets prone to trending such as crypto and tech stocks. On lower timeframes, longer EMAs tend to work best (I've found good results on EMA lengths even has high up to 1000), while 4H charts and above tend to work better with EMA lengths 21 and below.
As an added filter to confirm the trend, a second EMA can be used. Inputting a slower EMA filter can ensure trades are entered in accordance with longer term trends, inputting a faster EMA filter can act as confirmation of breakout strength.
Bar coloring can be enabled to quickly visually identify a trend's direction for confluence with other indicators or strategies.
The goods:
Waiting for the trend to flip before closing a trade (especially when a longer base EMA is used) often leaves money on the table. This script combines a number of ways to identify when a trend is exhausted for backtesting the best early exits.
"Delayed bars inside middle bands" - When a number of candle's in a row open and close between the middle EMA bands, it could be a sign the trend is weak, or that the breakout was not the start of a new trend. Selecting this will close out positions after a number of bars has passed
"Leledc bars" - Originally introduced by glaz, this is a price action indicator that highlights a candle after a number of bars in a row close the same direction and result in greatest high/low over a period. It often triggers when a strong trend has paused before further continuation, or it marks the end of a trend. To mitigate closing on false Leledc signals, this strategy has two options: 1. Introducing requirement for increased volume on the Leledc bars can help filter out Leledc signals that happen mid trend. 2. Closing after a number of Leledc bars appear after position opens. These two options work great in isolation but don't perform well together in my testing.
"Bollinger Bands exhaustion bars" - These bars are highlighted when price closes back inside the Bollinger Bands and RSI is within specified overbought/sold zones. The idea is that a trend is overextended when price trades beyond the Bollinger Bands. When price closes back inside the bands it's likely due for mean reversion back to the base EMA in which this strategy will ideally re-enter a position. Since the added RSI requirements often make this indicator too strict to trigger a large enough sample size to backtest, I've found it best to use "non-standard" settings for both the bands and the RSI as seen in the default settings.
"Buy/Sell zones" - Similar to the idea behind using Bollinger Bands exhaustion bars as a closing signal. Instead of calculating off of standard deviations, the Buy/Sell zones are calculated off multiples of the middle EMA bands. When trading beyond these zones and subsequently failing back inside, price may be due for mean reversion back to the base EMA. No RSI filter is used for Buy/Sell zones.
If any early close conditions are selected, it's often worth enabling trade re-entry on "middle EMA band bounce". Instead of waiting for a candle to close back inside the middle EMA bands, this feature will re-enter position on only a wick back into the middle bands as will sometimes happen when the trend is strong.
Any and all of the early close conditions can be combined. Experimenting with these, I've found can result in less net profit but higher win-rates and sharpe ratios as less time is spent in trades.
The deadly:
The trend is your friend. But wouldn't it be nice to catch the trends early? In ranging markets (or when using slower base EMAs in this strategy), waiting for confirmation of a breakout of the EMA bands at best will cause you to miss half the move, at worst will result in getting consistently chopped up. Enabling "counter-trend" trades on this strategy will allow the strategy to enter positions on the opposite side of the EMA bands on either a Leledc bar or Bollinger Bands exhaustion bar. There is a filter requiring either a high/low (for Leledc) or open (for BB bars) outside the selected inner or outer Buy/Sell zone. There are also a number of different close conditions for the counter-trend trades to experiment with and backtest.
There are two ways I've found best to use counter-trend trades
1. Mean reverting scalp trades when a trend is clearly overextended. Selecting from the first 5 counter-trend closing conditions on the dropdown list will usually close the trades out quickly, with less profit but less risk.
2. Trying to catch trends early. Selecting any of the close conditions below the first 5 can cause the strategy to behave as if it's entering into a new trend (from the wrong side).
This feature can be deadly effective in profiting from every move price makes, or deadly to the strategy's PnL if not set correctly. Since counter-trend trades open opposite the middle bands, a stop-loss is recommended to reduce risk. If stop-losses for counter-trend trades are disabled, the strategy will hold a position open often until liquidation in a trending market if th trade is offsides. Note that using a slower base EMA makes counter-trend stop-losses even more necessary as it can reduce the effectiveness of the Buy/Sell zone filter for opening the trades as price can spend a long time trending outside the zones. If faster EMAs (34 and below) are used with "Inner" Buy/Zone filter selected, the first few closing conditions will often trigger almost immediately closing the trade at a loss.
The niche:
I've added a feature to default into longs or shorts. Enabling these with other features (aside from the basic long/short on EMA middle band breakout) tends to break the strategy one way or another. Enabling default long works to simulate trying to acquire more of the asset rather than the base currency. Enabling default short can have positive results for those high FDV, high inflation coins that go down-only for months at a time. Otherwise, I use default short as a hedge for coins that I hold and stake spot. I gain the utility and APR of staking while reducing the risk of holding the underlying asset by maintaining a net neutral position *most* of the time.
Disclaimer:
This script is intended for experimenting and backtesting different strategies around EMA bands. Use this script for your live trading at your own risk. I am a rookie coder, as such there may be errors in the code that cause the strategy to behave not as intended. As far as I can tell it doesn't repaint, but I cannot guarantee that it does not. That being said if there's any question, improvements, or errors you've found, drop a comment below!

Bollinger Bands Mean Reversion by Kevin Davey Bollinger Bands Mean Reversion Strategy Description
The Bollinger Bands Mean Reversion Strategy is a popular trading approach based on the concept of volatility and market overreaction. The strategy leverages Bollinger Bands, which consist of an upper and lower band plotted around a central moving average, typically using standard deviations to measure volatility. When the price moves beyond these bands, it signals potential overbought or oversold conditions, and the strategy seeks to exploit a reversion back to the mean (the central band).
Strategy Components:
1. Bollinger Bands:
The bands are calculated using a 20-period Simple Moving Average (SMA) and a multiple (usually 2.0) of the standard deviation of the asset’s price over the same period. The upper band represents the SMA plus two standard deviations, while the lower band is the SMA minus two standard deviations. The distance between the bands increases with higher volatility and decreases with lower volatility.
2. Mean Reversion:
Mean reversion theory suggests that, over time, prices tend to move back toward their historical average. In this strategy, a buy signal is triggered when the price falls below the lower Bollinger Band, indicating a potential oversold condition. Conversely, the position is closed when the price rises back above the upper Bollinger Band, signaling an overbought condition.
Entry and Exit Logic:
Buy Condition: The strategy enters a long position when the price closes below the lower Bollinger Band, anticipating a mean reversion to the central band (SMA).
Sell Condition: The long position is exited when the price closes above the upper Bollinger Band, implying that the market is likely overbought and a reversal could occur.
This approach uses mean reversion principles, aiming to capitalize on short-term price extremes and volatility compression, often seen in sideways or non-trending markets. Scientific studies have shown that mean reversion strategies, particularly those based on volatility indicators like Bollinger Bands, can be effective in capturing small but frequent price reversals  .
Scientific Basis for Bollinger Bands:
Bollinger Bands, developed by John Bollinger, are widely regarded in both academic literature and practical trading as an essential tool for volatility analysis and mean reversion strategies. Research has shown that Bollinger Bands effectively identify relative price highs and lows, and can be used to forecast price volatility and detect potential breakouts . Studies in financial markets, such as those by Fernández-Rodríguez et al. (2003), highlight the efficacy of Bollinger Bands in detecting overbought or oversold conditions in various assets .
Who is Kevin Davey?
Kevin Davey is an award-winning algorithmic trader and highly regarded expert in developing and optimizing systematic trading strategies. With over 25 years of experience, Davey gained significant recognition after winning the prestigious World Cup Trading Championships multiple times, where he achieved triple-digit returns with minimal drawdown. His success has made him a key figure in algorithmic trading education, with a focus on disciplined and rule-based trading systems.

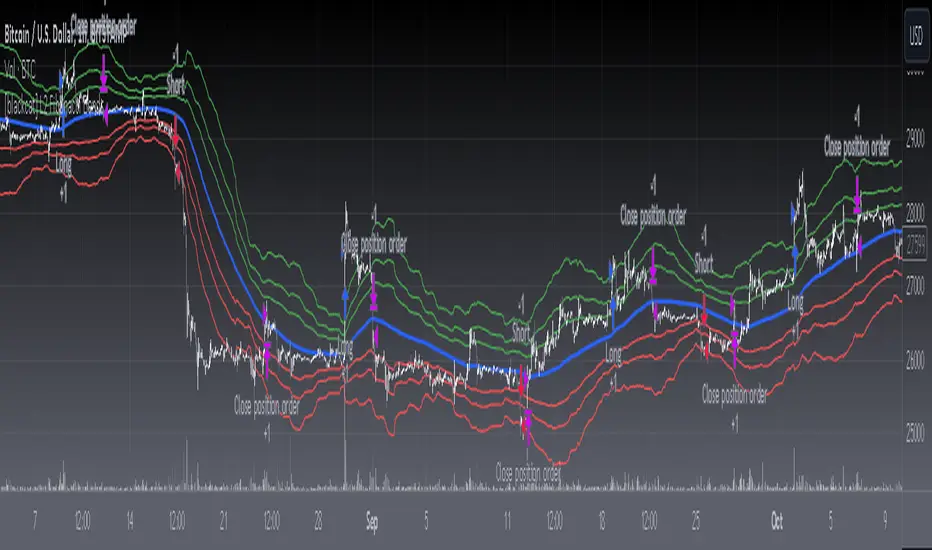
[blackcat] L2 Fibonacci BandsThe concept of the Fibonacci Bands indicator was described by Suri Dudella in his book "Trade Chart Patterns Like the Pros" (Section 8.3, page 149). These bands are derived from Fibonacci expansions based on a fixed moving average, and they display potential areas of support and resistance. Traders can utilize the Fibonacci Bands indicator to identify key price levels and anticipate potential reversals in the market.
To calculate the Fibonacci Bands indicator, three Keltner Channels are applied. These channels help in determining the upper and lower boundaries of the bands. The default Fibonacci expansion levels used are 1.618, 2.618, and 4.236. These levels act as reference points for traders to identify significant areas of support and resistance.
When analyzing the price action, traders can focus on the extreme Fibonacci Bands, which are the upper and lower boundaries of the bands. If prices trade outside of the bands for a few bars and then return inside, it may indicate a potential reversal. This pattern suggests that the price has temporarily deviated from its usual range and could be due for a correction.
To enhance the accuracy of the Fibonacci Bands indicator, traders often use multiple time frames. By aligning short-term signals with the larger time frame scenario, traders can gain a better understanding of the overall market trend. It is generally advised to trade in the direction of the larger time frame to increase the probability of success.
In addition to identifying potential reversals, traders can also use the Fibonacci Bands indicator to determine entry and exit points. Short-term support and resistance levels can be derived from the bands, providing valuable insights for trade decision-making. These levels act as reference points for placing stop-loss orders or taking profits.
Another useful tool for analyzing the trend is the slope of the midband, which is the middle line of the Fibonacci Bands indicator. The midband's slope can indicate the strength and direction of the trend. Traders can monitor the slope to gain insights into the market's momentum and make informed trading decisions.
The Fibonacci Bands indicator is based on the concept of Fibonacci levels, which are support or resistance levels calculated using the Fibonacci sequence. The Fibonacci sequence is a mathematical pattern that follows a specific formula. A central concept within the Fibonacci sequence is the Golden Ratio, represented by the numbers 1.618 and its inverse 0.618. These ratios have been found to occur frequently in nature, architecture, and art.
The Italian mathematician Leonardo Fibonacci (1170-1250) is credited with introducing the Fibonacci sequence to the Western world. Fibonacci noticed that certain ratios could be calculated and that these ratios correspond to "divine ratios" found in various aspects of life. Traders have adopted these ratios in technical analysis to identify potential areas of support and resistance in financial markets.
In conclusion, the Fibonacci Bands indicator is a powerful tool for traders to identify potential reversals, determine entry and exit points, and analyze the overall trend. By combining the Fibonacci Bands with other technical indicators and using multiple time frames, traders can enhance their trading strategies and make more informed decisions in the market.
Bollinger Bands StrategyBollinger Bands Strategy :
INTRODUCTION :
This strategy is based on the famous Bollinger Bands. These are constructed using a standard moving average (SMA) and the standard deviation of past prices. The theory goes that 90% of the time, the price is contained between these two bands. If it were to break out, this would mean either a reversal or a continuation. However, when a reversal occurs, the movement is weak, whereas when a continuation occurs, the movement is substantial and profits can be interesting. We're going to use BB to take advantage of this strong upcoming movement, while managing our risks reasonably. There's also a money management method for reinvesting part of the profits or reducing the size of orders in the event of substantial losses.
BOLLINGER BANDS :
The construction of Bollinger bands is straightforward. First, plot the SMA of the price, with a length specified by the user. Then calculate the standard deviation to measure price dispersion in relation to the mean, using this formula :
stdv = (((P1 - avg)^2 + (P2 - avg)^2 + ... + (Pn - avg)^2) / n)^1/2
To plot the two Bollinger bands, we then add a user-defined number of standard deviations to the initial SMA. The default is to add 2. The result is :
Upper_band = SMA + 2*stdv
Lower_band = SMA - 2*stdv
When the price leaves this channel defined by the bands, we obtain buy and sell signals.
PARAMETERS :
BB Length : This is the length of the Bollinger Bands, i.e. the length of the SMA used to plot the bands, and the length of the price series used to calculate the standard deviation. The default is 120.
Standard Deviation Multipler : adds or subtracts this number of times the standard deviation from the initial SMA. Default is 2.
SMA Exit Signal Length : Exit signals for winning and losing trades are triggered by another SMA. This parameter defines the length of this SMA. The default is 110.
Max Risk per trade (in %) : It's the maximum percentage the user can lose in one trade. The default is 6%.
Fixed Ratio : This is the amount of gain or loss at which the order quantity is changed. The default is 400, meaning that for each $400 gain or loss, the order size is increased or decreased by a user-selected amount.
Increasing Order Amount : This is the amount to be added to or subtracted from orders when the fixed ratio is reached. The default is $200, which means that for every $400 gain, $200 is reinvested in the strategy. On the other hand, for every $400 loss, the order size is reduced by $200.
Initial capital : $1000
Fees : Interactive Broker fees apply to this strategy. They are set at 0.18% of the trade value.
Slippage : 3 ticks or $0.03 per trade. Corresponds to the latency time between the moment the signal is received and the moment the order is executed by the broker.
Important : A bot has been used to test the different parameters and determine which ones maximize return while limiting drawdown. This strategy is the most optimal on BITSTAMP:BTCUSD in 8h timeframe with the following parameters :
BB Length = 120
Standard Deviation Multipler = 2
SMA Exit Signal Length = 110
Max Risk per trade (in %) = 6%
ENTER RULES :
The entry rules are simple:
If close > Upper_band it's a LONG signal
If close < Lower_band it's a SHORT signal
EXIT RULES :
If we are LONG and close < SMA_EXIT, position is closed
If we are SHORT and close > SMA_EXIT, the position is closed
Positions close automatically if they lose more than 6% to limit risk
RISK MANAGEMENT :
This strategy is subject to losses. We manage our risk using the exit SMA or using a SL sets to 6%. This SMA gives us exit signals when the price closes below or above, thus limiting losses. If the signal arrives too late, the position is closed after a loss of 6%.
MONEY MANAGEMENT :
The fixed ratio method was used to manage our gains and losses. For each gain of an amount equal to the fixed ratio value, we increase the order size by a value defined by the user in the "Increasing order amount" parameter. Similarly, each time we lose an amount equal to the value of the fixed ratio, we decrease the order size by the same user-defined value. This strategy increases both performance and drawdown.
NOTE :
Please note that the strategy is backtested from 2017-01-01. As the timeframe is 8h, this strategy is a medium/long-term strategy. That's why only 51 trades were closed. Be careful, as the test sample is small and performance may not necessarily reflect what may happen in the future.
Enjoy the strategy and don't forget to take the trade :)

Fibonacci & Bollinger Bands StrategyThis strategy combines Bollinger Bands and Fibonacci retracement/extension levels to identify potential entry and exit points in the market. Here’s a breakdown of each component and how the strategy works:
1. Bollinger Bands:
Bollinger Bands consist of a simple moving average (SMA) and two standard deviations (upper and lower bands) plotted above and below the SMA. The bands expand and contract based on market volatility.
Purpose in Strategy:
The lower band represents an area where the market might be oversold.
The upper band represents an area where the market might be overbought.
The price crossing these bands suggests overextended market conditions, which can be used to identify potential reversals.
2. Fibonacci Retracement and Extension Levels:
Fibonacci retracement levels are horizontal lines that indicate where price might find support or resistance as it retraces some of its previous movement. Common retracement levels are 61.8% and 78.6%.
Fibonacci extension levels are used to project areas where the price might extend after completing a retracement. These levels can help determine potential targets after a significant price movement.
Purpose in Strategy:
The strategy calculates the most recent swing high (fibHigh) and swing low (fibLow) over a lookback period. It then plots Fibonacci retracement and extension levels based on this range.
The Fibonacci levels are used as key support and resistance areas. The price approaching or touching these levels signals potential turning points in the market.
3. Entry Criteria:
A long position (buy) is triggered when:
The price crosses below the lower Bollinger Band, indicating an oversold condition.
The price is near or above a Fibonacci extension level (calculated based on the most recent price swing).
This suggests that the price is potentially reaching a strong support area, where a reversal is likely.
4. Exit Criteria:
The long position is closed (exit trade) when either:
The price touches or crosses the upper Bollinger Band, signaling an overbought condition.
The price reaches a Fibonacci retracement level or exceeds the recent swing high (fibHigh), indicating a potential exhaustion point or a reversal area.
5. General Strategy Logic:
The strategy takes advantage of market volatility (captured by the Bollinger Bands) and key support/resistance levels (determined by Fibonacci retracement and extension levels).
By combining these two techniques, the strategy identifies potential entry points at oversold levels with the expectation that the market will retrace or reverse upward, especially when near key Fibonacci extension levels.
Exit points are identified by potential overbought levels (Bollinger upper band) or key Fibonacci retracement levels, where the price might reverse downward.
6. Conditions to Execute the Strategy:
The Fibonacci levels are only calculated once the price has made a significant movement, establishing a recent high and low over a 50-bar period (which you can adjust). This ensures the Fibonacci levels are based on meaningful swings.
The entry and exit signals are filtered using both Bollinger Bands and Fibonacci levels to ensure that trades are not taken solely based on one indicator, thus reducing false signals.
Key Features of the Strategy:
Trend-following with reversal: It tries to catch reversals when the price hits extreme levels (Bollinger Bands) while respecting important Fibonacci levels.
Dynamic market adaptation: The strategy adapts to market conditions as it recalculates Fibonacci levels based on recent price swings and adjusts the Bollinger Bands for market volatility.
Confirmation through multiple indicators: It uses both the volatility-based signals from Bollinger Bands and the price structure from Fibonacci levels to confirm trade entries and exits.
Summary of the Strategy:
The strategy looks to buy low and sell high based on oversold/overbought signals from Bollinger Bands and Fibonacci levels that indicate key support and resistance zones.
By combining these two technical indicators, the strategy aims to reduce risk and increase accuracy by only entering trades when both indicators suggest favorable conditions.

Bollinger Bands + RSI StrategyThe Bollinger Bands + RSI strategy combines volatility and momentum indicators to spot trading opportunities in intraday settings. Here’s a concise summary:
Components:
Bollinger Bands: Measures market volatility. The lower band signals potential buying opportunities when the price is considered oversold.
Relative Strength Index (RSI): Evaluates momentum to identify overbought or oversold conditions. An RSI below 30 indicates oversold, suggesting a buy, and above 70 indicates overbought, suggesting a sell.
Strategy Execution:
Buy Signal : Triggered when the price falls below the lower Bollinger Band while the RSI is also below 30.
Sell Signal : Activated when the price exceeds the upper Bollinger Band with an RSI above 70.
Exit Strategy : Exiting a buy position is considered when the RSI crosses back above 50, capturing potential rebounds.
Advantages:
Combines price levels with momentum for more reliable signals.
Clearly defined entry and exit points help minimize emotional trading.
Considerations:
Can produce false signals in very volatile or strongly trending markets.
Best used in markets without a strong prevailing trend.
This strategy aids traders in making decisions based on technical indicators, enhancing their ability to profit from short-term price movements.

BOLLY BandsThis is a strategy using Bollinger Bands. The strategy is predicated around having low volatility in price action and then looking to capture a move when price starts to trend outside of the Bollinger bands. This strategy has only been backtested for 1 month but it has promising results so I will be sharing it looking for feedback. I run this strategy on the ERUSD 1 min chart.

PTS - Bollinger Bands with Trailing StopPTS - Bollinger Bands with Trailing Stop Strategy
Overview
The "PTS - Bollinger Bands with Trailing Stop" strategy is designed to capitalize on strong bullish market movements by combining the Bollinger Bands indicator with a dynamic trailing stop based on the Average True Range (ATR). This strategy aims to enter long positions during upward breakouts and protect profits through an adaptive exit mechanism.
Key Features
1. Bollinger Bands Indicator
Basis Moving Average Type: Choose from SMA, EMA, SMMA, WMA, or VWMA for the Bollinger Bands' basis line. Length: Adjustable period for calculating the moving average and standard deviation (default is 20). Standard Deviation Multiplier (StdDev): Determines the width of the bands (default is 2.0). Source: Select the price data used for calculations (default is the closing price).
2. Entry Conditions
The strategy enters a long position when the closing price crosses above the upper Bollinger Band , indicating strong upward momentum.
3. Exit Conditions
Trailing Stop Loss: Implemented using ATR to adjust dynamically with market volatility. ATR Length: Period for calculating ATR (default is 14). ATR Multiplier for Trailing Stop: Determines how closely the trailing stop follows the price (default is 2.0). Close Below Lower Bollinger Band: The strategy exits the long position if the closing price crosses below the lower Bollinger Band .
4. Risk Management
Commission and Slippage: Commission is set at 0.1%; slippage is set to 3. Position Sizing: Uses 100% of equity per trade (adjustable).
5. Date Range Filter
Specify the time period during which the strategy is active. Start Date: January 1, 2018. End Date: December 31, 2069.
Customizable Inputs
BB Length: Adjust the period for Bollinger Bands calculation. BB StdDev: Modify the standard deviation multiplier. Basis MA Type: Select the moving average type. Source: Choose the price data source. Offset: Shift the Bollinger Bands on the chart. ATR Length: Set the period for ATR calculation. ATR Multiplier for Trailing Stop: Adjust the trailing stop sensitivity.
Thought for 1m 7s
Description for the "PTS - Bollinger Bands with Trailing Stop" Strategy
PTS - Bollinger Bands with Trailing Stop Strategy
Overview
The "PTS - Bollinger Bands with Trailing Stop" strategy is designed to capitalize on strong bullish market movements by combining the Bollinger Bands indicator with a dynamic trailing stop based on the Average True Range (ATR). This strategy aims to enter long positions during upward breakouts and protect profits through an adaptive exit mechanism.
Key Features
1. Bollinger Bands Indicator
Basis Moving Average Type: Choose from SMA, EMA, SMMA, WMA, or VWMA for the Bollinger Bands' basis line. Length: Adjustable period for calculating the moving average and standard deviation (default is 20). Standard Deviation Multiplier (StdDev): Determines the width of the bands (default is 2.0). Source: Select the price data used for calculations (default is the closing price).
2. Entry Conditions
The strategy enters a long position when the closing price crosses above the upper Bollinger Band , indicating strong upward momentum.
3. Exit Conditions
Trailing Stop Loss: Implemented using ATR to adjust dynamically with market volatility. ATR Length: Period for calculating ATR (default is 14). ATR Multiplier for Trailing Stop: Determines how closely the trailing stop follows the price (default is 2.0). Close Below Lower Bollinger Band: The strategy exits the long position if the closing price crosses below the lower Bollinger Band .
4. Risk Management
Commission and Slippage: Commission is set at 0.1%; slippage is set to 3. Position Sizing: Uses 100% of equity per trade (adjustable).
5. Date Range Filter
Specify the time period during which the strategy is active. Start Date: January 1, 2018. End Date: December 31, 2069.
Customizable Inputs
BB Length: Adjust the period for Bollinger Bands calculation. BB StdDev: Modify the standard deviation multiplier. Basis MA Type: Select the moving average type. Source: Choose the price data source. Offset: Shift the Bollinger Bands on the chart. ATR Length: Set the period for ATR calculation. ATR Multiplier for Trailing Stop: Adjust the trailing stop sensitivity.
How the Strategy Works
1. Initialization
Calculates Bollinger Bands and ATR based on selected parameters.
2. Entry Logic
Opens a long position when the closing price exceeds the upper Bollinger Band.
3. Exit Logic
Uses a trailing stop loss based on ATR. Exits if the closing price drops below the lower Bollinger Band.
4. Date Filtering
Executes trades only within the specified date range.
Advantages
Adaptive Risk Management: Trailing stop adjusts to market volatility. Simplicity: Clear entry and exit signals. Customizable Parameters: Tailor the strategy to different assets or conditions.
Considerations
Aggressive Position Sizing: Using 100% equity per trade is high-risk. Market Conditions: Best in trending markets; may produce false signals in sideways markets. Backtesting: Always test on historical data before live trading.
Disclaimer
This strategy is intended for educational and informational purposes only. Trading involves significant risk, and past performance is not indicative of future results. Assess your financial situation and consult a financial advisor if necessary.
Usage Instructions
1. Apply the Strategy: Add it to your TradingView chart. 2. Configure Inputs: Adjust parameters to suit your style and asset. 3. Analyze Backtest Results: Use the Strategy Tester. 4. Optimize Parameters: Experiment with input values. 5. Risk Management: Evaluate position sizing and incorporate risk controls.
Final Notes
The "PTS - Bollinger Bands with Trailing Stop" strategy provides a framework to leverage momentum breakouts while managing risk through adaptive trailing stops. Customize and test thoroughly to align with your trading objectives.

Bollinger Bands - Breakout StrategyThe Bollinger Bands - Breakout Strategy is a trend-following optimized for short-term trading in the crypto market. This strategy employs the Bollinger Bands, a widely recognized technical indicator, as its primary instrument for pinpointing potential trades. It is capable of executing both long and short positions, depending on whether the market is in a spot or futures, and is particularly effective in trending markets.
The strategy boasts a high degree of configurability, allowing users to set the Bollinger Bands period and deviation, trend filter, volatility filter, trade direction filter, rate of change filter, and date filter. Furthermore, it offers options for Take Profit, Stop Loss, and Trailing Stop for both long and short positions, ensuring a comprehensive risk management approach. The inclusion of a maximum intraday loss feature adds another layer of protection, making this strategy a valuable tool for traders seeking a professional and adaptable trading system.
Name : Bollinger Bands - Breakout Strategy
Category : Trend Follower based on Bollinger Bands
Operating mode : Long and Short on Futures or Long on Spot
Trade duration : Intraday
Timeframe : 2H, 3H, 4H, 5H
Market : Crypto
Suggested usage : Trending Markets
Entry : When the price crosses above or below the Bollinger Bands
Exit : Opposite Cross or Profit target, Trailing stop or Stop loss
Configuration :
- Bollinger Bands period and deviation
- Trend Filter
- Volatility Filter
- Trade direction filter
- Rate of Change filter
- Date Filter (for backtesting purposes)
- Take Profit, Stop Loss and Trailing Stop for long and short positions
- Risk Management: Max Intraday Loss
Backtesting :
⁃ Exchange: BINANCE
⁃ Pair: BTCUSDT.P
⁃ Timeframe: 4H
⁃ Fee: 0.025%
⁃ Slippage: 1
- Initial Capital: 10000 USDT
- Position sizing: 10% of Equity
- Start : 2019-09-19 (Out Of Sample from 2022-12-23)
- Bar magnifier: on
Credits :
- LucF of Pine Coders for f_security function to avoid repainting using security.
- QuantNomad for Monthly Table.
Disclaimer : Risk Management is crucial, so adjust stop loss to your comfort level. A tight stop loss can help minimise potential losses. Use at your own risk.
How you or we can improve? Source code is open so share your ideas!
Leave a comment and smash the boost button!
Thanks for your attention, happy to support the TradingView community.

Extended Recursive Bands StrategyThe original indicator was created by alexgrover .
All credit goes to alexgrover for creating the indicator that this strategy uses.
This strategy was posted because there were multiple requests for it, and no strategy based on this indicator exists yet.
The Recursive Bands Indicator, an indicator specially created to be extremely efficient, I think you already know that calculation time is extra important in algorithmic trading, and this is the principal motivation for the creation of the proposed indicator. Originally described in Alex's paper "Pierrefeu, Alex (2019): Recursive Bands - A New Indicator For Technical Analysis", the indicator framework has been widely used in his previous uploaded indicators, however it would have been a shame to not upload it, however user experience being a major concern for me, I decided to add extra options, which explain the term "extended".
The Indicator
The indicator displays one upper and one lower band, every common usages applied to bands indicators such as support/resistance , breakout, trailing stop, etc, can also be applied to this one. Length controls how reactive the bands are, higher values will make the bands cross the price less often.
In order to provide more flexibility for the user alexgrover added the option to use various methods for the calculation of the indicator, therefore the indicator can use the average true range , standard deviation, average high-low range, and one totally exclusive method specially designed for this indicator.
Added logic:
We have implemented a logic that checks whether the bands have been following in the same direction for a set amount of bars. This logic must be true before it can enter trades. This is completely new code that was written by us entirely, and it makes a huge difference on strategy performance.
Strategy Long conditions:
1 — Price low is below the the lower band.
2 — The lower band keeps increasing in value until the 'lookback' setting amount of bars is reached.
Strategy Short conditions:
1 — Price high is above the upper band.
2 — The upper band keeps decreasing in value until the 'lookback' setting amount of bars is reached.
Strategy Properties:
We have set a default commission of 0.06% because these are Bybit's fees. The strategy uses an order size of 10% of equity, since drawdown is very low like this. We also use a 10 tick slippage to keep results realistic and account for this. All other settings were left as default apart from initial capital, just to decrease the size of the numbers.

Bollinger Bands Enhanced StrategyOverview
The common practice of using Bollinger bands is to use it for building mean reversion or squeeze momentum strategies. In the current script Bollinger Bands Enhanced Strategy we are trying to combine the strengths of both strategies types. It utilizes Bollinger Bands indicator to buy the local dip and activates trailing profit system after reaching the user given number of Average True Ranges (ATR). Also it uses 200 period EMA to filter trades only in the direction of a trend. Strategy can execute only long trades.
Unique Features
Trailing Profit System: Strategy uses user given number of ATR to activate trailing take profit. If price has already reached the trailing profit activation level, scrip will close long trade if price closes below Bollinger Bands middle line.
Configurable Trading Periods: Users can tailor the strategy to specific market windows, adapting to different market conditions.
Major Trend Filter: Strategy utilizes 100 period EMA to take trades only in the direction of a trend.
Flexible Risk Management: Users can choose number of ATR as a stop loss (by default = 1.75) for trades. This is flexible approach because ATR is recalculated on every candle, therefore stop-loss readjusted to the current volatility.
Methodology
First of all, script checks if currently price is above the 200-period exponential moving average EMA. EMA is used to establish the current trend. Script will take long trades on if this filtering system showing us the uptrend. Then the strategy executes the long trade if candle’s low below the lower Bollinger band. To calculate the middle Bollinger line, we use the standard 20-period simple moving average (SMA), lower band is calculated by the substruction from middle line the standard deviation multiplied by user given value (by default = 2).
When long trade executed, script places stop-loss at the price level below the entry price by user defined number of ATR (by default = 1.75). This stop-loss level recalculates at every candle while trade is open according to the current candle ATR value. Also strategy set the trailing profit activation level at the price above the position average price by user given number of ATR (by default = 2.25). It is also recalculated every candle according to ATR value. When price hit this level script plotted the triangle with the label “Strong Uptrend” and start trail the price at the middle Bollinger line. It also started to be plotted as a green line.
When price close below this trailing level script closes the long trade and search for the next trade opportunity.
Risk Management
The strategy employs a combined and flexible approach to risk management:
It allows positions to ride the trend as long as the price continues to move favorably, aiming to capture significant price movements. It features a user-defined ATR stop loss parameter to mitigate risks based on individual risk tolerance. By default, this stop-loss is set to a 1.75*ATR drop from the entry point, but it can be adjusted according to the trader's preferences.
There is no fixed take profit, but strategy allows user to define user the ATR trailing profit activation parameter. By default, this stop-loss is set to a 2.25*ATR growth from the entry point, but it can be adjusted according to the trader's preferences.
Justification of Methodology
This strategy leverages Bollinger bangs indicator to open long trades in the local dips. If price reached the lower band there is a high probability of bounce. Here is an issue: during the strong downtrend price can constantly goes down without any significant correction. That’s why we decided to use 200-period EMA as a trend filter to increase the probability of opening long trades during major uptrend only.
Usually, Bollinger Bands indicator is using for mean reversion or breakout strategies. Both of them have the disadvantages. The mean reversion buys the dip, but closes on the return to some mean value. Therefore, it usually misses the major trend moves. The breakout strategies usually have the issue with too high buy price because to have the breakout confirmation price shall break some price level. Therefore, in such strategies traders need to set the large stop-loss, which decreases potential reward to risk ratio.
In this strategy we are trying to combine the best features of both types of strategies. Script utilizes ate ATR to setup the stop-loss and trailing profit activation levels. ATR takes into account the current volatility. Therefore, when we setup stop-loss with the user-given number of ATR we increase the probability to decrease the number of false stop outs. The trailing profit concept is trying to add the beat feature from breakout strategies and increase probability to stay in trade while uptrend is developing. When price hit the trailing profit activation level, script started to trail the price with middle line if Bollinger bands indicator. Only when candle closes below the middle line script closes the long trade.
Backtest Results
Operating window: Date range of backtests is 2020.10.01 - 2024.07.01. It is chosen to let the strategy to close all opened positions.
Commission and Slippage: Includes a standard Binance commission of 0.1% and accounts for possible slippage over 5 ticks.
Initial capital: 10000 USDT
Percent of capital used in every trade: 30%
Maximum Single Position Loss: -9.78%
Maximum Single Profit: +25.62%
Net Profit: +6778.11 USDT (+67.78%)
Total Trades: 111 (48.65% win rate)
Profit Factor: 2.065
Maximum Accumulated Loss: 853.56 USDT (-6.60%)
Average Profit per Trade: 61.06 USDT (+1.62%)
Average Trade Duration: 76 hours
These results are obtained with realistic parameters representing trading conditions observed at major exchanges such as Binance and with realistic trading portfolio usage parameters.
How to Use
Add the script to favorites for easy access.
Apply to the desired timeframe and chart (optimal performance observed on 4h BTC/USDT).
Configure settings using the dropdown choice list in the built-in menu.
Set up alerts to automate strategy positions through web hook with the text: {{strategy.order.alert_message}}
Disclaimer:
Educational and informational tool reflecting Skyrex commitment to informed trading. Past performance does not guarantee future results. Test strategies in a simulated environment before live implementation

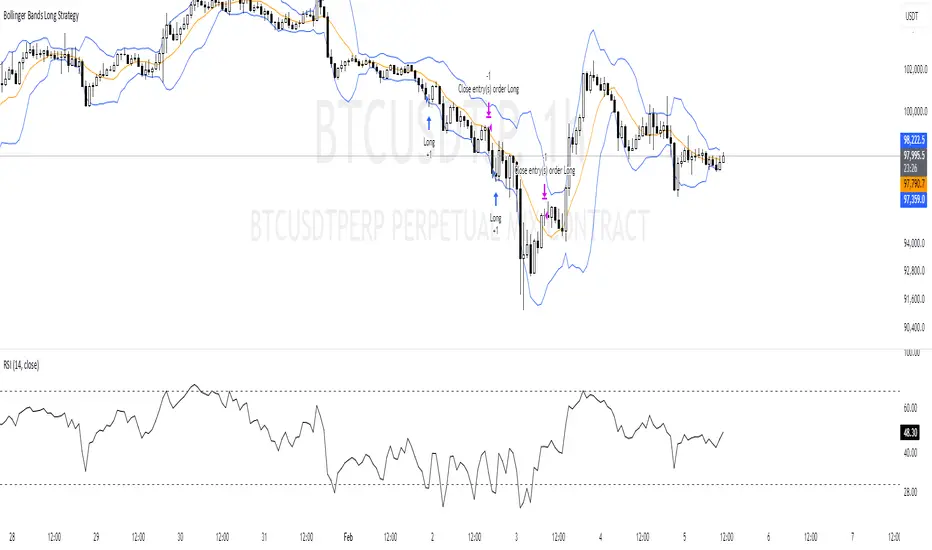
Bollinger Bands Long Strategy
This strategy is designed for identifying and executing long trades based on Bollinger Bands and RSI. It aims to capitalize on potential oversold conditions and subsequent price recovery.
Key Features:
- Bollinger Bands (10,2): The strategy uses Bollinger Bands with a 10-period moving average and a multiplier of 2 to define price volatility.
- RSI Filter: A trade is only triggered when the RSI (14-period) is below 30, ensuring entry during oversold conditions.
- Entry Condition: A long trade is entered immediately when the price crosses below the lower Bollinger Band and the RSI is under 30.
- Exit Condition: The position is exited when the price reaches or crosses above the Bollinger Band basis (20-period moving average).
Best Used For:
- Identifying oversold conditions with a strong potential for a rebound.
- Markets or assets with clear oscillations and volatility e.g., BTC.
**Disclaimer:** This strategy is for educational purposes and should be used with caution. Backtesting and risk management are essential before live trading.
Ichimoku Cloud and Bollinger Bands (by Coinrule)The Ichimoku Cloud is a collection of technical indicators that show support and resistance levels, as well as momentum and trend direction. It does this by taking multiple averages and plotting them on a chart. It also uses these figures to compute a “cloud” that attempts to forecast where the price may find support or resistance in the future.
The Ichimoku Cloud was developed by Goichi Hosoda, a Japanese journalist, and published in the late 1960s. It provides more data points than the standard candlestick chart. While it seems complicated at first glance, those familiar with how to read the charts often find it easy to understand with well-defined trading signals.
The Ichimoku Cloud is composed of five lines or calculations, two of which comprise a cloud where the difference between the two lines is shaded in.
The lines include a nine-period average, a 26-period average, an average of those two averages, a 52-period average, and a lagging closing price line.
The cloud is a key part of the indicator. When the price is below the cloud, the trend is down. When the price is above the cloud, the trend is up.
The above trend signals are strengthened if the cloud is moving in the same direction as the price. For example, during an uptrend, the top of the cloud is moving up, or during a downtrend, the bottom of the cloud is moving down.
The Bollinger Bands are among the most famous and widely used indicators. A Bollinger Band is a technical analysis tool defined by a set of trendlines plotted two standard deviations (positively and negatively) away from a simple moving average ( SMA ) of a security's price, but which can be adjusted to user preferences. They can suggest when an asset is oversold or overbought in the short term, thus providing the best time for buying and selling it.
This strategy combines the Ichimoku Cloud with Bollinger Bands to better enter trades.
Long orders are placed when these basic signals are triggered.
Long Position:
Tenkan-Sen is above the Kijun-Sen
Chikou-Span is above the close of 26 bars ago
Close is above the Kumo Cloud
The closing price is greater than the upper standard deviation of the Bollinger Bands
Short Position:
Tenkan-Sen is below the Kijun-Sen
Chikou-Span is below the close of 26 bars ago
Close is below the Kumo Cloud
The upper standard deviation of the Bollinger Band is greater than the closing price
The script is backtested from 1 January 2022 and provides good returns.
The strategy assumes each order is using 30% of the available coins to make the results more realistic and to simulate you only ran this strategy on 30% of your holdings. A trading fee of 0.1% is also taken into account and is aligned to the base fee applied on Binance.
This script also works well on BTC 30m/1h, ETH 2h, MATIC 2h/30m, AVAX 1h/2h, SOL 45m timeframes

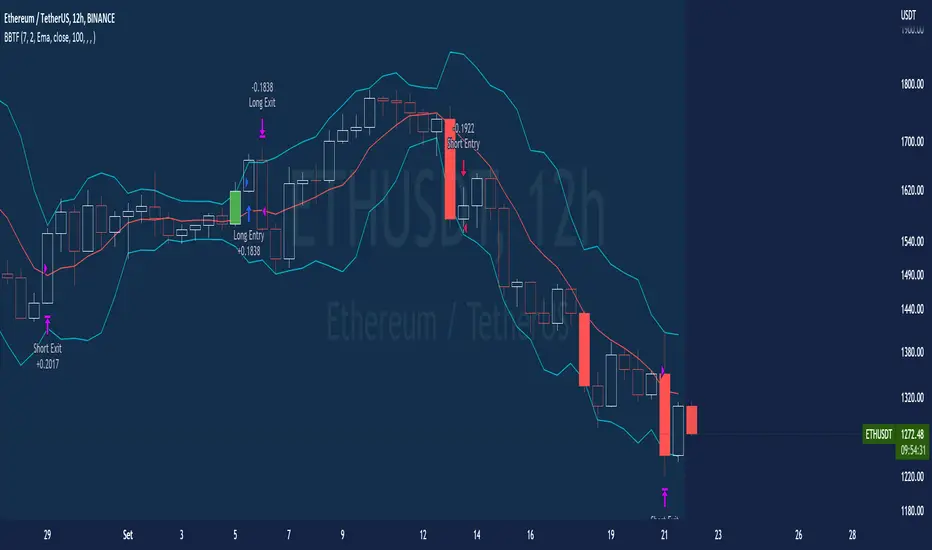
BT-Bollinger Bands - Trend FollowingEsse script foi criado para estudo de Backtest.
O script usa as Bandas de Bollinger para indicar o início de uma tendência, a entrada é configurada quando o preço abre abaixo e fecha acima da banda superior ou para venda quando o preço abre acima e fecha abaixo da banda inferior.
Não há um stop fixo e nem alvo fixo a saída se dá quando o preço toca a média da banda.
Você pode usar uma média móvel como filtro combinado com a estratégia.
O Script também pode ser usado com algum serviço de bot como 3commas.io , basta colocar as mensagens de entrada e saída para o bot.
Autor : Credsonb - Nick: M4TR1X_BR
Neste gráfico estou usando as seguintes configurações:
Bandas Bollinger: 7
Desvio Padrão: 1.5
Time Frame: 12hs
Ticker: ETH
This script was created for Backtest study.
script uses Bollinger Bands to indicate the start of a trend, entry is set when price opens below and closes above the upper band or for short when price opens above and closes below the lower band.
There is no fixed stop and no fixed target, the exit occurs when the price touches the average of the band.
You can use a moving average as a filter combined with the strategy.
The Script can also be used with some bot service like 3commas. io , just put the input and output messages to the bot.
Author : Credsonb - Nick: M4TR1X_BR
Bollinger Bands + EMA 9A 1 minute scalping strategy.
Uses Bollinger Bands (no basis line) and a 9 period EMA.
Waits for price to close below the lower Bollinger Band and the next candle to close bullish above the lower Bollinger Band but below the 9 Period EMA.
If all conditions are met, the script enters a long position with TP at the 9 Period EMA.

Steven Primo's bollinger bands strategyHi, this strategy is taken from a video made by Steven Primo. You can look it up on YouTube if you want to know about it.
It is a mean-reversion strategy based on the Bollinger Bands, in which we wait for 5 consecutive closes above the upper band, and for a short-term top. Once it happens, we place an entry order on this top, with a stop at the nearest bottom before the movement started, and use the difference from the stop and entry point to determine the target. For shorting, it's the same process, but for the downside. From my testing, only long orders were profitable, but you can configure whichever you want.
It works well for directional markets with a low level of noise, as you can see with the BTCUSD chart. One of its caveats is the short number of occurrences, and the long stop loss and target. You can enable a trailing stop, but from my testings, it just made the results worse.
I made some modifications, like removing the MA requirement, since the entry point was above it almost all the time, and I forced the BB to use a log version of the prices, so that discrepancies are eliminated. You'll also notice that you can't select an extension that is lower than 100, and that is intentional, since you're not supposed to enter a trade in which you can lose more than what you can earn.
I chose not to implement any kind of risk management, but I might do that in the future. You can leave your suggestions in the comments.

Combo Backtest 123 Reversal & High Low Bands This is combo strategies for get a cumulative signal.
First strategy
This System was created from the Book "How I Tripled My Money In The
Futures Market" by Ulf Jensen, Page 183. This is reverse type of strategies.
The strategy buys at market, if close price is higher than the previous close
during 2 days and the meaning of 9-days Stochastic Slow Oscillator is lower than 50.
The strategy sells at market, if close price is lower than the previous close price
during 2 days and the meaning of 9-days Stochastic Fast Oscillator is higher than 50.
Second strategy
As the name suggests, High low bands are two bands surrounding the underlying’s
price. These bands are generated from the triangular moving averages calculated
from the underlying’s price. The triangular moving average is, in turn, shifted
up and down by a fixed percentage. The bands, thus formed, are termed as High
low bands. The main theme and concept of High low bands is based upon the triangular
moving average.
WARNING:
- For purpose educate only
- This script to change bars colors.

Mean Reversion w/ Bollinger BandsThis is a more advanced version of my original mean reversion script.
It employs the famous Bollinger Bands.
This robot will buy when price falls below the lower Bollinger Band, and sell when price moves above the upper Bollinger Band.
I've only tested it on the S&P 500, though you could try it out on other assets to see the backtest performance.
During the recent COVID-19 bear market drop, it produced several buy signals on the S&P which I followed, and made some nice gains so far.
I still think this would make a better investing strategy (buy undervalued / sell over-valued), rather than a trading strategy.
I use this robot for my long term portfolio.

Bollinger Bands SMA 20_2 StrategyMean reversion strategy using Bollinger Bands (20-period SMA with 2.0 standard deviation bands).
Trade Triggers:
🟢 BUY SIGNAL:
When: Price crosses above the lower Bollinger Band
Logic: Price has hit oversold territory and is bouncing back
Action: Places a long position with stop at the lower band
🔴 SELL SIGNAL:
When: Price crosses below the upper Bollinger Band
Logic: Price has hit overbought territory and is pulling back
Action: Places a short position with stop at the upper band
Combo Backtest 123 Reversal & Fractal Chaos Bands This is combo strategies for get a cumulative signal.
First strategy
This System was created from the Book "How I Tripled My Money In The
Futures Market" by Ulf Jensen, Page 183. This is reverse type of strategies.
The strategy buys at market, if close price is higher than the previous close
during 2 days and the meaning of 9-days Stochastic Slow Oscillator is lower than 50.
The strategy sells at market, if close price is lower than the previous close price
during 2 days and the meaning of 9-days Stochastic Fast Oscillator is higher than 50.
Second strategy
Stock market moves in a highly chaotic way, but at a larger scale, the movements
follow a certain pattern that can be applied to shorter or longer periods of time
and we can use Fractal Chaos Bands Indicator to identify those patterns. Basically,
the Fractal Chaos Bands Indicator helps us to identify whether the stock market is
trending or not. When a market is trending, the bands will have a slope and if market
is not trending the bands will flatten out. As the slope of the bands decreases, it
signifies that the market is choppy, insecure and variable. As the graph becomes more
and more abrupt, be it going up or down, the significance is that the market becomes
trendy, or stable. Fractal Chaos Bands Indicator is used similarly to other bands-indicator
(Bollinger bands for instance), offering trading opportunities when price moves above or
under the fractal lines.
The FCB indicator looks back in time depending on the number of time periods trader selected
to plot the indicator. The upper fractal line is made by plotting stock price highs and the
lower fractal line is made by plotting stock price lows. Essentially, the Fractal Chaos Bands
show an overall panorama of the price movement, as they filter out the insignificant fluctuations
of the stock price.
WARNING:
- For purpose educate only
- This script to change bars colors.
