Time of Day - Volatility Report█ OVERVIEW
The indicator analyses the volatility and reports statistics by the time of day.
█ CONCEPTS
Around the world and at various times, different market participants get involved in the markets. How does this affect the market?
Knowing this gets you better prepared and improves your trading. Here are some ideas to explore:
When is the market busy and quiet?
What time is it the most volatile?
Which pairs in your watchlist are moving while you are actively trading?
Should you adjust your trading time? Should you change your trading pairs?
When does your strategy perform the best?
What entry times do your winners have in common? What about the exit times of your losers?
Is it worth keeping your trade open overnight?
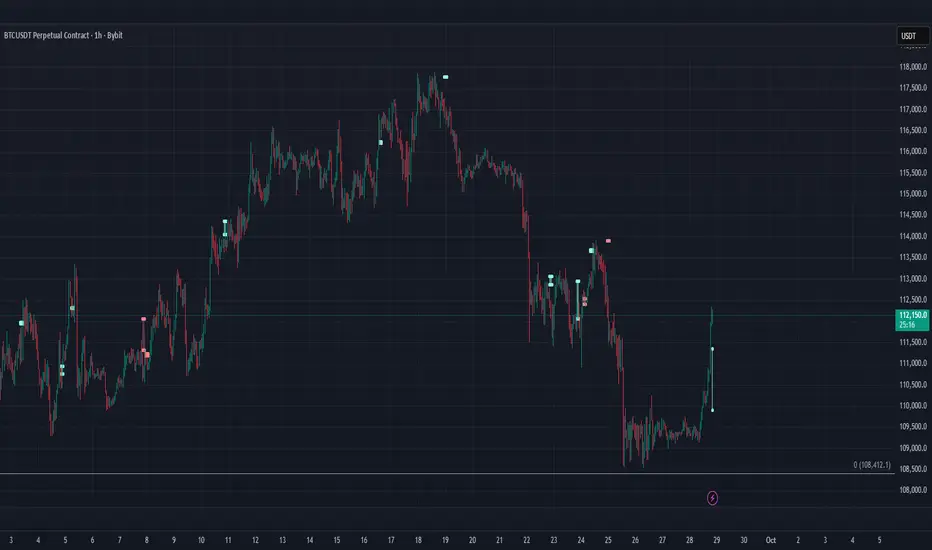
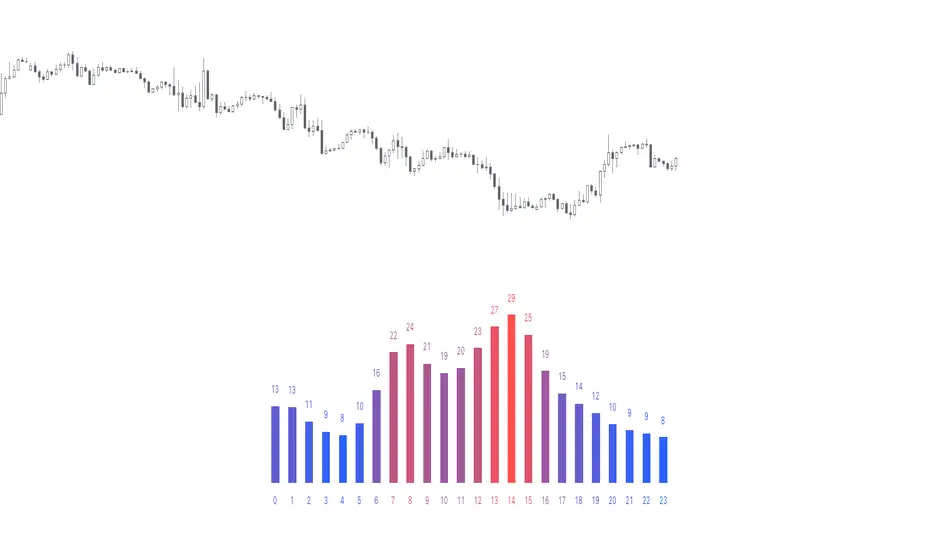
Bitcoin (UTC+0)
Gold (UTC+0)
Tesla, Inc. (UTC+0)
█ FEATURES
Selectable time zones
Display the statistics in your geographical time zone (or other market participants), the exchange time zone, or UTC+0.
Configurable outputs
Output the report statistics as mean or median.
█ HOW TO USE
Plot the indicator and visit the 1H timeframe.
█ NOTES
Gaps
The indicator includes the volatility from gaps.
Calculation
The statistics are not reported from absolute prices (does not favor trending markets) nor percentage prices (does not depict the different periods of volatility that markets can go through). Instead, the script uses the prices relative to the average range of previous days (daily ATR).
Extended trading session
The script analyses extended hours when activated on the chart.
Daylight Saving Time (DST)
The exchange time or geographical time zone selected may observe Daylight Saving Time. For example, NASDAQ:TSLA always opens at 9:30 AM New York time but may see different opening times in another part of the globe (New York time corresponds to UTC-4 and UTC-5 during the year).
Search in scripts for "gaps"
Liquidity Hunter - FattyTradesThis indicator is used to automatically identify and plot two forms of liquidity that will be targeted by market makers.
The first form of liquidity is based on multi-time fame highs and lows. It plots 1H, 4H, D, W, & M liquidity on an intraday chart to make it easier to identify. I believe hat liquidity is what drives the market and the most common form of this liquidity can be identified through higher time frame highs and lows. You can use whatever method you prefer to determine which liquidity pool will be targeted. When the liquidity is purged, it will be shown as dotted lines. This should not be used as traditional support/resistance, but rather as targets for the market.
The second form of liquidity is in the form of imbalances or fair value gaps. You can select a higher time frame to be plotted along with the current time frame you're viewing to identify imbalances that will likely be targeted intraday. We know that higher time frame fair value gaps work equally well as targets for market makers. When a higher time frame FVG is broken into, it can also act as a very powerful form of support and resistance. By default, when a fair value gap has been mitigated it will be removed from the chart, however this can be disabled.
Between these two forms of market maker liquidity targets on the chart, it will be easier to formulate a thesis intraday to determine where the market will move. It can help minimize the amount of switching between higher time frames that needs to be done, allowing you to identify targets while trading on your favorite intraday time frame for optimal risk/reward.
In the near future, I will build in alerting mechanism to alert when liquidity on higher time frames as been purged/mitigated.

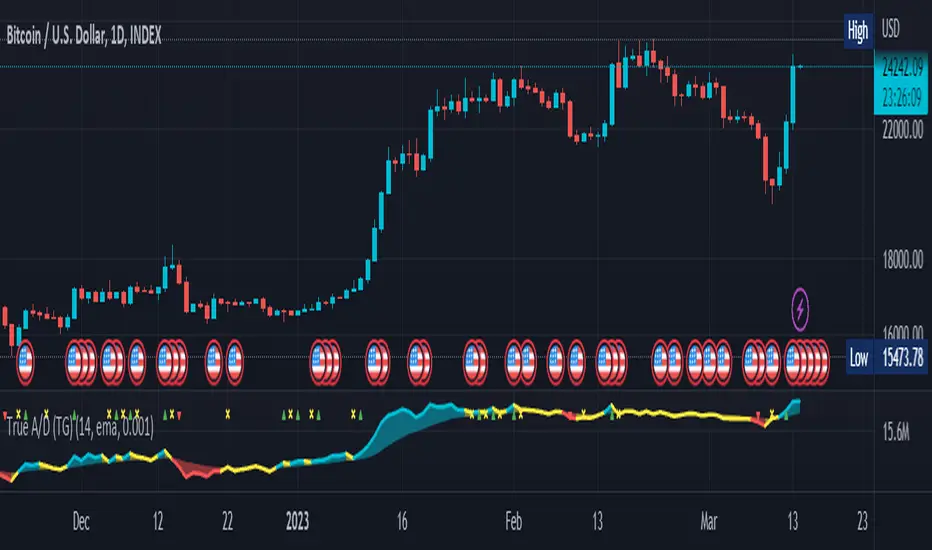
True Accumulation/Distribution (TG fork)An accumulation/distribution indicator that works better against gaps and with trend coloring.
Accumulation/Distribution was developed by Marc Chaikin to provide insight into strength of a trend by measuring flow of buy and sell volume .
The fact that A/D only factors current period's range for calculating the volume multiplier causes problem with price gaps. They are ignored or even misinterpreted.
True Accumulation/Distribution solves the problem by using True Range instead of only relying on current period's high and low.
Most of the time, True A/D reverts to producing the same values as the original A/D. The difference between True A/D and original A/D can be better seen when a gap has occurred, True A/D has handles it better than Accumulation/Distribution which a bearish close in period's range cause it to misinterpret the strong buy pressure as sell volume
The Moving Average Cloud is simply the filling between the moving average and the True A/D. This feature was inspired by D7R ACC/DIST closed-source indicator, kudos to D7R for making such neat visual indicators (but unfortunately all closed source!).
This indicator was made to extend the original work by adding MTF support and a moving average cloud and coloring.
If you like this indicator, please show the original author RezzaHmt some love:
OHLC Volatility Estimators by @Xel_arjonaDISCLAIMER:
The Following indicator/code IS NOT intended to be a formal investment advice or recommendation by the author, nor should be construed as such. Users will be fully responsible by their use regarding their own trading vehicles/assets.
The embedded code and ideas within this work are FREELY AND PUBLICLY available on the Web for NON LUCRATIVE ACTIVITIES and must remain as is by Creative-Commons as TradingView's regulations. Any use, copy or re-use of this code should mention it's origin as it's authorship.
WARNING NOTICE!
THE INCLUDED FUNCTION MUST BE CONSIDERED AS DEBUGING CODE The models included in the function have been taken from openly sources on the web so they could have some errors as in the calculation scheme and/or in it's programatic scheme. Debugging are welcome.
WHAT'S THIS?
Here's a full collection of candle based (compressed tick) Volatility Estimators given as a function, openly available for free, it can print IMPLIED VOLATILITY by an external symbol ticker like INDEX:VIX.
Models included in the volatility calculation function:
CLOSE TO CLOSE: This is the classic estimator by rule, sometimes referred as HISTORICAL VOLATILITY and is the must common, accepted and widely used out there. Is based on traditional Standard Deviation method derived from the logarithm return of current close from yesterday's.
ELASTIC WEIGHTED MOVING AVERAGE: This estimator has been used by RiskMetriks®. It's calculation is based on an ElasticWeightedMovingAverage Standard Deviation method derived from the logarithm return of current close from yesterday's. It can be viewed or named as an EXPONENTIAL HISTORICAL VOLATILITY model.
PARKINSON'S: The Parkinson number, or High Low Range Volatility, developed by the physicist, Michael Parkinson, in 1980 aims to estimate the Volatility of returns for a random walk using the high and low in any particular period. IVolatility.com calculates daily Parkinson values. Prices are observed on a fixed time interval. n=10, 20, 30, 60, 90, 120, 150, 180 days.
ROGERS-SATCHELL: The Rogers-Satchell function is a volatility estimator that outperforms other estimators when the underlying follows a Geometric Brownian Motion (GBM) with a drift (historical data mean returns different from zero). As a result, it provides a better volatility estimation when the underlying is trending. However, this Rogers-Satchell estimator does not account for jumps in price (Gaps). It assumes no opening jump. The function uses the open, close, high, and low price series in its calculation and it has only one parameter, which is the period to use to estimate the volatility.
YANG-ZHANG: Yang and Zhang were the first to derive an historical volatility estimator that has a minimum estimation error, is independent of the drift, and independent of opening gaps. This estimator is maximally 14 times more efficient than the close-to-close estimator.
LOGARITHMIC GARMAN-KLASS: The former is a pinescript transcript of the model defined as in iVolatility . The metric used is a combination of the overnight, high/low and open/close range. Such a volatility metric is a more efficient measure of the degree of volatility during a given day. This metric is always positive.

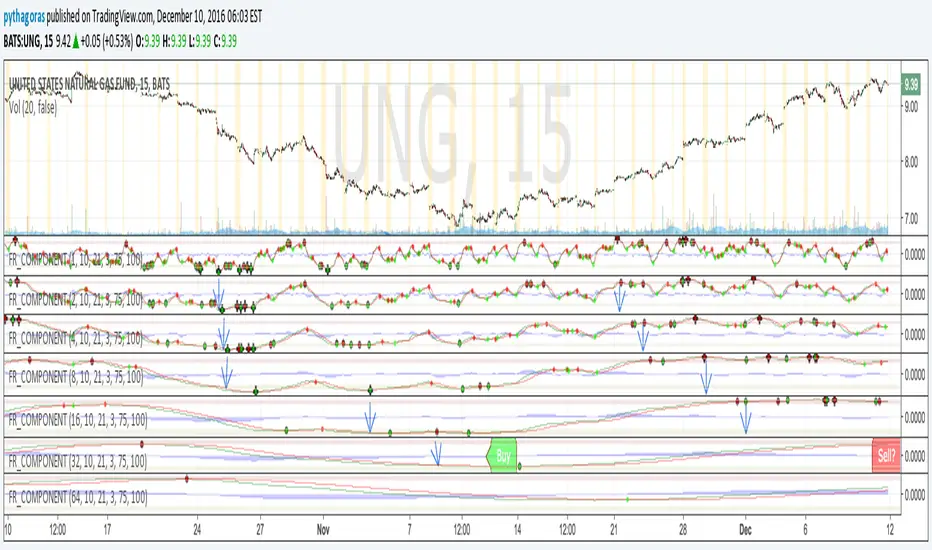
Fractal Resonance ComponentLazyBear's WaveTrend port has been praised for highlighting trend reversals with precision and punctuality (minimal lag). But strong "3rd Wave" trends can "embed" or saturate any oscillator flashing several premature crosses while stuck overbought/oversold. This happens when the trend stretches over a longer timescale than the oscillator's averaging window or filter time constant. Our solution: simultaneously monitor many oscillator timescales. Watch for fresh crossovers in "dominant" timescales alternating most smoothly between the overbought (red shade) and oversold (green shade) range.
Fractal Resonance Component facilitates simultaneous viewing of eight timescales that are power of 2 multiples of the chart timescale. Each timescale shows lead line, lag line, lead-lag difference, and crossover marks. Add 4 to 8 copies to your chart for a good multi-fractal read. Format * the "Timescale Multiplier" attribute of each row to be twice that of the row above for a sequence like 1, 2, 4, 8, 16, 32, 64, 128...
Fractal Resonance Component shifts its timescales along with your choice of main chart timescale:
1 minute chart: 1 minute through 128 minute (~2 hour) oscillators.
1 hour chart: 1 hour through 128 hour (~2 week) oscillators.
Daily chart: 1 day through 128 day (~4 month) oscillators.
Crossovers in different oscillator ranges tend to have different meanings:
Minor (< 75%) crossovers: small green/red dot
usually noise
Overbought/Sold crossovers (shaded 75 to 100%): black outlined dot (o)
reliable reversal indicators (when they appear alone)
Extreme Overbought (> 100%) crossovers: black outlined plus (+).
Can be a major reversal in fast markets, but usually portend the end of Elliot 3rd waves with just a small corrective (4th wave) retrace before the larger impulsive (5-wave) sequence resumes in original direction.
The final 5th-wave terminus should appear later as a lone non-extreme (black outlined circle) crossover on a slower timescale coincident with weaker (non-extreme) dot crosses on this timescale.
Careful examination of historical charts leads to many useful observations such as:
Dominant crossovers punctuating true reversals are usually in the green/red shaded ranges with black outlined dots (o) rather than minor or Extreme (+) ranges.
Due to market's fractal nature, two well-separated timescales like 1 minute and 1 hour can show dominant crosses simultaneously in opposite directions, e.g. the 1 minute showing a very short term high and the 1 hour a medium term low nearby.
Staying Nimble
Watch out for embedding on your supposedly dominant timescale -- a second cross while stuck in the overbought/oversold region suggests a stronger, longer trend than expected. Drop your eyes to a slower timescale below for the real dominant whose crossover will validate main trend reversal.
Embedding can often be predicted even at the first cross mark by checking whether the green lead line of the next slower timescale (one row below) has already hit the Overbought or especially the Extreme Overbought range but isn't close to rolling over. Fractal Resonance Bar (to be published) uses this principle to mark embedded timescales with white stripes, warning of a powerful trend wave on longer timescales you shouldn't fight until the white stripes subside.
Overnight gaps surge all timescales in ways that obscure the dominant timescale, so for shorter than daily charts, these methods work best on Futures contracts that only suffer weekend gaps.
ARO Pro — Adaptive Regime OscillatorARO Pro — Adaptive Regime Oscillator (v6)
ARO Pro turns your chart into a context-aware decision system. It classifies every bar as Trending (up or down) or Ranging in real time, then switches its math to match the regime: trend strength is measured with an ATR-normalized EMA spread, while range behavior is tracked with a center-based RSI oscillator. The result is cleaner entries, fewer false signals, and faster reads on regime shifts—without repainting.
⸻
How it works (under the hood)
1. Regime Detection (Kaufman ER):
ARO computes Kaufman’s Efficiency Ratio (ER) over a user-defined length.
- ER > threshold → Trending (direction from EMA fast vs. EMA slow)
- ER ≤ threshold → Ranging
2. Adaptive Oscillator Core:
- Trend mode: (EMA(fast) − EMA(slow)) / ATR * 100 → momentum normalized by volatility.
- Range mode: RSI(length) − 50 → mean-reversion pressure around zero.
3. Volatility Filter (optional):
Blocks signals if ATR as % of price is below a floor you set. This reduces noise in thin or quiet markets.
4. MTF Trend Filter (optional & non-repainting):
Confirms signals only if a higher timeframe EMA(fast) > EMA(slow) for longs (or < for shorts). Implemented with lookahead_off and gaps_on.
5. Confirmation & Alerts:
Signals are locked only on bar close (barstate.isconfirmed) and offered via three alert types: ARO Long, ARO Short, ARO Regime Shift.
⸻
What you see on the chart
• Background heat:
• Green = Trending Up, Red = Trending Down, Gray = Range.
• ARO line (panel): Adaptive oscillator (trend/value colors).
• Signal markers: ▲ Long / ▼ Short on confirmed bars.
• Guide lines: Upper/Lower thresholds (±K) and zero line.
• Info Panel (table): Regime, ER, ATR %, ARO, HTF status (OK/BLOCK/OFF), and a Confidence light.
• Debug Overlay (optional): Quick view of thresholds and raw conditions for tuning.
⸻
Inputs (quick reference)
• Signals: Fast/Slow EMA, RSI length, ER length & threshold, oscillator smoothing, signal threshold.
• Filters: ATR length, minimum ATR% (volatility floor), toggle for volatility filter.
• Visuals: Background on/off, Info Panel on/off, Debug overlay on/off.
• MTF (safe): Toggle + HTF timeframe (e.g., 240, D, W).
⸻
Interpreting signals
• Long: Trend regime AND fast EMA > slow EMA AND ARO ≥ +threshold (confirmed bar, filters passing).
• Short: Trend regime AND fast EMA < slow EMA AND ARO ≤ −threshold (confirmed bar, filters passing).
• Regime Shift: Alert when ER moves the market from Range → Trend or flips trend direction.
⸻
Practical use cases & examples
1) Intraday momentum alignment (scalps to day trades)
• Timeframes: 5–15m with HTF filter = 4H.
• Flow:
1. Wait for Trend Up background + HTF OK.
2. Enter on ▲ Long when ARO crosses above +threshold.
3. Stops: 1–1.5× ATR(14) below trigger bar or below last micro swing.
4. Exits: Partial at 1× ATR, trail remainder with an ATR stop or when ARO reverts to zero/Regime Shift.
• Why it works: You’re trading with the dominant higher-timeframe structure while avoiding low-volatility fakeouts.
2) Swing trend following (cleaner trend legs)
• Timeframes: 1H–4H with HTF filter = 1D.
• Flow:
1. Only act in Trend background aligned with HTF.
2. Add on subsequent ▲ signals as ARO maintains positive (or negative) territory.
3. Reduce or exit on Regime Shift (Trend → Range or direction flip) or when ARO crosses back through zero.
• Stops/targets: Initial 1.5–2× ATR; move to breakeven once the trade gains 1× ATR; trail with a multiple-ATR or structure lows/highs.
3) Range tactics (fade the extremes)
• Timeframes: 15m–1H or 1D on mean-reverting names.
• Flow:
1. Act only when background = Range.
2. Fade moves when ARO swings from ±extremes back toward zero near well-defined S/R.
3. Exit at the opposite band or zero line; abort if a Regime Shift to Trend occurs.
• Tip: Increase ER threshold (e.g., 0.35–0.40) to label more bars as Range on choppy instruments.
4) Event days & macro filters
• Approach: Raise the volatility floor (Min ATR%) on macro days (FOMC, CPI).
• Effect: You’ll ignore “fake” micro swings in the minutes leading up to releases and catch only post-event confirmed momentum.
⸻
Parameter tuning guide
• ER Threshold:
• Lower (0.20–0.30) = more Trend bars, more signals, higher noise.
• Higher (0.35–0.45) = stricter trend confirmation, fewer but cleaner signals.
• Signal Threshold (±K):
• Raise to reduce whipsaws; lower for earlier but noisier triggers.
• Volatility Floor (ATR%):
• Thin/quiet assets benefit from a higher floor (e.g., 0.3–0.6).
• Highly liquid futures/forex can work with lower floors.
• HTF Filter:
• Keep it ON when you want higher win consistency; turn OFF for tactical counter-trend plays.
⸻
Alerts (recommended setup)
• “ARO Long” / “ARO Short”: Entry-style alerts on confirmed signals.
• “ARO Regime Shift”: Context alert to scale in/out or switch playbooks (trend vs. range).
All alerts are non-repainting and fire only when the bar closes.
⸻
Best practices & combinations
• Price action & S/R: Use ARO to define when to engage, and price structure to define where (breakout levels, pullback zones).
• VWAP/Session tools: In intraday trends, ▲ signals above VWAP tend to carry; avoid shorts below session VWAP in strong downtrends.
• Risk first: Size by ATR; never let a single ARO event override your max risk per trade.
• Portfolio filter: On indices/ETFs, enable HTF filter and a stricter ER threshold to ride regime legs.
⸻
Non-repaint and implementation notes
• The script does not repaint:
• Signals are computed and locked on bar close (barstate.isconfirmed).
• All higher-timeframe data uses request.security(..., lookahead_off, gaps_on).
• No future indexing or negative offsets are used.
• The Info Panel and Debug overlay are purely visual aids and do not change signal logic.
⸻
Limitations & tips
• Chop sensitivity: In hyper-choppy symbols, consider raising ER threshold and the signal threshold, and enable HTF filter.
• Instrument personality: EMAs/RSI lengths and volatility floor often need a quick 2–3 minute tune per asset class (FX vs. crypto vs. equities).
• No guarantees: ARO improves context and timing, but it is not a promise of profitability—always combine with risk management.
⸻
Quick start (TL;DR)
1. Timeframes: 5–15m intraday (HTF = 4H); 1H–4H swing (HTF = 1D).
2. Use defaults, then tune ER threshold (0.25–0.40) and Signal threshold (±20).
3. Enable Volatility Floor (e.g., 0.2–0.5 ATR%) on quiet assets.
4. Trade ▲ / ▼ only in matching Trend background; fade extremes only in Range background.
5. Set alerts for Long, Short, and Regime Shift; manage risk with ATR stops.
⸻
Author’s note: ARO Pro is designed to be clear, adaptive, and operational out of the box. If you publish variants (e.g., different ER logic, alternative trend cores), please credit the original and document any changes so users can compare behavior reliably.

ETH to RTH Gap DetectorETH to RTH Gap Detector
What It Does
This indicator identifies and tracks custom-defined gaps that form between Extended Trading Hours (ETH) and Regular Trading Hours (RTH). Unlike traditional gap definitions, this indicator uses a specialized approach - defining up gaps as the space between previous session close high to current session initial balance low, and down gaps as the space from previous session close low to current session initial balance high. Each detected gap is monitored until it's touched by price.
Key Features
Detects custom-defined ETH-RTH gaps based on previous session close and current session initial balance
Automatically identifies both up gaps and down gaps
Visualizes gaps with color-coded boxes that extend until touched
Tracks when gaps are filled (when price touches the gap area)
Offers multiple display options for filled gaps (color change, border only, pattern, or delete)
Provides comprehensive statistics including total gaps, up/down ratio, and touched gap percentage
Includes customizable alert system for real-time gap filling notifications
Features toggle options for dashboard visibility and weekend sessions
Uses time-based box coordinates to avoid common TradingView drawing limitations
How To Use It
Configure Session Times : Set your preferred RTH hours and timezone (default 9:30-16:00 America/New York)
Set Initial Balance Period : Adjust the initial balance period (default 30 minutes) for gap detection sensitivity
Monitor Gap Formation : The indicator automatically detects gaps between the previous session close and current session IB
Watch For Gap Fills : Gaps change appearance or disappear when price touches them, based on your selected style
Check Statistics : View the dashboard to see total gaps, directional distribution, and touched percentage
Set Alerts : Enable alerts to receive notifications when gaps are filled
Settings Guide
RTH Settings : Configure the start/end times and timezone for Regular Trading Hours
Initial Balance Period : Controls how many minutes after market open to calculate the initial balance (1-240 minutes)
Display Settings : Toggle gap boxes, extension behavior, and dashboard visibility
Filled Box Style : Choose how filled gaps appear - Filled (color change), Border Only, Pattern, or Delete
Color Settings : Customize colors for up gaps, down gaps, and filled gaps
Alert Settings : Control when and how alerts are triggered for gap fills
Weekend Session Toggle : Option to include or exclude weekend trading sessions
Technical Details
The indicator uses time-based coordinates (xloc.bar_time) to prevent "bar index too far" errors
Gap boxes are intelligently limited to avoid TradingView's 500-bar drawing limitation
Box creation and fill detection use proper range intersection logic for accuracy
Session detection is handled using TradingView's session string format for reliability
Initial balance detection is precisely calculated based on time difference
Statistics calculations exclude zero-division scenarios for stability
This indicator works best on futures markets with extended and regular trading hours, especially indices (ES, NQ, RTY) and commodities. Performs well on timeframes from 1-minute to 1-hour.
What Makes It Different
Most gap indicators focus on traditional open-to-previous-close gaps, but this tool offers a specialized definition more relevant to ETH/RTH transitions. By using the initial balance period to define gap edges, it captures meaningful price discrepancies that often provide trading opportunities. The indicator combines sophisticated gap detection logic with clean visualization and comprehensive tracking statistics. The customizable fill styles and integrated alert system make it practical for both chart analysis and active trading scenarios.

MTF OB & FVG detector w/ Alerts v2# MTF Order Blocks & Fair Value Gaps Detector with Alerts v2
## Overview
This indicator combines **Multi-Timeframe Order Blocks (OB)** and **Fair Value Gaps (FVG)** detection with integrated bounce alerts. It displays Order Blocks and Fair Value Gaps across multiple timeframes simultaneously and generates real-time alerts when price bounces from these critical zones.
## Key Features
### 🎯 Multi-Timeframe Order Blocks Detection
- **Volumetric Analysis**: Each Order Block displays total volume and dominant side percentage
- **Multiple Timeframes**: Supports 1min, 3min, 5min, 15min, and 60min timeframes
- **Smart Combining**: Automatically merges overlapping Order Blocks from different timeframes into powerful confluence zones
- **Dynamic Extension**: Order Blocks extend until broken, providing clear visual guidance
- **Volume Distribution**: Shows bullish vs bearish volume breakdown with percentage
### 📊 Fair Value Gaps (FVG) Detection
- **Lightweight Processing**: Works on current chart timeframe only for optimal performance
- **Volume Metrics**: Displays FVG volume and dominant side percentage
- **Mitigation Tracking**: Automatically tracks when FVGs are filled or broken
- **Customizable Mitigation Source**: Choose between close price or high/low wicks
### 🔔 Comprehensive Alert System
- **Bounce Alerts**: Get notified when price bounces from OB or FVG zones
- **New Formation Alerts**: Alerts when new Order Blocks or Fair Value Gaps form
- **Combined Zone Alerts**: Special alerts when multiple Order Blocks merge into strong confluence zones
- **Customizable Thresholds**: Set minimum number of combined OBs required for strong zone alerts
### 🎨 Visual Customization
- **Inverted Color Schemes**: Optional inverted colors for both OB and FVG
- OB: Choose between traditional (Bullish=Blue, Bearish=Red) or inverted (Bullish=Red, Bearish=Blue)
- FVG: Choose between Bullish=Orange/Bearish=Aqua or inverted
- **Clean Labels**: Shows timeframe, zone type, volume, and dominant percentage
- **Combined Tags**: Optional labels for merged zones
- **Adjustable Extension**: Control how far zones extend into the future
## How It Works
### Order Blocks
Order Blocks identify institutional trading zones where large players have placed significant orders. The indicator:
1. Detects swing highs/lows using configurable swing length
2. Identifies the last opposing candle before a strong move
3. Analyzes volume distribution (bullish vs bearish)
4. Tracks zone validity until price breaks through
5. Combines overlapping zones from multiple timeframes
### Fair Value Gaps
Fair Value Gaps represent price imbalances that often get filled. The indicator:
1. Identifies 3-candle patterns with gaps between candles
2. Filters gaps by size percentile to show only significant ones
3. Calculates volume distribution within the gap
4. Tracks mitigation when price returns to fill the gap
5. Extends gaps dynamically until filled
### Bounce Detection
The indicator detects bounces using a two-step process:
1. **Touch Phase**: Tracks when price enters a zone (touchedInside flag)
2. **Bounce Phase**: Confirms bounce when price exits the zone in the expected direction
- Bullish zones: Price closes above top after touching inside
- Bearish zones: Price closes below bottom after touching inside
## Settings Guide
### General Configuration
- **Show Historic Zones**: Display invalidated/broken zones
- **Zone Invalidation**: Choose between wick or close for break detection
- **Combine Overlapping Order Blocks**: Merge OBs from different timeframes
- **Swing Length**: Controls sensitivity (smaller = more OBs, larger = fewer OBs)
- **Zone Count**: Choose from High/Medium/Low/One per timeframe
- **Invert Colors OB**: Swap bullish/bearish color scheme
### Alert Settings
- **Enable Alerts**: Master switch for all alerts
- **Alert on Bullish/Bearish Bounce**: Choose which bounce directions to monitor
- **Alert on New OB Formation**: Get notified when new Order Blocks form
- **Alert on Combined OBs**: Alerts for strong confluence zones
- **Min OBs for Strong Zone Alert**: Threshold for combined zone alerts (default: 2)
### Fair Value Gaps
- **Show Fair Value Gaps**: Toggle FVG display
- **FVG Mitigation Source**: Choose close or high/low for mitigation detection
- **Bullish/Bearish FVG**: Enable/disable each type
- **Invert FVG Colors**: Swap FVG color scheme
### Multi-Timeframe
- **Show Lower Timeframes**: Display OBs from timeframes lower than chart
- **Individual Timeframe Toggles**: Enable/disable 1min, 3min, 5min, 15min, 60min
### Style
- **Text Color**: Customize label text color
- **Extend Zones**: Set extension length in bars (default: 40)
- **Show Tag**: Display combined indicator in merged zone labels
## Usage Tips
### For Day Trading
- Enable 1min, 3min, and 5min timeframes
- Use "High" zone count for more trading opportunities
- Watch for bounces from combined zones (highest probability)
### For Swing Trading
- Enable 15min, 60min, and higher timeframes
- Use "Medium" or "Low" zone count for major zones only
- Focus on combined zones with 3+ timeframes
### For Scalping
- Use current timeframe only (disable MTF)
- Enable both OB and FVG
- Set up alerts for quick bounce notifications
### Alert Setup
1. Click "Create Alert" in TradingView
2. Choose from available alert conditions:
- **Bullish Bounce (OB/FVG)**: Long entry opportunities
- **Bearish Bounce (OB/FVG)**: Short entry opportunities
- **New OB Formation**: Early zone identification
- **Strong Combined Zone**: High-probability confluence areas
3. Set alert frequency to "Once Per Bar Close" to avoid false signals
## Technical Details
### Performance Optimizations
- Maximum 100 boxes/labels for efficient rendering
- Lightweight FVG processing on current timeframe only
- Dynamic memory management with array size limits
- Selective rendering of active zones only
### Calculations
- **ATR Multiplier**: Zones exceeding 3.5x ATR are filtered out
- **Volume Percentage**: `max(bullVol, bearVol) / totalVolume × 100`
- **FVG Size Filter**: Uses 100th percentile of last 1000 gaps
- **Overlap Detection**: Uses intersection/union ratio for combining zones
## Credits & License
This indicator combines and enhances concepts from:
- "Volumized Order Blocks" methodology
- "Volumatic Fair Value Gaps" approach
**License**: Mozilla Public License 2.0 (MPL-2.0)
## Disclaimer
This indicator is provided for **educational and informational purposes only**. Trading involves substantial risk of loss and is not suitable for every investor. Past performance is not indicative of future results. Always do your own research and consult with a licensed financial advisor before making trading decisions.
## Version History
**v2 (Current)**
- Combined OB and FVG into single indicator
- Added comprehensive alert system
- Improved performance with lightweight FVG processing
- Enhanced bounce detection with touch-inside logic
- Added volume metrics to zone labels
- Implemented dynamic zone extension until broken
- Added combined zone detection with configurable thresholds
---
### Chart Examples
The indicator displays:
- **Red Zones** (Inverted): Bullish Order Blocks / Bearish FVGs
- **Blue Zones** (Inverted): Bearish Order Blocks / Bullish FVGs
- **Orange Zones** (Inverted): Bullish Fair Value Gaps
- **Aqua Zones** (Inverted): Bearish Fair Value Gaps
Each zone shows:
- Timeframe label (e.g., "5m", "15m", "1H")
- Zone type (OB or FVG)
- Total volume in millions (e.g., "12.5M")
- Dominant side percentage (e.g., "85%")
**Example Label**: ` 5m & 15m OB 45.2M (78%)`
- Combined zone from 5min and 15min timeframes
- Order Block type
- 45.2 million total volume
- 78% volume on dominant side
---
## Support & Updates
For issues, suggestions, or questions, please leave a comment on the indicator page.
**Author**: © rasukaru666
**Compatible with**: TradingView Pine Script v6

[TehThomas] - ICT Inversion Fair value Gap (IFVG) The Inversion Fair Value Gap (IFVG) indicator is a powerful tool designed for traders who utilize ICT (Inner Circle Trader) strategies. It focuses on identifying and displaying Inversion Fair Value Gaps, which are critical zones that emerge when traditional Fair Value Gaps (FVGs) are invalidated by price action. These gaps represent key areas where price often reacts, making them essential for identifying potential reversals, trend continuations, and liquidity zones.
What Are Inversion Fair Value Gaps?
Inversion Fair Value Gaps occur when price revisits a traditional FVG and breaks through it, effectively flipping its role in the market. For example:
A bullish FVG that is invalidated becomes a bearish zone, often acting as resistance.
A bearish FVG that is invalidated transforms into a bullish zone, serving as support.
These gaps are significant because they often align with institutional trading activity. They highlight areas where large orders have been executed or where liquidity has been targeted. Understanding these gaps provides traders with a deeper insight into market structure and helps them anticipate future price movements with greater accuracy.
Why This Strategy Works
The IFVG concept is rooted in ICT principles, which emphasize liquidity dynamics, market inefficiencies, and institutional order flow. Traditional FVGs represent imbalances in price action caused by gaps between candles. When these gaps are invalidated, they become inversion zones that can act as magnets for price. These zones frequently serve as high-probability areas for price reversals or trend continuations.
This strategy works because it aligns with how institutional traders operate. Inversion gaps often mark areas of interest for "smart money," making them reliable indicators of potential market turning points. By focusing on these zones, traders can align their strategies with institutional behavior and improve their overall trading edge.
How the Indicator Works
This indicator simplifies the process of identifying and tracking IFVGs by automating their detection and visualization on the chart. It scans the chart in real-time to identify bullish and bearish FVGs that meet user-defined thresholds for inversion. Once identified, these gaps are dynamically displayed on the chart with distinct colors for bullish and bearish zones.
The indicator also tracks whether these gaps are mitigated or broken by price action. When an IFVG is broken, it extends the zone for a user-defined number of bars to visualize its potential role as a new support or resistance level. Additionally, alerts can be enabled to notify traders when new IFVGs form or when existing ones are broken, ensuring timely decision-making in fast-moving markets.
Key Features
Automatic Detection: The indicator automatically identifies bullish and bearish IFVGs based on user-defined thresholds.
Dynamic Visualization: It displays IFVGs directly on the chart with customizable colors for easy differentiation.
Real-Time Updates: The status of each IFVG is updated dynamically based on price action.
Zone Extensions: Broken IFVGs are extended to visualize their potential as support or resistance levels.
Alerts: Notifications can be set up to alert traders when key events occur, such as the formation or breaking of an IFVG.
These features make the tool highly efficient and reduce the need for manual analysis, allowing traders to focus on execution rather than tedious chart work.
Benefits of Using This Indicator
The IFVG indicator offers several advantages that make it an indispensable tool for ICT traders. By automating the detection of inversion gaps, it saves time and reduces errors in analysis. The clearly defined zones improve risk management by providing precise entry points, stop-loss levels, and profit targets based on market structure.
This tool is also highly versatile and adapts seamlessly across different timeframes. Whether you’re scalping lower timeframes or swing trading higher ones, it provides actionable insights tailored to your trading style. Furthermore, by aligning your strategy with institutional logic, you gain a significant edge in anticipating market movements.
Practical Applications
This indicator can be used across various trading styles:
Scalping: Identify quick reversal points on lower timeframes using real-time alerts.
Day Trading: Use inversion gaps as key levels for intraday support/resistance or trend continuation setups.
Swing Trading: Analyse higher timeframes to identify major inversion zones that could act as critical turning points in larger trends.
By integrating this tool into your trading routine, you can streamline your analysis process and focus on executing high-probability setups.
Conclusion
The Inversion Fair Value Gap (IFVG) indicator is more than just a technical analysis tool—it’s a strategic ally for traders looking to refine their edge in the markets. By automating the detection and tracking of inversion gaps based on ICT principles, it simplifies complex market analysis while maintaining accuracy and depth. Whether you’re new to ICT strategies or an experienced trader seeking greater precision, this indicator will elevate your trading game by aligning your approach with institutional behavior.
If you’re serious about improving your trading results while saving time and effort, this tool is an essential addition to your toolkit. It provides clarity in chaotic markets, enhances precision in trade execution, and ensures you never miss critical opportunities in your trading journey.
__________________________________________
Thanks for your support!
If you found this idea helpful or learned something new, drop a like 👍 and leave a comment, I’d love to hear your thoughts! 🚀
Make sure to follow me for more price action insights, free indicators, and trading strategies. Let’s grow and trade smarter together! 📈

Bitcoin Block Height (Total Blocks)Bitcoin Block Height by RagingRocketBull 2020
Version 1.0
Differences between versions are listed below:
ver 1.0: compare QUANDL Difficulty vs Blockchain Difficulty sources, get total error estimate
ver 2.0: compare QUANDL Hash Rate vs Blockchain Hash Rate sources, get total error estimate
ver 3.0: Total Blocks estimate using different methods
--------------------------------
This indicator estimates Bitcoin Block Height (Total Blocks) using Difficulty and Hash Rate in the most accurate way possible, since
QUANDL doesn't provide a direct source for Bitcoin Block Height (neither QUANDL:BCHAIN, nor QUANDL:BITCOINWATCH/MINING).
Bitcoin Block Height can be used in other calculations, for instance, to estimate the next date of Bitcoin Halving.
Using this indicator I demonstrate:
- that QUANDL data is not accurate and differ from Blockchain source data (industry standard), but still can be used in calculations
- how to plot a series of data points from an external csv source and compare it with another source
- how to accurately estimate Bitcoin Block Height
Features:
- compare QUANDL Difficulty source (EOD, D1) with external Blockchain Difficulty csv source (EOD, D1, embedded)
- show/hide Quandl/Blockchain Difficulty curves
- show/hide Blockchain Difficulty candles
- show/hide differences (aqua vertical lines)
- show/hide time gaps (green vertical lines)
- count source differences within data range only or for the whole history
- multiply both sources by alpha to match before comparing
- floor/round both matched sources when comparing
- Blockchain Difficulty offset to align sequences, bars > 0
- count time gaps and missing bars (as result of time gaps)
WARNING:
- This indicator hits the max 1000 vars limit, adding more plots/vars/data points is not possible
- Both QUANDL/Blockchain provide daily EOD data and must be plotted on a daily D1 chart otherwise results will be incorrect
- current chart must not have any time gaps inside the range (time gaps outside the range don't affect the calculation). Time gaps check is provided.
Otherwise hardcoded Blockchain series will be shifted forward on gaps and the whole sequence become truncated at the end => data comparison/total blocks estimate will be incorrect
Examples of valid charts that can run this indicator: COINBASE:BTCUSD,D1 (has 8 time gaps, 34 missing bars outside the range), QUANDL:BCHAIN/DIFF,D1 (has no gaps)
Usage:
- Description of output plot values from left to right:
- c_shifted - 4x blockchain plotcandles ohlc, green/black (default na)
- diff - QUANDL Difficulty
- c_shifted - Blockchain Difficulty with offset
- QUANDL Difficulty multiplied by alpha and rounded
- Blockchain Difficulty multiplied by alpha and rounded
- is_different, bool - cur bar's source values are different (1) or not (0)
- count, number of differences
- bars, total number of bars/data points in the range
- QUANDL daily blocks
- Blockchain daily blocks
- QUANDL total blocks
- Blockchain total blocks
- total_error - difference between total_blocks estimated using both sources as of cur bar, blocks
- number_of_gaps - number of time gaps on a chart
- missing_bars - number of missing bars as result of time gaps on a chart
- Color coding:
- Blue - QUANDL data
- Red - Blockchain data
- Black - Is Different
- Aqua - number of differences
- Green - number of time gaps
- by default the indicator will show lots of vertical aqua lines, 138 differences, 928 bars, total error -370 blocks
- to compare the best match of the 2 sources shift Blockchain source 1 bar into the future by setting Blockchain Difficulty offset = 1, leave alpha = 0.01 =>
this results in no vertical aqua lines, 0 differences, total_error = 0 blocks
if you move the mouse inside the range some bars will show total_error = 1 blocks => total_error <= 1 blocks
- now uncheck Round Difficulty Values flag => some filled aqua areas, 218 differences.
- now set alpha = 1 (use raw source values) instead of 0.01 => lots of filled aqua areas, 871 differences.
although there are many differences this still doesn't affect the total_blocks estimate provided Difficulty offset = 1
Methodology:
To estimate Bitcoin Block Height we need 3 steps, each step has its own version:
- Step 1: Compare QUANDL Difficulty vs Blockchain Difficulty sources and estimate error based on differences
- Step 2: Compare QUANDL Hash Rate vs Blockchain Hash Rate sources and estimate error based on differences
- Step 3: Estimate Bitcoin Block Height (Total Blocks) using different methods in the most accurate way possible
QUANDL doesn't provide block time data, but we can calculate it using the Hash Rate approximation formula:
estimated Hash rate/sec H = 2^32 * D / T, where D - Difficulty, T - block time, sec
1. block time (T) can be derived from the formula, since we already know Difficulty (D) and Hash Rate (H) from QUANDL
2. using block time (T) we can estimate daily blocks as daily time / block time
3. block height (total blocks) = cumulative sum of daily blocks of all bars on the chart (that's why having no gaps is important)
Notes:
- This code uses Pinescript v3 compatibility framework
- hash rate is in THash/s, although QUANDL falsely states in description GHash/s! THash = 1000 GHash
- you can't read files, can only embed/hardcode raw data in script
- both QUANDL and Blockchain sources have no gaps
- QUANDL and Blockchain series are different in the following ways:
- all QUANDL data is already shifted 1 bar into the future, i.e. prev day's value is shown as cur day's value => Blockchain data must be shifted 1 bar forward to match
- all QUANDL diff data > 1 bn (10^12) are truncated and have last 1-2 digits as zeros, unlike Blockchain data => must multiply both values by 0.01 and floor/round the results
- QUANDL sometimes rounds, other times truncates those 1-2 last zero digits to get the 3rd last digit => must use both floor/round
- you can only shift sequences forward into the future (right), not back into the past (left) using positive offset => only Blockchain source can be shifted
- since total_blocks is already a cumulative sum of all prev values on each bar, total_error must be simple delta, can't be also int(cum()) or incremental
- all Blockchain values and total_error are na outside the range - move you mouse cursor on the last bar/inside the range to see them
TLDR, ver 1.0 Conclusion:
QUANDL/Blockchain Difficulty source differences don't affect total blocks estimate, total error <= 1 block with avg 150 blocks/day is negligible
Both QUANDL/Blockchain Difficulty sources are equally valid and can be used in calculations. QUANDL is a relatively good stand in for Blockchain industry standard data.
Links:
QUANDL difficulty source: www.quandl.com
QUANDL hash rate source: www.quandl.com
Blockchain difficulty source (export data as csv): www.blockchain.com

Advanced FVG Detector Pro📊 Advanced FVG Detector Pro - Smart Money Analysis Tool
Overview
The Advanced FVG Detector Pro is a sophisticated Pine Script v6 indicator designed to identify and track Fair Value Gaps (FVGs) with institutional-grade precision. This tool goes beyond basic gap detection by incorporating volume analysis, smart money scoring, and adaptive filtering to help traders identify high-probability trading opportunities.
What are Fair Value Gaps?
Fair Value Gaps (FVGs) are price inefficiencies that occur when the market moves so quickly that it leaves behind an imbalance or "gap" in price action. These gaps often act as magnets for future price movement as the market seeks to fill these inefficiencies. Professional traders and institutions closely monitor FVGs as they represent areas of potential support, resistance, and high-probability trade setups.
🎯 Key Features
1. Smart Money Scoring System
Proprietary algorithm that rates each FVG on a 0-100 scale Combines gap size, volume strength, price location, and trend alignment Filter out low-quality setups by setting minimum score thresholdsFocus on institutional-grade opportunities with scores above 70
2. Advanced Volume Validation
Validates FVGs with volume analysis to reduce false signals Only displays gaps formed during significant volume periods Customizable volume multiplier for different market conditions
Visual volume strength indicators on chart
3. Flexible Mitigation Options
Full Fill: Traditional complete gap closure Midpoint Touch: More aggressive entry strategy
Partial Fill: Customizable percentage-based mitigation (10-90%) Choose the strategy that matches your trading style
4. ATR-Based Adaptive Filtering
Automatically adjusts to market volatility using Average True Range Works consistently across any instrument, timeframe, or volatility regime No manual recalibration needed when switching markets Filters out noise while capturing meaningful gaps
5. Real-Time Statistics Dashboard
Live tracking of total active FVGs Bullish vs Bearish gap count Mitigation rate percentage
Average Smart Money Score Toggle on/off based on preference
6. Professional Visual Design
Clean, customizable color schemes Optional midline display for precise entry planning
Labels showing gap type, score, and volume strength Automatic extension of active gaps
Mitigated gaps change color for easy identification
📈 How to Use
For Day Traders:
Use 5-15 minute timeframes
Set ATR Multiplier to 0.15-0.25
Enable volume validation
Focus on FVGs with scores above 65
For Swing Traders:
Use 1H-4H timeframes
Set ATR Multiplier to 0.5-1.0
Use "Midpoint Touch" mitigation
Focus on FVGs with scores above 70
For Position Traders:
Use Daily timeframe
Set ATR Multiplier to 0.75-1.5
Use "Full Fill" mitigation
Focus on FVGs with scores above 75
🔧 Customization Options
Detection Settings:
Minimum FVG size percentage filter
ATR-based size filtering
Maximum number of gaps to display
Smart Money Score minimum threshold
Volume Analysis:
Volume validation toggle
Volume multiplier adjustment
Volume moving average period
Visual volume strength background
Mitigation Control:
Choose mitigation type (Full/Midpoint/Partial)
Set partial fill percentage
Auto-remove mitigated gaps
Control how long mitigated gaps remain visible
Visual Customization:
Bullish/Bearish/Mitigated colors
Show/hide midlines
Show/hide labels
Box extension length
Statistics dashboard toggle
🎓 Trading Strategy Ideas
1. FVG Retest Strategy
Wait for price to create a high-score FVG (70+)
Enter on the first retest of the gap
Place stop loss beyond the gap
Target the opposite side of the gap or next FVG
2. Confluence Trading
Combine FVGs with support/resistance levels
Look for FVGs near key moving averages (20/50 EMA)
Higher probability when FVG aligns with trendlines
Use multiple timeframe analysis
3. Breakout Confirmation
FVGs often form during strong breakouts
High-volume FVGs confirm breakout strength
Enter on mitigation of breakout FVG
Trail stops as new FVGs form in trend direction
⚡ Performance Optimizations
Efficient memory management for smooth chart performance
Optimized calculations run only once per bar
Smart array management prevents memory leaks
Works smoothly even with 100+ active FVGs
🔔 Alert System
Customizable alerts for new bullish FVGs
Customizable alerts for new bearish FVGs
Mitigation alerts for active gaps
Frequency control to avoid alert spam
💡 Pro Tips
Multi-Timeframe Approach: Identify major FVGs on higher timeframes (Daily/4H) and use lower timeframes (15M/5M) for precise entries
Volume Confirmation: The highest probability setups occur when FVGs form with 2x+ average volume
Trend Alignment: Trade FVGs in the direction of the major trend for best results
Patience Pays: Wait for price to return to the FVG rather than chasing breakouts
Risk Management: Always use stop losses beyond the FVG boundaries
📚 Educational Value
This indicator is perfect for:
Learning to identify institutional order flow
Understanding market microstructure
Developing price action trading skills
Recognizing supply and demand imbalances
Improving entry and exit timing
⚠️ Disclaimer
This indicator is a tool for technical analysis and should not be used as the sole basis for trading decisions. Always combine with proper risk management, fundamental analysis, and your own trading plan. Past performance does not guarantee future results.
🔄 Updates & Support
Regular updates will include:
Additional filtering options
Enhanced multi-timeframe analysis
More customization features
Performance improvements
📊 Best Pairs/Markets
Works excellently on:
Forex pairs (EUR/USD, GBP/USD, etc.)
Cryptocurrency (BTC, ETH, etc.)
Stock indices (SPX, NQ, etc.)
Individual stocks
Commodities (Gold, Oil, etc.)
Version Information
Version: 1.0
Pine Script: Version 6
Type: Overlay Indicator
Max Boxes: 500
Max Lines: 500

FVG [TakingProphets]🧠 Purpose
This indicator is built for traders applying Inner Circle Trader (ICT) methodology. It detects and manages Fair Value Gaps (FVGs) — price imbalances that often act as future reaction zones. It also highlights New Day Opening Gaps (NDOGs) and New Week Opening Gaps (NWOGs) that frequently play a role in early-session price behavior.
📚 What is a Fair Value Gap?
A Fair Value Gap forms when price moves rapidly, skipping over a portion of the chart between three candles — typically between the high of the first candle and the low of the third. These zones are considered inefficient, meaning institutions may return to them later to:
-Rebalance unfilled orders
-Enter or scale into positions
-Engineer liquidity with minimal slippage
In ICT methodology, FVGs are seen as both entry zones and targets, depending on market structure and context.
⚙️ How It Works
-This script automatically identifies and manages valid FVGs using the following logic:
-Bullish FVGs: When the low of the current candle is above the high from two candles ago
-Bearish FVGs: When the high of the current candle is below the body of two candles ago
-Minimum Gap Filter: Gaps must be larger than 0.05% of price
-Combine Consecutive Gaps (optional): Merges adjacent gaps of the same type
-Consequent Encroachment Line (optional): Plots the midpoint of each gap
-NDOG/NWOG Tracking: Labels gaps created during the 5–6 PM session transition
-Automatic Invalidation: Gaps are removed once price closes beyond their boundary
🎯 Practical Use
-Use unmitigated FVGs as potential entry points or targets
-Monitor NDOG and NWOG for context around daily or weekly opens
-Apply the midpoint (encroachment) line for precise execution decisions
-Let the script handle cleanup — only active, relevant zones remain visible
🎨 Customization
-Control colors for bullish, bearish, and opening gaps
-Toggle FVG borders and midpoint lines
-Enable or disable combining of consecutive gaps
-Fully automated zone management, no manual intervention required
✅ Summary
This tool offers a clear, rules-based approach to identifying price inefficiencies rooted in ICT methodology. Whether used for intraday or swing trading, it helps traders stay focused on valid, active Fair Value Gaps while filtering out noise and maintaining chart clarity.

Indecisive and Explosive CandlesThe Explosive & Base Candle with Gaps Identifier is an indicator designed to enhance your market analysis by identifying critical candle types and gaps in price action. This tool aids traders in pinpointing zones of significant buyer-seller interaction and potential institutional activity, providing valuable insights for strategic trading decisions.
Main Features:
Base Candle Identification: This feature detects Base candles, also known as indecisive candles, within the price action. A Base candle is characterized by a body (the difference between the close and open prices) that is less than or equal to 50% of its total range (the difference between the high and low prices). These candles mark zones where buyers and sellers are evenly matched, highlighting areas of potential support and resistance.
Explosive Candle Identification: The indicator identifies Explosive candles, which are indicative of strong market moves often driven by institutional activity. An Explosive candle is defined by a body that is greater than 70% of its total range. Recognizing these candles helps traders spot significant momentum and potential breakout points.
Supply and Demand Zone Identification: Both Base and Explosive candles are essential for identifying supply and demand zones within the price action. These zones are crucial for traders to place their trades based on the likelihood of price reversals or continuations.
Gap Detection: The indicator also detects gaps, defined as the difference between the close price of one candle and the open price of the next. Gaps are significant because prices often return to these levels to "fill the gap," providing opportunities for traders to predict price movements and place strategic trades.
Visual Markings and Alerts: The indicator visually marks Base and Explosive candles as well as gaps directly on the chart, making them easily identifiable at a glance. Traders can also set customizable alerts to notify them when these key candle types and gaps appear, ensuring they never miss an important trading opportunity.
Customizable Settings: Tailor the indicator’s settings to match your trading style and preferences. Adjust the criteria for Base and Explosive candles, as well as how gaps are detected and displayed, to suit your specific analysis needs.
How to Use:
Add the Indicator: Apply the Explosive & Base Candle with Gaps Identifier to your TradingView chart.
Analyze Identified Zones: Observe the marked Base and Explosive candles and gaps to identify key areas of support, resistance, and potential price reversals or continuations.
Set Alerts: Customize and set alerts for the detection of Base candles, Explosive candles, and gaps to stay informed of critical market movements in real-time.
Integrate with Your Strategy: Use the insights provided by the indicator to enhance your existing trading strategy, improving your entry and exit points based on the identified supply and demand zones.
The Explosive & Base Candle with Gaps Identifier is an invaluable tool for traders aiming to refine their market analysis and make more informed trading decisions. By identifying critical areas of price action, this indicator supports traders in navigating the complexities of the financial markets with greater precision and confidence.
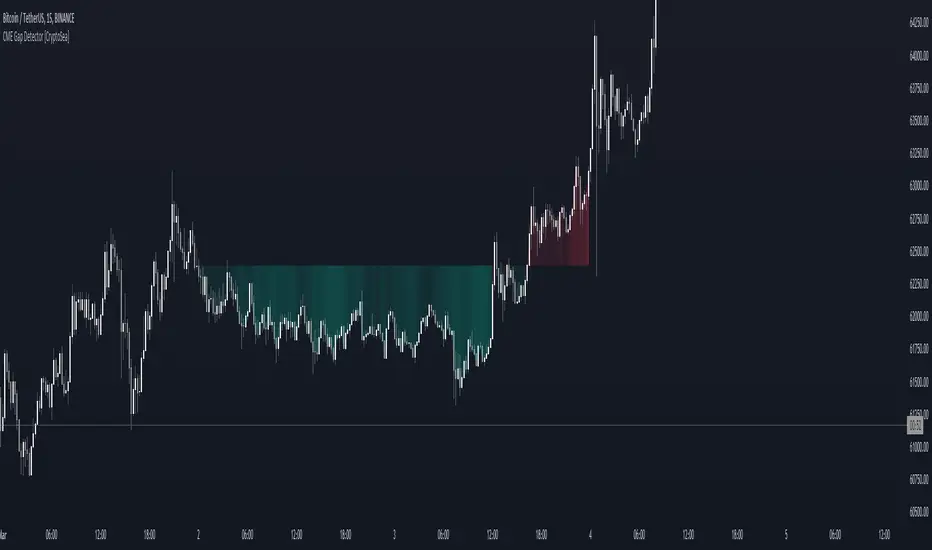
CME Gap Detector [CryptoSea]The CME Gap Indicator , is a tool designed to identify and visualize potential price gaps in the cryptocurrency market, particularly focusing on gaps that occur during the weekend trading sessions. By highlighting these gaps, traders can gain insights into potential market movements and anticipate price behavior.
Key Features
Gap Identification: The indicator identifies gaps in price between the Friday close and the subsequent opening price on Monday. It plots these gaps on the chart, allowing traders to easily visualize and analyze their significance.
Weekend Price Comparison: It compares the closing price on Friday with the opening price on Monday to determine whether a gap exists and its magnitude.
Customizable Visualization: Traders have the option to customize the visualization of the gaps, including the color scheme for better clarity and visibility on the chart.
Neutral Candle Color Option: Users can choose to display neutral candle colors, enhancing the readability of the chart and reducing visual clutter.
How it Works
Data Fetching and Calculation: The indicator fetches the daily close price and calculates whether a gap exists between the Friday close and the subsequent Monday opening price.
Plotting: It plots the current price and the previous Friday's close on the chart, making it easy for traders to compare and analyze.
Gradient Fill: The indicator incorporates a gradient fill feature to visually represent the magnitude of the gap, providing additional insights into market sentiment.
Weekend Line Logic: It includes logic to identify Sunday bars and mark them on the chart, aiding traders in distinguishing weekend trading sessions.
Application
Gap Trading Strategy: Traders can use the identified gaps as potential entry or exit points in their trading strategies, considering the tendency of price to fill gaps over time.
Market Sentiment Analysis: Analyzing the presence and size of weekend gaps can provide valuable insights into market sentiment and participant behavior.
Risk Management: Understanding the existence and significance of gaps can help traders manage their risk exposure and make informed decisions.
The CME Gap indicator offers traders a valuable tool for analyzing weekend price gaps in the cryptocurrency market, empowering them to make informed trading decisions and capitalize on market opportunities.
Imbalance Detector [LuxAlgo]This indicator detects and highlights market imbalances alongside a dashboard returning information about their frequency of occurrence and their fill percentage. Imbalances included in this script are Fair Value Gaps (FVG), Opening Gaps (OG) and Volume Imbalances (VI).
Alerts are available for the occurrences of all market imbalances.
Settings
Imbalances
Each imbalance has the same settings layout:
Imbalance: Enable/disable the detection of the specific imbalance.
Min Width: If enabled, requires the imbalance area width to be greater than the specified value. This minimum width can be expressed in points, percentages or ATR multiples.
Extend: Extend imbalances by a specified number of bars.
Dashboard
Show Dashboard: Enable/disable the dashboard on the chart.
Dashboard Location: Location of the dashboard on the chart.
Dashboard Size: Size of the dashboard.
Usage
Market imbalances are part of the many concepts available to price action traders and highlight areas where there is a disparity between supply and demand.
It is common to see price come back to these areas and traders often use them as supports and resistances but also as targets.
Details
The script can detect three distinct types of imbalances described below.
Fair Value Gaps
Fair Value Gaps (FVG) are three candle formations characterized by a gap between the wicks of the non-adjacent candles in the formation.
A bullish FVG is characterized by a gap between the current price low and the 2 bars anterior price high, and a bearish FVG is characterized by a gap between the current price high and the 2 bars anterior price low.
Opening Gaps
Opening Gaps (OG) are imbalances characterized by non-existent activity within a specific price range.
A bullish OG occurs when the current price low is greater than the previous high, a bearish OG occurs when price high is lower than the previous price low.
Opening Gaps primarily occur in closing markets, as such they are less common in the cryptocurrency market.
Most of the time an Opening Gap will also be accompanied by a Fair Value Gap, in order to avoid clutter the indicator will not detect Fair Value Gaps if Opening Gaps are enabled and if an Opening Gap has been detected
Volume Imbalances
Volume Imbalances (VI) are characterized by a price discontinuity between the opening price and previous close, but unlike Opening Gaps we do not see nonexistent activity within a certain price range.
A bullish VI occur when both the opening and closing prices are superior to the previous closing price, with the current price low overlapping the previous price high. A bearish VI occur when both the opening and closing prices are inferior to the previous closing price, with the current price high overlapping the previous price low.
Because Volume Imbalances can occur excessively on markets with frequent gaps, we make use of an additional condition for filtering out less significant imbalances. Bullish VI's will require the previous price high to be lower than the opening price, while bullish VI's will require the previous price low to be higher than the opening price.

FVG Scanner ProFVG Scanner Pro — Smart Fair Value Gap Detector (with HTF context & proximity alerts)
What it does
FVG Scanner Pro automatically finds Fair Value Gaps (FVGs) on your current chart and (optionally) on a higher timeframe (HTF), draws them as color-coded zones, and notifies you when price comes close to a gap boundary using an ADR-based proximity trigger and (optional) volume confirmation. It’s designed for ICT-style gap trading, confluence building, and clean visual execution.
How it works:
FVG definition
* Bullish FVG (gap up): low > high (the current candle’s low is above the high 2 bars ago).
* Bearish FVG (gap down): high < low (the current candle’s high is below the low 2 bars ago).
* Gaps smaller than your Min FVG Size (%) are ignored. (Gap size = (top-bottom)/bottom * 100.)
Higher-timeframe logic (auto-selected)
The script auto picks a sensible HTF:
1–5m → 15m, 15m → 1H, 1H → 4H, 4H → 1D, 1D → 1W, 1W → 1M, small 1M → 3M, big ≥3M → 12M.
You can display HTF FVGs and even filter so current-TF FVGs only show when they overlap an HTF gap.
Proximity alerts (ADR-based)
The script computes ADR on the current chart timeframe over a user-set lookback (default 20 bars).
An alert fires when price moves toward the closest actionable boundary and comes within ADR × Multiplier:
Bullish: price moving down, within distance of the bottom of a bullish FVG.
Bearish: price moving up, within distance of the top of a bearish FVG.
Yellow ▲/▼ markers show where a proximity alert triggered.
Volume filter (optional)
Require volume to be greater than SMA(20) × multiplier to accept a newly formed FVG.
Lifecycle
Each gap remains active for Extend FVG Box (Bars) bars.
You can delete the box after fill, or keep filled gaps visible as gray zones, or hide them.
Color legend
Current-TF Bullish: Pink/Magenta box
Current-TF Bearish: Cyan/Turquoise box
HTF Bullish: Gold box
HTF Bearish: Orange box
Filled (if shown): Gray box
Alert markers: Yellow ▲ (bullish), Yellow ▼ (bearish)
Inputs (what to tweak)
Show FVGs: Bullish / Bearish / Both
Max Bars Back to Find FVG: collection window & cleanup guard
Extend FVG Box (Bars): how long a zone stays tradable/active
Min FVG Size (%): ignore micro gaps
Delete Box After Fill & Show Filled FVGs: choose how you want completed gaps handled
Show Alert Markers: show/hide the yellow proximity arrows
Show Higher Timeframe FVG: overlay HTF gaps (auto TF)
HTF Filter: only display current-TF gaps that overlap an HTF gap
ADR Lookback & Proximity Multiplier: tune alert sensitivity to your market & timeframe
Volume Filter & Volume > MA Multiple: require above-average volume for new gaps
Built-in alerts (ready to use)
Create alerts in TradingView (⚠️ “Once per bar” or “Once per bar close”, your choice) and select from:
🟢 Bullish FVG Proximity — price approaching a bullish gap bottom
🔴 Bearish FVG Proximity — price approaching a bearish gap top
✅ New Bullish FVG Formed
⚠️ New Bearish FVG Formed
The alert messages include the symbol and price; proximity markers are also plotted on chart.
Tips & best practices
Use FVGs with market structure (break of structure, swing points), order blocks, or liquidity pools for confluence.
On very low timeframes, raise Min FVG Size and/or lower Max Bars Back to reduce noise and keep things fast.
Extend FVG Box controls how long a zone is considered valid; align it with your holding horizon (scalp vs swing).
Information panel (top-right)
Shows your mode, current HTF, number of gaps in memory, active bull/bear counts, and current-TF ADR.

Inversion Fair Value Gap Signals [AlgoAlpha]🟠 OVERVIEW
This script is a custom signal tool called Inversion Fair Value Gap Signals (IFVG) , designed to detect, track, and visualize fair value gaps (FVGs) and their inversions directly on price charts. It identifies bullish and bearish imbalances, monitors when these zones are mitigated or rejected, and extends them until resolution or expiration. What makes this script original is the inclusion of inversion logic—when a gap is filled, the area flips into an opposite "inversion fair value gap," creating potential reversal or continuation zones that give traders additional context beyond classic FVG analysis.
🟠 CONCEPTS
The script builds on the Smart Money Concepts (SMC) principle of fair value gaps, where inefficiencies form when price moves too quickly in one direction. Detection requires a three-bar sequence: a strong up or down move that leaves untraded price between bar highs and lows. To refine reliability, the script adds an ATR-based size filter and prevents overlap between zones. Once created, gaps are tracked in arrays until mitigation (price closing back into the gap), expiration, or transformation into an inversion zone. Inversions act as polarity flips, where bullish gaps become bearish resistance and bearish gaps become bullish support. Lower-timeframe volume data is also displayed inside zones to highlight whether buying or selling pressure dominated during gap creation.
🟠 FEATURES
Automatic detection of bullish and bearish FVGs with ATR-based thresholding.
Inversion logic: mitigated gaps flip into opposite-colored IFVG zones.
Volume text overlay inside each zone showing up vs down volume.
Visual markers (△/▽ for FVG, ▲/▼ for IFVG) when price exits a zone without mitigation.
🟠 USAGE
Apply the indicator to any chart and enable/disable bullish or bearish FVG detection depending on your focus. Use the colored gap zones as areas of interest: bullish gaps suggest possible continuation to the upside until mitigated, while bearish gaps suggest continuation down. When a gap flips into an inversion zone, treat it as potential support/resistance—bullish IFVGs below price may act as demand, while bearish IFVGs above price may act as supply. Watch the embedded up/down volume data to gauge the strength of participants during gap formation. Use the △/▽ and ▲/▼ markers to spot when price rejects gaps or inversions without filling them, which can indicate strong trending momentum. For practical use, combine alerts with your trade plan to track when new gaps form, when old ones are resolved, or when key zones flip into inversions, helping you align entries, targets, or reversals with institutional order flow logic.

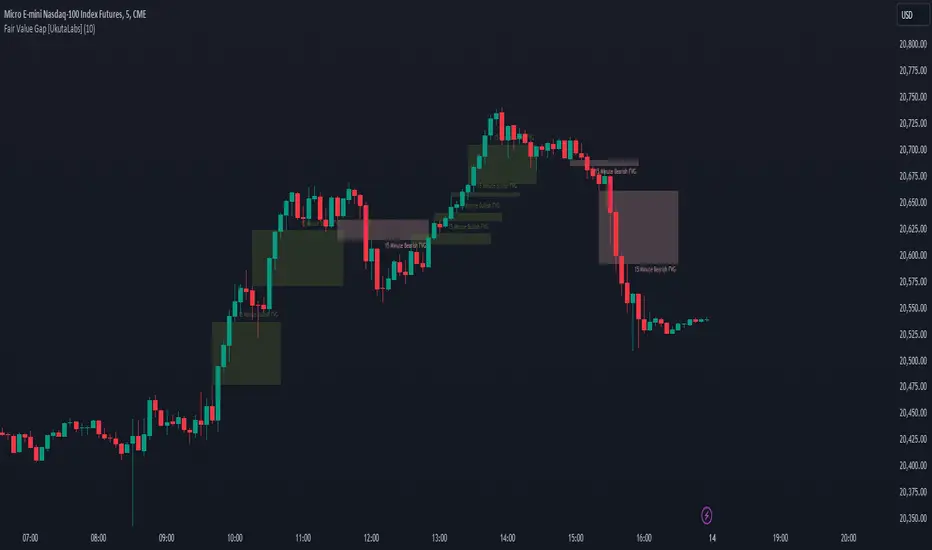
Fair Value Gap [UkutaLabs]█ OVERVIEW
Fair Value Gaps are price jumps caused by the imbalance buying and selling pressures in trading and are most commonly used amongst price action traders. Fair Value Gaps are formed via a three-candle sequence in which a large candle’s neighbouring candles’ upper and lower wicks do not fully overlap the large candle.
The Fair Value Gaps Indicator also supports Multi Time Frame Plotting, allowing you to plot the Fair Value Gaps from higher time frames onto lower time frame charts.
The Fair Value Gaps Indicator is a powerful trading toolkit that provides users with more information than they would typically have available to them by allowing them to configure several charts worth of information onto one single chart.
█ USAGE
The script automatically identifies imbalances between buying and selling pressure in the market in real time, offering traders valuable insight into current market sentiment. These gaps are considered to be levels where the supply and demand of a commodity are imbalanced, and the price tends to return to fill these gaps (But are not guaranteed to).
The Fair Value Gaps Indicator also allows gaps from higher time frames to be drawn on lower time frame charts, providing traders with more information than they would typically have access to to further simplify the decision making process.
█ SETTINGS
Configuration
• Show Labels: Determines whether labels that identify which time frame a FVG is calculated from.
• Max FVG Display: Determines the limit to the number of FVGs that can be drawn from all time frames. Set this value to 0 to remove this limit.
Current Time Frame
• Display: Determines whether or not FVGs from the current time frame will be drawn on the chart.
• Bullish Color: Determines the color of Bullish FVGs calculated from the current time frame.
• Bearish Color: Determines the color of Bearish FVGs calculated from the current time frame.
5 Minute (Higher Time Frame)
• Display: Determines whether or not FVGs from the 5 minute time frame will be drawn on the chart.
• Bullish Color: Determines the color of Bullish FVGs calculated from the 5 minute time frame.
• Bearish Color: Determines the color of Bearish FVGs calculated from the 5 minute time frame.
15 Minute (Higher Time Frame)
• Display: Determines whether or not FVGs from the 15 minute time frame will be drawn on the chart.
• Bullish Color: Determines the color of Bullish FVGs calculated from the 15 minute time frame.
• Bearish Color: Determines the color of Bearish FVGs calculated from the 15 minute time frame.
30 Minute (Higher Time Frame)
• Display: Determines whether or not FVGs from the 30 minute time frame will be drawn on the chart.
• Bullish Color: Determines the color of Bullish FVGs calculated from the 30 minute time frame.
• Bearish Color: Determines the color of Bearish FVGs calculated from the 30 minute time frame.
60 Minute (Higher Time Frame)
• Display: Determines whether or not FVGs from the 60 minute time frame will be drawn on the chart.
• Bullish Color: Determines the color of Bullish FVGs calculated from the 60 minute time frame.
• Bearish Color: Determines the color of Bearish FVGs calculated from the 60 minute time frame.
240 Minute (Higher Time Frame)
• Display: Determines whether or not FVGs from the 240 minute time frame will be drawn on the chart.
• Bullish Color: Determines the color of Bullish FVGs calculated from the 240 minute time frame.
• Bearish Color: Determines the color of Bearish FVGs calculated from the 240 minute time frame.
Daily (Higher Time Frame)
• Display: Determines whether or not FVGs from the daily time frame will be drawn on the chart.
• Bullish Color: Determines the color of Bullish FVGs calculated from the daily time frame.
• Bearish Color: Determines the color of Bearish FVGs calculated from the daily time frame.
FVG Breakaway/3rd Candle (Arjo) [MK]Simple script to identify FVGs (Fair Value Gaps) on the current chart timeframe. The script differs from other FVG indicators on the Tradingview platform by using Arjos 3rd candle rule to identify which gaps are 'Breakway Gaps' and which Gaps are likely to be returned to.
NOTE: As with all 'trading rules' this theory is not 100% accurate.
default settings:
Breakaway Gaps = YELLOW
Gaps that price may return to = GREEN
Mitigated Gaps = 100% TRANSPARENT
What is a FVG:
A FVG is a price area defined by a 3 candle pattern. For a bullish FVG, the low of the 3rd candle must be higher than the high of the 1st candle. This then leaves an area that is drawn as in the example below:
A bearish FVG is defined by the high of the 3rd candle being lower than the low of the 1st candle, as shown in the example below:
FVGs can act like magnets where price will either retrace to or reach for, therefore they can be used as entry points and also for take profit target levels.
If for example, a trader would like to use an FVG for an entry, it would be useful to know which FVGs are more likely for price to re-enter and which FVG will be left un-touched. FVGs that are likely to be left un-touched by price are called 'Breakaway Gaps'.
How do we define a 'Breakaway Gap':
First we identify FVGs using the rules stated above, then we look to see where the 3rd candle closed in relation to the 2nd candle. For a bullish 'Breakaway Gap' we want to see the 3rd candle close above the high of the 2nd candle. An example of a bullish Breakaway Gap is shown in the example below:
A bearish 'Breakaway Gap' is defined by the close of the 3rd candle being lower than the low of the 2nd candle. An example is shown below:
How do we define an FVG that price may return to:
Any gap that does not meet the above rules for a 'Breakway Gap' is therefore considered an FVG that price may return to. So for a bullish FVG that price may return to we would look to see if the close of the 3rd candle is above the high of the 2nd candle. If it is not above the high of the 2nd candle then it more likely that price will retrace into the FVG before continuing higher. An example is shown below:
A bearish gap that price may return to is defined by the close of the 3rd candle not being lower than the low of the 2nd candle. An example is shown below:
The indicator is based on the teachings of 'Arjo'. Note: breakaway gaps will only remain 'breakaway' until a liquidity level is reached. Breakaways therefore do not remain 'breakaway' forever. Users of the indicators must fully comprehend this theory before using the indicator with live markets.
Users of the script should be fully aware of this concept and also have conducted thorough backtesting using a large data set before using this indicator with live accounts.

Simple Gap IndicatorTitle: Simple Gap Indicator
Description: This is a utility script designed to automate the tracking and management of price gaps (also known as "Windows") on the chart. Unlike static drawings, this indicator dynamically monitors open gaps and automatically "closes" them (stops drawing) once price has filled the area, keeping your chart clean and focused on active levels only.
Why Use This Tool? Traders often mark gaps manually, but charts quickly become cluttered with old, invalid levels. This script solves that problem by using an array-based management system to track every open gap in real-time and remove it the moment it is invalidated by price action.
Technical Methodology:
Gap Detection: The script identifies "Full Gaps" where the Low of the current candle is higher than the High of the previous candle (Bullish), or vice versa (Bearish). This indicates a total disconnect in price delivery.
Dynamic Filtering:
ATR Filter: Users can filter out insignificant "noise" gaps by setting a minimum size threshold based on the Average True Range (ATR).
Time Filter: Option to restrict gap detection to specific session hours (e.g., ignoring overnight gaps on 24h charts).
Auto-Closure: The script loops through all active gaps on every new bar. If the current price wick touches an open gap, the box is visually terminated at that specific bar index and removed from the tracking array.
Visuals:
Green Box: Bullish Gap (Support Zone).
Red Box: Bearish Gap (Resistance Zone).
Labels: Optional text displaying the precise Top/Bottom price coordinates of the gap.
How to Use:
Enable "Auto-Close Gap on Retest" to keep your chart clean.
Use the ATR Filter if you are getting too many signals on lower timeframes (e.g., set to 0.5x ATR).
Set alerts for "New Gap" or "Gap Filled" to automate your workflow.
Credits: Calculations based on standard Gap/Window price action theory. Array management logic custom-coded for Pine Script v6.
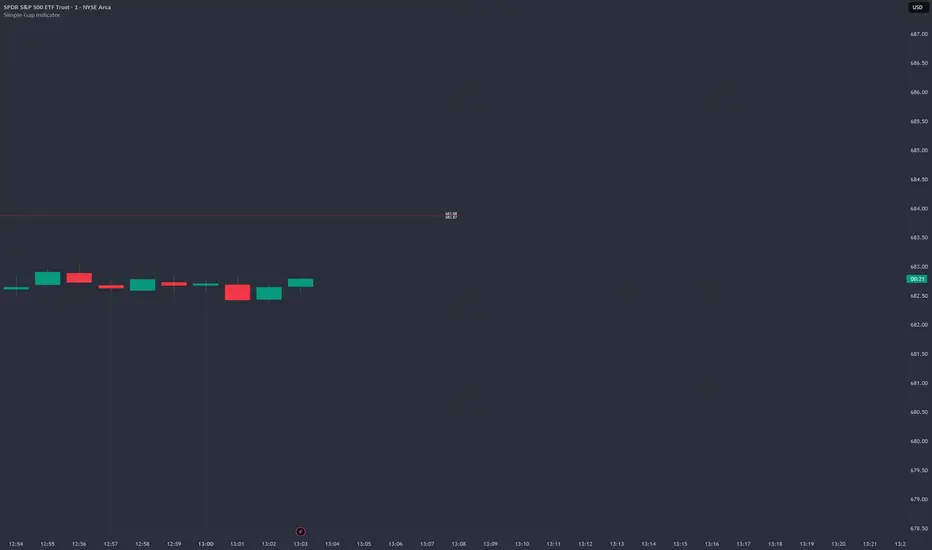
FVG – (auto close + age) GR V1.0FVG – Fair Value Gaps (auto close + age counter)
Short Description
Automatically detects Fair Value Gaps (FVGs) on the current timeframe, keeps them open until price fully fills the gap or a maximum bar age is reached, and shows how many candles have passed since each FVG was created.
Full Description
This indicator automatically finds and visualizes Fair Value Gaps (FVGs) using the classic 3-candle ICT logic on any timeframe.
It works on whatever timeframe you apply it to (M1, M5, H1, H4, etc.) and adapts to the current chart.
FVG detection logic
The script uses a 3-candle pattern:
Bullish FVG
Condition:
low > high
Gap zone:
Lower boundary: high
Upper boundary: low
Bearish FVG
Condition:
high < low
Gap zone:
Lower boundary: high
Upper boundary: low
Each detected FVG is drawn as a colored box (green for bullish, red for bearish in this version, but you can adjust colors in the inputs).
Auto-close rules
An FVG remains on the chart until one of the following happens:
Full fill / mitigation
A bullish FVG closes when any candle’s low goes down to or below the lower boundary of the gap.
A bearish FVG closes when any candle’s high goes up to or above the upper boundary of the gap.
Maximum bar age reached
Each FVG has a maximum lifetime measured in candles.
When the number of candles since its creation reaches the configured maximum (default: 200 bars), the FVG is automatically removed even if it has not been fully filled.
This keeps the chart cleaner and prevents very old gaps from cluttering the view.
Age counter (labels inside the boxes)
Inside every FVG box there is a small label that:
Shows how many bars have passed since the FVG was created.
Moves together with the right edge of the box and stays vertically centered in the gap.
This makes it easy to distinguish fresh gaps from older ones and prioritize which zones you want to pay attention to.
Inputs
FVG color – Main fill color for all FVG boxes.
Show bullish FVGs – Turn bullish gaps on/off.
Show bearish FVGs – Turn bearish gaps on/off.
Max bar age – Maximum number of candles an FVG is allowed to stay on the chart before it is removed.
Usage
Works on any symbol and any timeframe.
Can be combined with your own ICT / SMC concepts, order blocks, session ranges, market structure, etc.
You can also choose to only display bullish or only bearish FVGs depending on your directional bias.
Disclaimer
This script is for educational and informational purposes only and is not financial advice. Always do your own research and use proper risk management when trading.

ICT HTF Volume Candles (Based on HTF Candles by Fadi)# ICT HTF Volume Candles - Multi-Timeframe Volume Analysis
## Overview
This indicator provides multi-timeframe volume visualization designed to complement price action analysis. It displays volume data from up to 6 higher timeframes simultaneously in a separate panel, allowing traders to identify volume spikes, divergences, and institutional activity without switching between timeframes.
**Original Concept Credits:** This indicator builds upon the HTF Candles framework by Fadi, adapting it specifically for volume analysis with enhanced features including gap-filling for extended hours, multiple scaling methods, and advanced synchronization.
## What Makes This Script Original
### Key Innovations:
1. **Three Volume Scaling Methods:**
- **Per-HTF Auto Scale:** Each timeframe scales independently for detailed comparison
- **Global Auto Scale:** All timeframes use unified scale for relative volume comparison
- **Manual Scale:** User-defined maximum for consistent analysis across sessions
2. **Bullish/Bearish Volume Differentiation:**
- Volume bars colored based on price movement (close vs open)
- Separate styling for bullish (green) and bearish (red) volume periods
- Helps identify whether volume supports price direction
3. **Advanced Time Synchronization:**
- Custom daily candle open times (Midnight, 8:30 AM, 9:30 AM ET)
- Timezone-aware calculations for New York trading hours
- Real-time countdown timers for each timeframe
- **Gap-filling technology** for continuous display during extended hours and weekends
4. **Flexible Display Options:**
- Configurable spacing and positioning
- Label placement (top, bottom, or both)
- Day-of-week or time interval labels on candles
- Works reliably in backtesting and live trading
## How It Works
### Volume Calculation
The indicator uses `request.security()` with optimized parameters to fetch volume data from higher timeframes:
- **Volume Open/High/Low/Close (OHLC):** Tracks volume changes within each HTF candle
- **Color Logic:** Compares HTF close vs open prices to determine bullish/bearish classification
- **Alignment:** All volume bars share a common baseline for easy visual comparison
- **Gap Handling:** Uses `gaps=barmerge.gaps_off` to maintain continuity during non-trading hours
### Technical Implementation
```
1. Monitors HTF timeframe changes using request.security() with lookahead
2. Creates new VolumeCandle object when HTF bar opens
3. Updates current candle's volume H/L/C on each chart bar
4. Applies selected scaling method to normalize display height
5. Repositions all candles and labels on each bar update
6. Fills gaps automatically during extended hours for consistent display
```
### Scaling Methods Explained
**Method 1 - Auto Scale per HTF:**
Each timeframe displays volume relative to its own maximum. Best for identifying patterns within each individual timeframe.
**Method 2 - Global Auto Scale:**
All timeframes share the same scale based on the highest volume across all HTFs. Best for comparing relative volume strength between timeframes.
**Method 3 - Manual Scale:**
User sets maximum volume value. Best for maintaining consistent scale across different trading sessions or instruments.
## How to Use This Indicator
### Setup
1. Add indicator to your chart (it appears in a separate panel below price)
2. Configure up to 6 higher timeframes (default: 5m, 15m, 1H, 4H, 1D, 1W)
3. Set number of candles to display for each timeframe
4. Choose volume scaling method based on your analysis needs
5. Enable "Fix gaps in non-trading hours" for extended hours trading (enabled by default)
### Interpretation
**Volume Spikes:**
- Sudden increase in volume height indicates institutional activity or strong conviction
- Compare volume between timeframes to identify where the real money is moving
- Look for volume spikes that appear across multiple timeframes simultaneously
**Bullish vs Bearish Volume:**
- **Green volume bars:** Price closed higher (buying pressure)
- **Red volume bars:** Price closed lower (selling pressure)
- High green volume during uptrend = confirmation of strength
- High red volume during downtrend = confirmation of weakness
- High volume opposite to trend = potential reversal warning
**Multi-Timeframe Context:**
- **5m/15m:** Scalping and day trading activity
- **1H/4H:** Swing trading and intraday institutional flows
- **Daily/Weekly:** Major position building and long-term trends
**Divergences:**
- Price making new highs but volume declining = weakening trend
- Volume increasing while price consolidates = potential breakout brewing
- Price breaks level but volume doesn't confirm = likely false breakout
### Practical Examples
**Example 1 - Institutional Confirmation:**
Price breaks above resistance. Check volume across timeframes:
- 5m shows spike = retail interest
- 15m + 1H + 4H all show spikes = institutional confirmation
- **Trade confidence: HIGH**
**Example 2 - False Breakout Detection:**
Price breaks resistance with:
- High volume on 5m only
- Normal/low volume on 1H and 4H
- **Interpretation:** Likely retail trap, institutions not participating
- **Action:** Wait for pullback or avoid
**Example 3 - Accumulation Phase:**
Price ranges sideways but:
- Daily volume gradually increasing
- Weekly volume above average
- **Interpretation:** Smart money accumulating
- **Action:** Prepare for breakout in direction of volume
**Example 4 - Volume Divergence:**
Price makes new high:
- Current high has lower volume than previous high across all timeframes
- **Interpretation:** Weakening momentum
- **Action:** Consider profit-taking or reversal trade
## Configuration Parameters
### Timeframe Settings
- **HTF 1-6:** Select timeframes (must be higher than chart timeframe)
- **Max Display:** Number of candles to show per timeframe (1-50)
- **Limit to Next HTFs:** Display only first N enabled timeframes (1-6)
### Styling
- **Bull/Bear Colors:** Separate colors for body, border, and wick
- **Padding from current candles:** Distance offset from live price action
- **Space between candles:** Gap between individual volume bars
- **Space between Higher Timeframes:** Gap between different timeframe groups
- **Candle Width:** Thickness of volume bars (1-4, multiplied by 2)
### Volume Settings
- **Volume Scale Method:** Choose 1, 2, or 3
- 1 = Auto Scale per HTF (each TF independent)
- 2 = Global Auto Scale (all TF unified)
- 3 = Manual Scale (user-defined max)
- **Auto Scale Volume:** Enable/disable automatic scaling
- **Manual Scale Max Volume:** Set maximum when using Method 3
### Label Settings
- **HTF Label:** Show/hide timeframe names with color and size options
- **Label Positions:** Display at Top, Bottom, or Both
- **Label Alignment:** Align centered or Follow Candles
- **Remaining Time:** Show countdown timer until next HTF candle
- **Interval Value:** Display day-of-week or time on each candle
### Custom Daily Candle
- **Enable Custom Daily:** Override default daily candle timing
- **Open Time Options:**
- **Midnight:** Standard 00:00 ET daily open
- **8:30 AM:** Align with economic data releases
- **9:30 AM:** Align with NYSE market open
- Useful for specific trading strategies or market alignment
### Advanced Settings
- **Fix gaps in non-trading hours:** Maintains alignment during extended hours and weekends (recommended: ON)
- Prevents visual gaps during forex weekend closures
- Ensures consistent display during crypto 24/7 trading
- Improves backtesting reliability
## Best Practices
1. **Pair with Price Action:** Use alongside HTF price candles indicator for complete picture
2. **Start Simple:** Enable 2-3 timeframes initially (e.g., 15m, 1H, 4H), add more as needed
3. **Match Settings:** Use same candle width/spacing as companion price indicator for visual alignment
4. **Scale Appropriately:**
- Use **Global scale** (Method 2) when comparing timeframes
- Use **Per-HTF scale** (Method 1) for pattern analysis within each timeframe
- Use **Manual scale** (Method 3) for consistent day-to-day comparison
5. **Watch for Volume Clusters:** High volume appearing simultaneously across multiple HTFs signals significant market events
6. **Confirm Breakouts:** Always check if volume supports the price movement across higher timeframes
7. **Extended Hours:** Keep "Fix gaps" enabled for 24/7 markets (Forex, Crypto) and weekend analysis
## Technical Notes
- **Timezone:** All calculations use America/New_York timezone for consistency
- **Real-time Updates:** Volume and timers update on each tick during market hours
- **Performance:** Optimized with max_bars_back=5000 for extensive historical analysis
- **Compatibility:** Works on all instruments with volume data (Stocks, Forex, Crypto, Futures)
- **Gap Handling:** Uses `barmerge.gaps_off` to fill data gaps during non-trading periods
- **Backtesting:** Uses `lookahead=barmerge.lookahead_on` for stable historical data without repainting
- **Data Continuity:** Automatically handles market closures, weekends, and extended hours
## Updates & Improvements
**Version 2.0 (Current):**
- ✅ Fixed alignment issues during extended hours and weekends
- ✅ Eliminated repainting in backtesting
- ✅ Added gap-filling technology for continuous display
- ✅ Improved data synchronization across all timeframes
- ✅ Enhanced NA value handling for data integrity
- ✅ Added advanced settings group for user control
## Support
For questions, suggestions, or feedback, please comment on the publication or message the author.
---
**Disclaimer:** This indicator is for educational and informational purposes only. It does not constitute financial advice. Past performance is not indicative of future results. Always perform your own analysis and implement proper risk management before making trading decisions.

CME Gap Finder - BTC (Adjustable TF)This is a CME Futures gap finder that has a variable timeframe. Great for finding long term trades or short term depending on the time frame. 1hr chart to 3 hr gaps. 4 hr chart to 3 day on gaps.