Linear Cross Trading StrategyLinear Cross Trading Strategy
The Linear Cross trading strategy is a technical analysis strategy that uses linear regression to predict the future price of a stock. The strategy is based on the following principles:
The price of a stock tends to follow a linear trend over time.
The slope of the linear trend can be used to predict the future price of the stock.
The strategy enters a long position when the predicted price crosses above the current price, and exits the position when the predicted price crosses below the current price.
The Linear Cross trading strategy is implemented in the TradingView Pine script below. The script first calculates the linear regression of the stock price over a specified period of time. The script then plots the predicted price and the current price on the chart. The script also defines two signals:
Long signal: The long signal is triggered when the predicted price crosses above the current price.
Short signal: The short signal is triggered when the predicted price crosses below the current price.
The script enters a long position when the long signal is triggered and exits the position when the short signal is triggered.
Here is a more detailed explanation of the steps involved in the Linear Cross trading strategy:
Calculate the linear regression of the stock price over a specified period of time.
Plot the predicted price and the current price on the chart.
Define two signals: the long signal and the short signal.
Enter a long position when the long signal is triggered.
Exit the long position when the short signal is triggered.
The Linear Cross trading strategy is a simple and effective way to trade stocks. However, it is important to note that no trading strategy is guaranteed to be profitable. It is always important to do your own research and backtest the strategy before using it to trade real money.
Here are some additional things to keep in mind when using the Linear Cross trading strategy:
The length of the linear regression period is a key parameter that affects the performance of the strategy. A longer period will smooth out the noise in the price data, but it will also make the strategy less responsive to changes in the price.
The strategy is more likely to generate profitable trades when the stock price is trending. However, the strategy can also generate profitable trades in ranging markets.
The strategy is not immune to losses. It is important to use risk management techniques to protect your capital when using the strategy.
I hope this blog post helps you understand the Linear Cross trading strategy better. Booost and share with your friend, if you like.
Search in scripts for "macd"

3Commas Bot DCA Backtester & Signals FREEThis is a DCA Strategy backtester + signals, built to emulate the 3Commas DCA bots. It uses your choice of 4 different buy signals, 2 of which can be adjusted in the settings. Everything is customizable so you can backtest specific settings with different buy signals and find the best performing strategy for your risk tolerance and capital. It can be used to backtest strategies on stocks as well, but just make sure your base order is larger than the share price for the entire backtesting range or it will not calculate properly.
You can use this template to code your own buy signals and then backtest them as a DCA strategy if you know some basic pine script.
The indicator shows all of your backtesting orders on the chart. The red line is your take profit level, the blue line is your average price level, the white line is your first order and the green lines are your average down orders. If you enable a stop loss in the settings your stop loss will be shown as an orange line once all of your average down orders have been hit, it will not be set until price has dipped below your covered trading range.
These levels update when things change during backtesting so you can visualize your strategy and how it would perform as well as see if your percentage deviation is large enough to cover dips. When backtesting trades are taken, the chart will show where they were taken(in backtesting) along with info on those trades such as the number each order is, the size of that order and the percentage deviation that order is from the initial buy.
SENDING SIGNALS TO 3COMMAS
Tradingview cannot sync this backtester to 3Commas and with the way alerts are setup for strategies on Tradingview, the best option for you to give signals to your bot would be to use this backtester to figure out what trigger you want to use and then setup that indicator separately to send alerts to your bot. All of the indicators used for signals in this backtester are available for free and can be configured to match this backtester and send alerts to 3Commas for you. Just make sure you set your alerts to once per bar close and don’t use less than a 15 second timeframe because then you could trigger the Tradingview threshold for alerts and get your alerts shut off.
You can also use this backtester with your own buy triggers if you know a little pine script. Just make copy of the script and code in your own buy signals and see how it backtests.
INFO PANEL FOR ANALYZING YOUR STRATEGY
The right hand side of the screen will show an info panel that shows a lot of different information so you can quickly see your bot settings and how it performed right on the screen.
In the top right corner you will see in purple your bot settings. These include your stoploss % if turned on, take profit %, average down order %, average down order % multiplier, volume multiplier, max number of orders allowed and size of your base order.
The top section of the first column “Current Trade” shows these stats: the open trade’s average price, the open trade’s take profit price, the open trade’s PNL, how far price is from your open tarde’s take profit level in percentage, your open position size and number of open orders.
The bottom section of the first column “Overall Performance” shows these stats: total number of trades taken during backtesting range, the largest amount of trades that were open at one time during backtesting, the max drawdown, the average number of bars per trade, gross profit, net profit, percent profit from your initial capital, current portfolio value and your initial capital.
CUSTOMIZABLE OPTIONS TO FIND THE PERFECT STRATEGY
Stoploss On/Off
This will turn your stoploss on or off. By default it is set to off and will not affect anything unless turned on.
Stoploss Percentage
This is the percentage below your final average down order price that will be set as a stoploss to keep your account from going too far in the red on big dips.
Take Profit Percentage - This is the percentage of profit you want the trade to hit before taking profit on your entire DCA trade. This level updates everytime you average down.
Average Down Percentage - This is the percentage that price has to drop from your initial order to initiate your first safety order. If the Average Down Percent Multiplier is set to 1 then this percentage will be the same for every average down order.
Average Down Percentage Multiplier - This multiplies your Average Down Percentage so each safety order needs a larger percentage deviation than the previous one. This keeps your buys closer together at the beginning and further apart when you hit more orders so you can extend your trading range but still be aggressive when price is going sideways.
Volume Multiplier Per New Order - This multiplies the size of each trade based on your base order. If you set it to a 2x multiplier then each average down order will be 2 times the size of the last one. So for example, a $100 base order with a 2x multiplier would have these values for the first 3 average down orders: 200, 400, 800.
Size Of Base Order - This is the size of your first position entry and will be used as a starting point for the volume multiplier. If your base order is $100 then it will buy $100 worth of whatever crypto you are backtesting this on. If you are looking at stock charts, you need to make sure your base order is higher than the share price across the entire backtesting range or it will not perform correctly.
Max Number Of Orders - This is the maximum number of orders the bot can take, including your base order. Adjust this to suit the amount of capital you are willing to allocate to your bot based on how much money it will require to run according to your bot settings.
TIPS ON HOW TO USE FOR BEST RESULTS
If you don’t have a lot of capital to work with, then use longer timeframes with a reasonable take profit percentage so that you don’t need a lot of average down orders. You can also try keeping the volume multiplier close to 1.
You can use the 3Commas dca bot settings page to see how much capital you will need for your strategy if you match it to the settings you have on this indicator. You can also check to see how much of a percentage deviation your bot is covering to make sure you have a reasonable range to trade in and orders to cover big dips. You can also check your coverage by seeing how far down the chart the green lines cover, which are your average down orders.
Make sure the initial capital in the properties tab of the settings has enough to cover all of your orders otherwise you will get unrealistic backtesting results. Also, make sure you leave the order size in the properties tab on contracts so it calculates your trades correctly. The only settings you need to touch in the properties tab is the initial capital. Unless you are trading somewhere that has lower commission fees, then you can change that to match, but leave all the other settings as is for it to function properly.
Increasing the volume multiplier will make your average price and take profit target follow the price action a lot closer as price falls, but it can also lead to having very large orders very quickly once you get into the 1.5-3x multiple range. Try using a high volume multiplier with less safety orders and you will get better results, however you need to have money on the sidelines to add on major dips to keep your bot turning a profit. Be very careful with this as greed and impatience will hurt your overall performance. This bot is meant to make money with lots of small wins so don’t get greedy and make sure you have enough money to cover large dips. If you are being aggressive with your bot, then I recommend only using 25% or less of your portfolio to trade aggressively and then use the smart trade feature on 3commas to add chunks of funds to your trades when price dips below your last safety order. Or if you want it to run without any supervision, then use lower volume multipliers and have lots of safety orders that can cover entire bear markets and still keep buying lower.
It’s a good idea to have some capital on the sidelines that you can add in when price dips quickly. This will help lower your average price and allow your bot to get out in profit quicker. 3Commas bot has a smart trade feature that will allow you to track your average price when adding extra funds and it will automatically update your other orders which is very convenient. Look at the longer timeframes when price dips and only add chunks at major areas where price is very likely to bounce. Or you can be aggressive when trading and add to your position when price dips and is at a likely bounce zone to maximize profits.
Only trade coins that have a good amount of liquidity as the larger your orders get, the harder it will be to sell if there isn’t much liquidity. Also, beware of how large your first order is as it will usually be a market order and can move the market if there is not much liquidity.
Since this bot takes a lot of trades and performs best when taking small profits consistently, you will need to factor in exchange fees. The bot is set to .5% commission(you can change this) on the buy and sell orders as most exchanges charge that amount. Some exchanges offer no fee trading on certain coins so be sure to look around for those so you can keep the commissions and maximize profits.
I strongly encourage you to try out a lot of different setting combinations across multiple different coins and do it across a few months to see how it would have performed under various market conditions. This will help you get a better idea of how much of a percentage deviation you’ll need to be able to cover to keep your bot running and making constant profits. You can also use the deep backtesting feature of the strategy panel to see how it would have done, but just beware that the info panel of the indicator will not reflect deep backtesting results, only the normal backtesting range.
MARKETS
This backtester can be used on any market including crypto, stocks, forex & futures. You just need to make sure your base order is larger than the share price when using this on things besides crypto.
TIMEFRAMES
This backtester can be used on all timeframes.

Take Profit On Trend v2 (by BHD_Trade_Bot)The purpose of strategy is to detect long-term uptrend and short-term downtrend so that you can easy to take profit.
The strategy also using BHD unit to detect how big you win and lose, so that you can use this strategy for all coins without worry about it have different percentage of price change.
ENTRY
The buy order is placed on assets that have long-term uptrend and short-term downtrend:
- Long-term uptrend condition: ema200 is going up
- Short-term downtrend condition: 2 last candles are down price (use candlestick for less delay)
CLOSE
The sell order is placed when take profit or stop loss:
- Take profit: price increase 2 BHD unit
- Stop loss: price decrease 3 BHD unit
The strategy use $1000 for initial capital and trading fee is 0.1% for each order.
Pro tip: The 1-hour time frame for ETH/USDT has the best results on average.

Strategy - Trend Chaser - PSeTrend Chaser for Philippine Stock Exchange - LONG ONLY
-Elvin Kennedy Latayan 2022

3C Crossover with TTP & TSLThis is not a set and forget strategy. It needs constant tweaking to maintain a high winrate. Also what works on one pair can be horrible on another.
This strategy works best on the 1 min or 5 min TF but also works well on the 15 min. Haven't done any testing in higher TF's as im only interested in scalping.
If enabled you can retrive data for the filters on any TF.
The strategy do not repaint.
You do not need a 3c subscription to run this strategy as the bot turns on and off the bot itself.
Instructions for the 3commas connector:
1. First, you need to prepare 3commas Long/Short bots that will only listen to custom TV signals.
2. Inputs for the 3commas bot can be found at the end of the user inputs.
3. Once you have entered the required details into the inputs, turn on 3commas comments. They should appear on the chart (looks messy).
4. Now you can add the alert where you should paste the 3commas Webhook URL: 3commas.io
5. For the alert message text insert the placeholder {{strategy.order.comment}} and delete the rest. 6. Once the alert is saved, you can turn off those 3commas comments to have a clearer chart.
7. With a new alert, the bot and trade should launch.
Long or Short trades are determined with a crossing of the fast MA over the slow MA for Long and the opposite for Short. By checking Close position on MA cross the deal will close on a crossover/under of the 2 MA's
You can select from various different MA's and of course lenghts. You can add both EMA filter on any lenght aswell as ATR to determine to go long or short.
Using the MA gap can help you to not enter trades in a low volatile ranging market.
The RSI filter, sets the maximum RSI threshold for a long position and the minimum for a short. By default and what i recomend is that you enter Longs when RSI is above 50 and shorts when RSI are below 50.
-You can set confirmation of the trade direction with RSI , i.e. for Long the RSI must rise a specified number of bars back, vice versa for Short.
Enabling the pullback filter is great to avoid Longing tops and Shorting bottoms.
Stop loss can be set be either a fixed percentage or by using ATR
Take profit can be set by using percentage, ATR or RiskReward ratio(RR). if you use ATR as a stoploss i recomend using RR as the TP.
Yu can choose to trail the TP with either Percentage or ATR
Whats ahead. I really want to incorporate RSI divergencies, but haven't figured out how yet. Any other ideas would be greatly appreciated.
Have a look at my other strategies. They are similar to this but works abit differently.

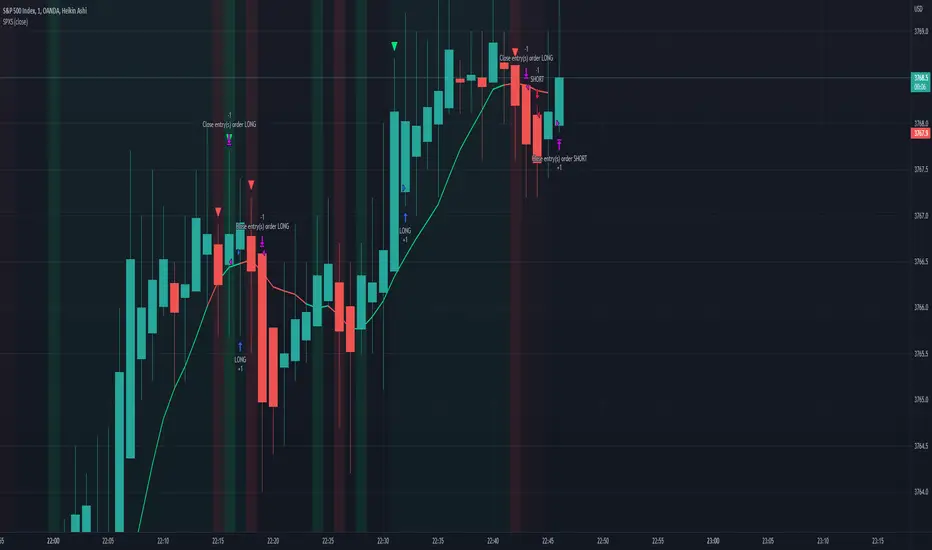
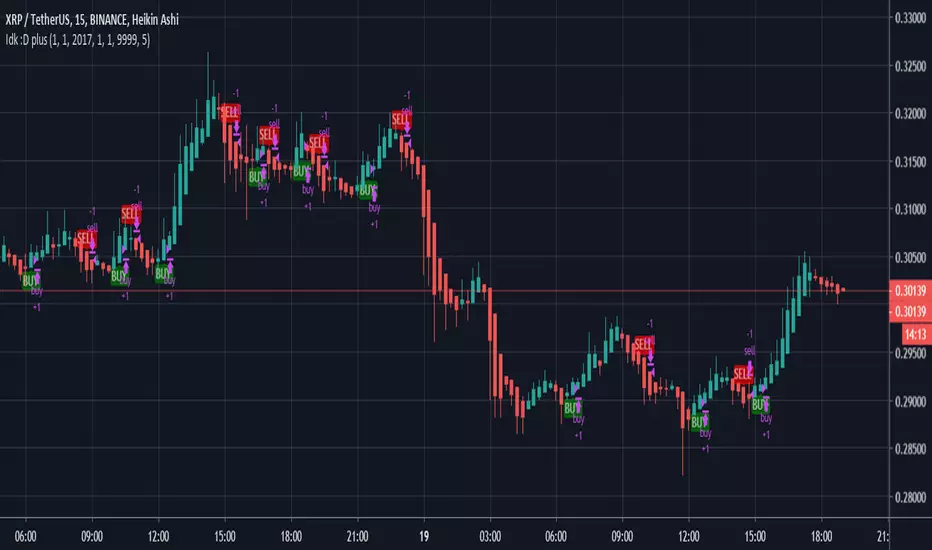
SPX Scalping StrategyThis strategy points out good entries and exits to go with the direction of SPY
Used with:
Ticker: SPX 500 USD
Heiken Ashi Candles
1, 3, 5 min timeframe
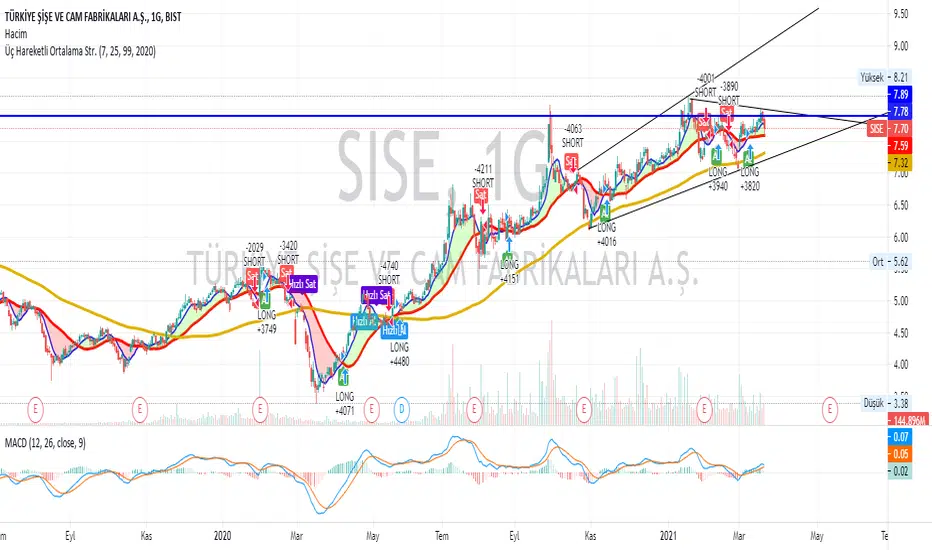
Three moving average strategies
If the short term (Default 7) moving average cuts the medium term (default 25) moving average, BUY. Conversely, it generates the SELL signal. If the long term (Default 99) moving average cuts its short term moving average, Quick SELL. Conversely, it can be interpreted as Fast SELL. You can change the moving average and the number of days as you wish, and you can trade in the short or long term. I hope it was useful.
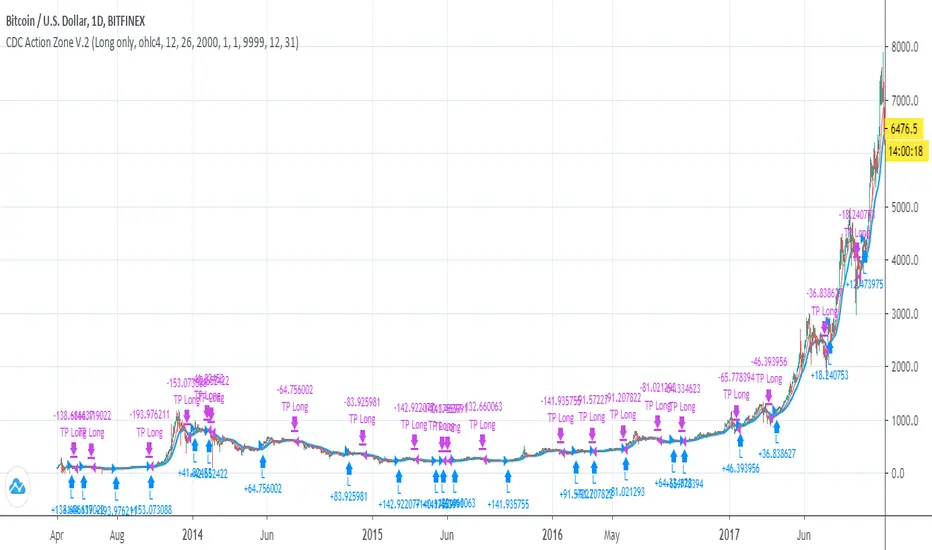
CDC Action Zone V.2 Strategy BacktestPublished for backtest purpose
All credit to : CDC Action Zone V.2 by piriya33
จัดทำขึ้นเพื่อการดูผล Backtest เขียวซื้อแดงขาย
ตัวสคริปท์มีการเพิ่ม
- Strategy Long/Short/Both // ปรับได้ใน Setting
- Back test range // ปรับได้ใน Setting


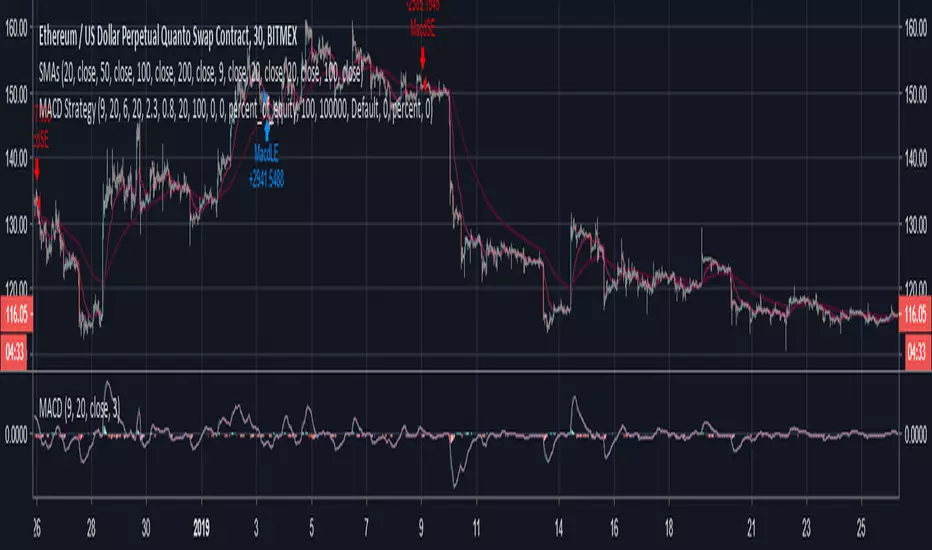

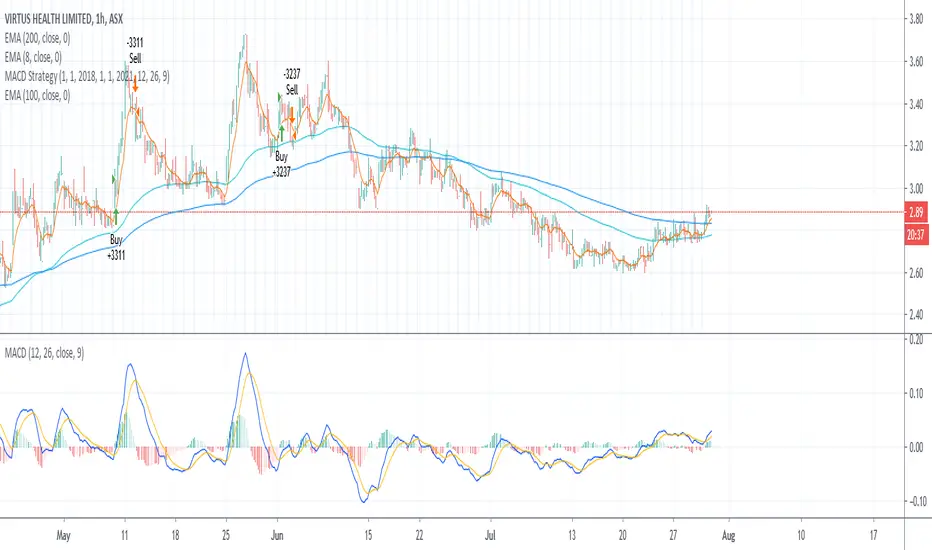
MACD and RSI Long/Short Strategy v0.1 by MoppleHello,
It is my first script. I would like to share it with you people. It is not the best one, but maybe someone needs it. It is version v0.1

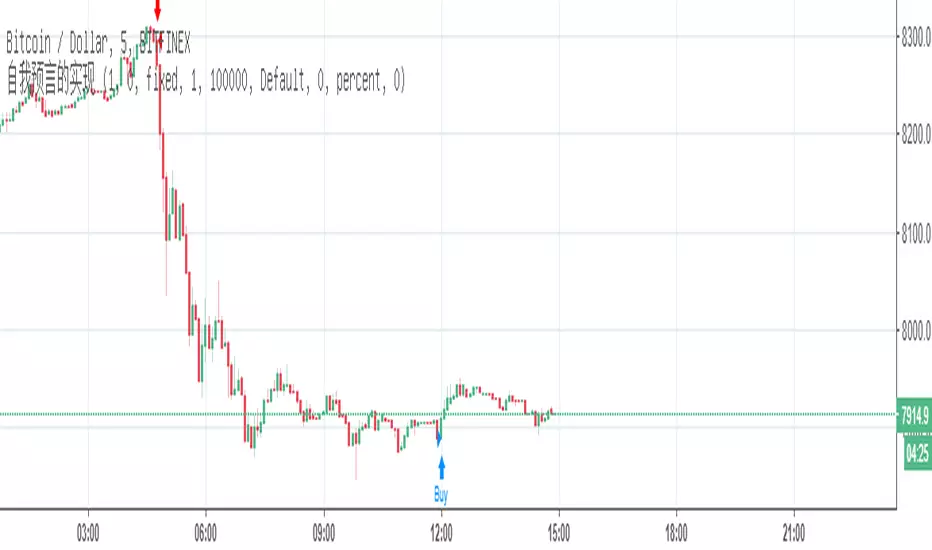
自我预言的实现|The realization of self prophecy这是一个自我预言实现的脚本策略,不会产生重画现象,未调用平台内置函数,纯算法实现
---------------------
This is a self scripting script strategy, which does not generate repainting, and does not invoke the built-in functions of the platform.

PTStratX - Multi Oscillator AddonPTStratX - Multi Oscillator Addon
The PTStratX multi period oscilator is the perfect complement to visually set and optimize the indicators used in PTStratX
Please visit ptstratx.com for further information.


