MACD SIGNAL & MACD DIVERGENCE REGULAR & HIDDEN You can find 2 signals Fast MACD Cross Signal and Divergence MACD Signal Hidden & Regular
like comment and i will add your user name to try it
Enjoy xD
Search in scripts for "macd"

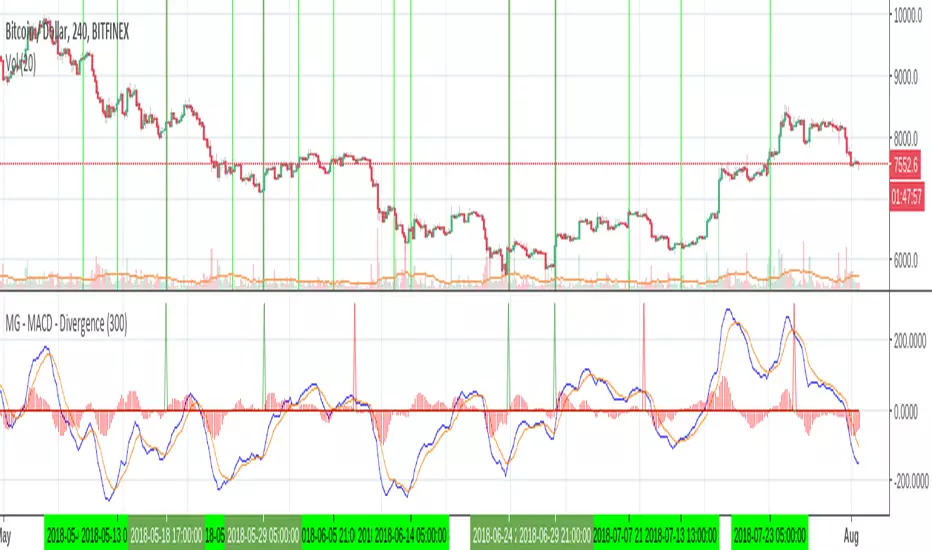
MG - MACD - Divergence - 1.0The MACD indicator can produce some powerful divergence signals which can be useful confirmation for entering / exiting a trade.
This indicator generates and alert and plots (if enabled), when a divergence is detected. For example, if bullish (above zero) and two bearish MACD crosses are detected with the second being lower than the first, a bearish divergence alert is triggered. Theoretically a good place to take profit / possibly enter a short position if you have further confirmation.
Can also be configured to include continuation signals i.e. a bullish trend with two bullish MACD crosses where the second is higher than the first. This could indicate more bullish action ahead.
In order to illustrate how this indicator helps to sift out a good amount of false signals, I have highlighted in the above image in dark green, all of the divergence buy signals highlighted by the indicator and in light green, the rest of the MACD buy signals.
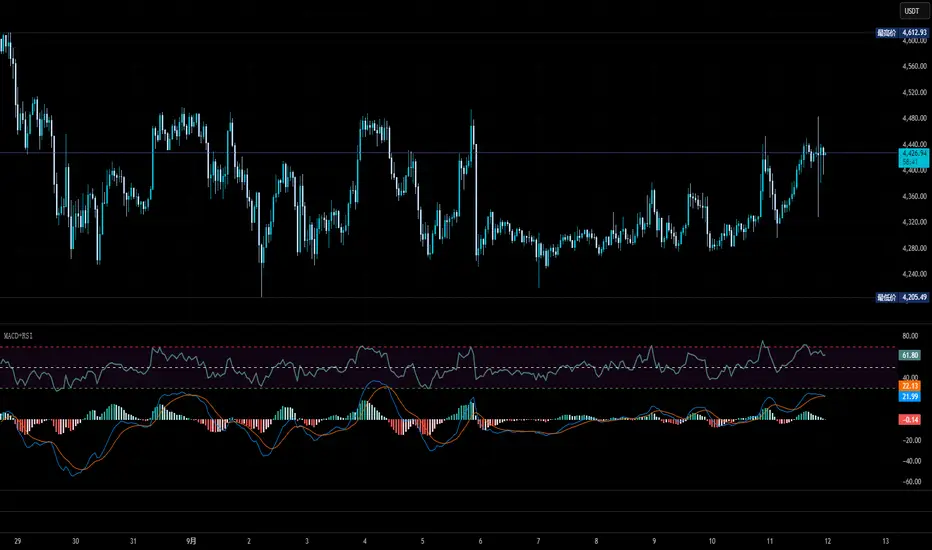
MACD+BB (SH v1.1)Twitter: @DrSHelmet. All credit and thanks to @cryptobiasfunke for this strategy.
Disclaimer: I take no responsibility for your usage of this indicator.
Description:
Indicator version: 1.1
This custom script plots the MACD histogram, applies Bollinger bands to the histogram, and then colours the Bollinger bands in different colours depending on whether the bands are contracting or expanding.
Suggested strategy:
Periods of low volatility, seen in a Bollinger band pinch, are followed by large moves (BB expansion). A contraction of the MACD BB may similarly precede a significant move in price. This indicator allows you to see when such a move may be starting, by watching for colour change (default: blue-->orange) on the BB lines after a BB pinch has occured. If the MACD histogram is increasing in magnitude and surfing the BB in a certain direction, this suggests a price move is starting in the direction of the histogram.
Intended for short-timeframe scalping (<1hr charts), but initial testing suggests some validity on higher timeframes.

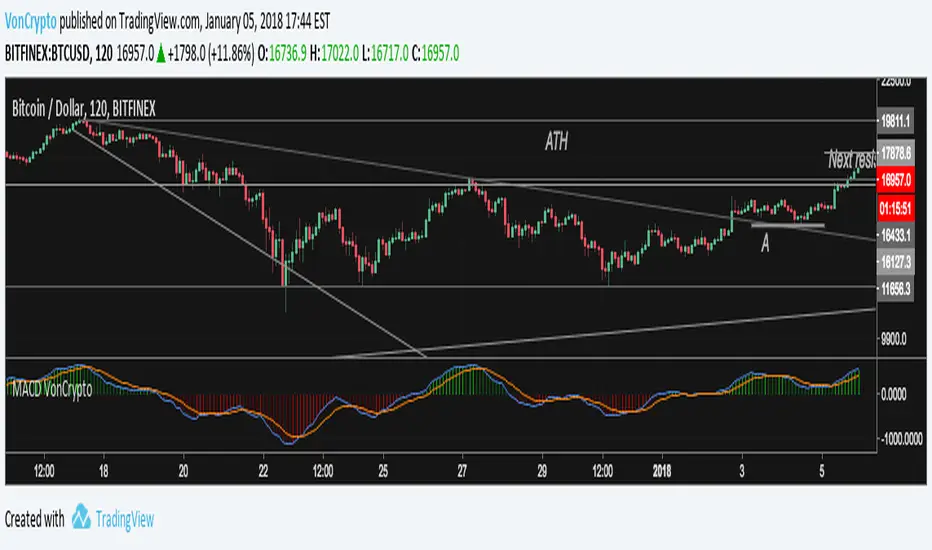
VC_ Coloured MACDMACD VonCrypto
Combined MACD and MACD 4C indicators to give quick visual of MACD position. My personal defaults are, remove histogram, set lines to thinest setting, make MACD lines 100% opaque, light blue and orange.
Modified MACDThis is a modified version of the MACD (Moving Average Convergence/Divergence) oscillator. Instead of using exponential moving averages this modified version make use of simple moving averages. The default periods for this modified version of MACD is 3/10/16. This modified version of the MACD oscillator is described in detailed in Appendix B in the book The Art and Science of Technical Analysis: Market Structure, Price Action and Trading Strategies by Adam Grimes.

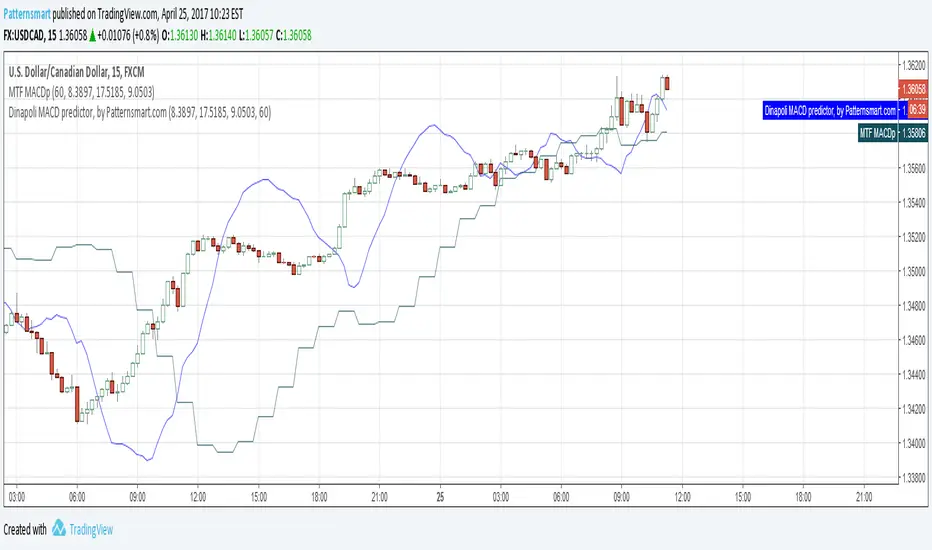
MTF Dinapoli MACD predictor V2This is the Multi Time Frame version of Dinapoli MACD predictor indicator
Fixed a bug of previous version.
Dinapoli macd predictor is a trending indicator that give you not only what direction a forex pair is moving but also how volatile the price is. When the Forex market starts giving new max or minimum level values, the Dinapoli macd predictor follows the price trend direction and pullsup the level of quit from the currency market . Stops should be applied where they are for a purpose, and in that case, should not be changed.
The whole idea behind a practical trading plan is to keep it as simple as possible.
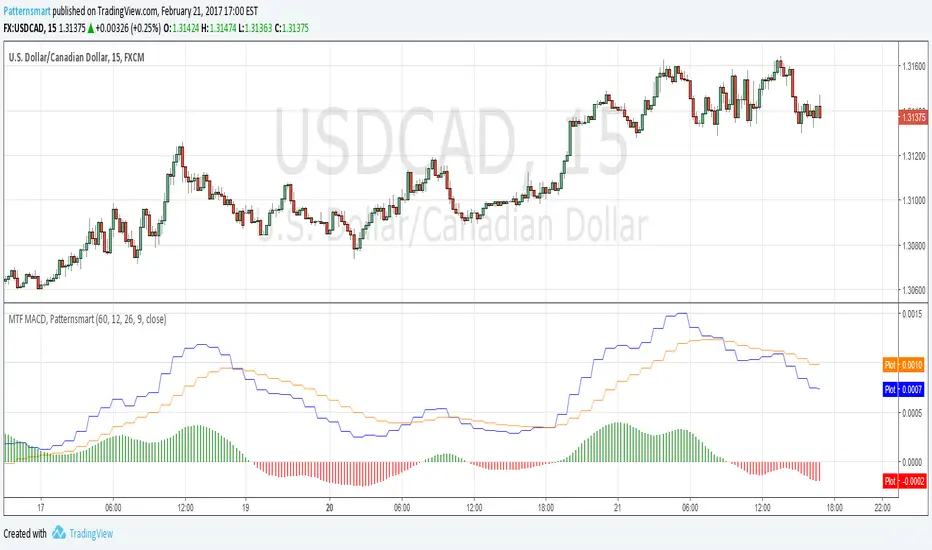
Multi time frame (MTF) MACD indicator by PatternsmartThe real Multi time frame (MTF) MACD indicator.
It simply makes possible for you to read MACD value from higher timeframes.
It also comes with the original MACD inputs.
MACD Divergence MultiTimeFrame [FantasticFox]This is a MACD divergence on 3 time-frames, 1h, 4h and 1D.
Please insert the indicator into a 1h chart, otherwise change the lengths' inputs.
you will see H1,H2, H3, R1, R2 and R3 in green and maroon colors.
H means hidden divergence, 1 regards to 1h, 2 to 4h, and 3 to 1D. If the color is green, its bullish, and if its maroon the divergence is bearish.
Gray circles on 4h macd is for those traders who want to check the confirmation on Elliott wave changes.
*Thanks to RicardoSantos MACD divergence.


MACD Bullish Divergence + Multi-TF RSI Buy SignalsNew script to overlap MACD Bullish Divergence and RSI signals to give confluence.

THE TRINTY - Multi-Timeframe MACD Alignment (Single Alert)Analyzes up to 3 timeframes at the same time waiting for MACD alignment plus determines when it's very bullish, very bearish, or just mixed. Ideal for traders who only want to trade in high probability markets to increase your chances at success. Also, there's only 1 single alert system that you can set for each pair making things much easier instead of setting separate bullish and bearish alerts like most other indicators.

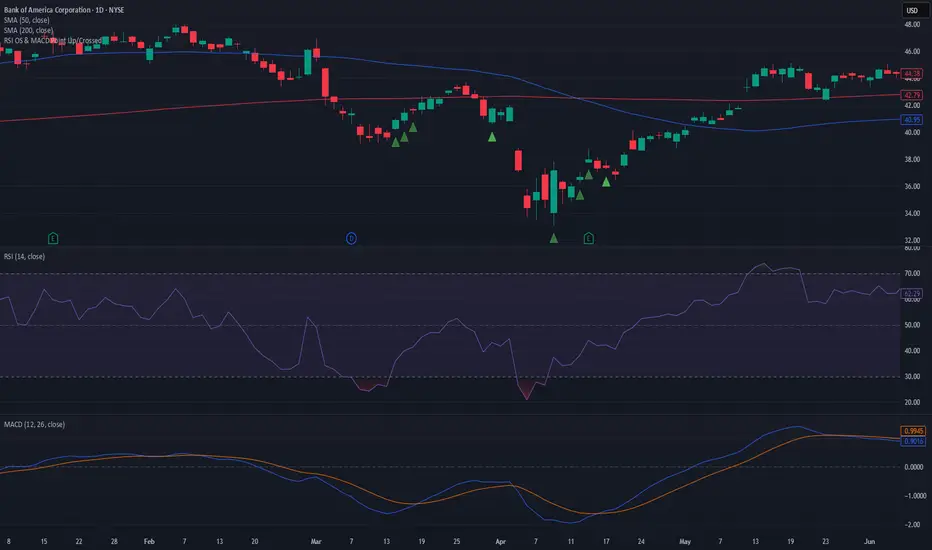
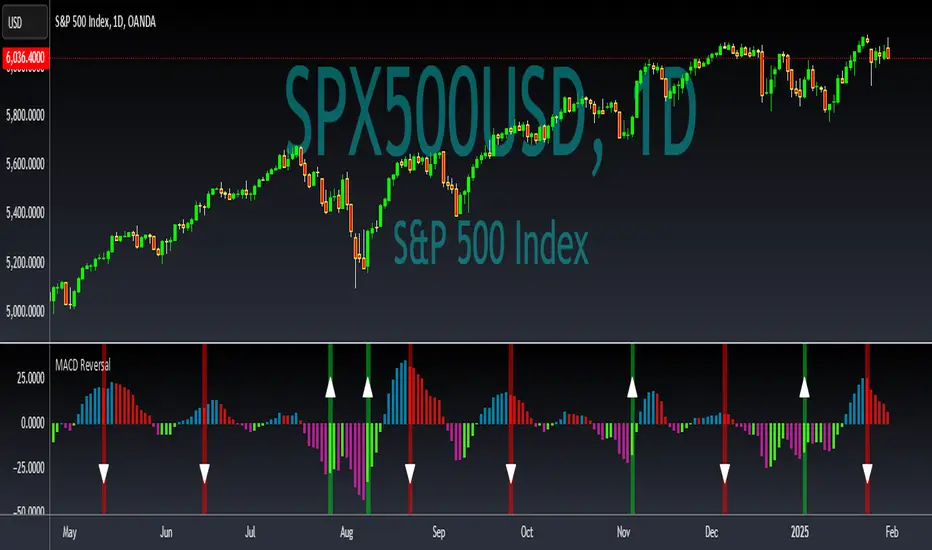
Early MACD Reversal IndicatorThis indicator should provide early warnings of potential price reversal based on the difference between the MACD and its signal line. The keys of the reversal come from creating a histogram of the difference between the two lines and further monitoring the first indications of breadth decrease. The first change when trending up will paint a red vertical line and downward triangle to indicate potential trend reversal to the low side. The opposite with a green vertical line and upward triangle signals potential upside movement soon.
Enjoy!
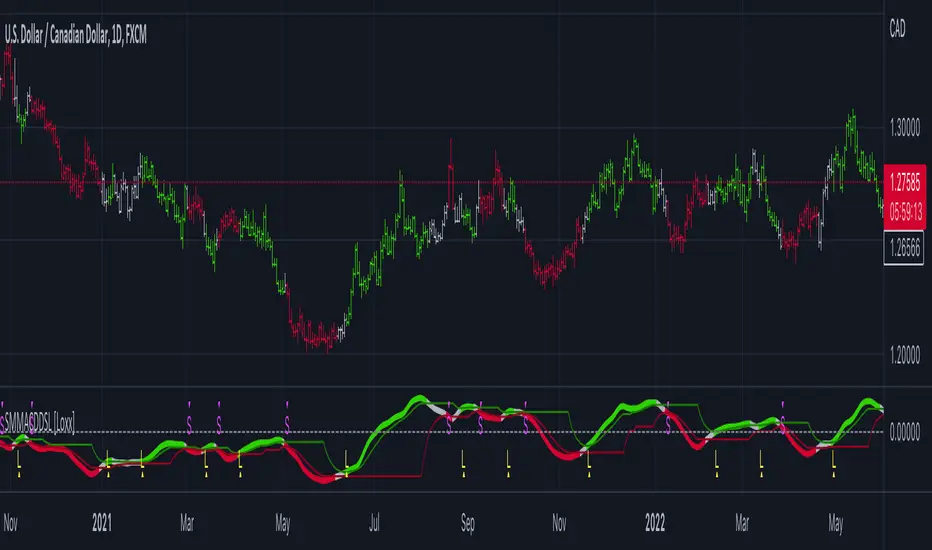
Smoother Momentum MACD w/ DSL [Loxx]Smoother Momentum MACD w/ DSL uses two different EMA calculations to derive momentum and then calculates the MACD between those momentum outputs. This indicator uses a variation of Discontinued Signal Lines for the breakout/breakdown/reversal signals . There are three different signal types: middle, levels, and slope. I've also added alerts and signals. The discontinued signal lines can be smoothed using EMA or Fast EMA.
What are DSL Discontinued Signal Line?
A lot of indicators are using signal lines in order to determine the trend (or some desired state of the indicator) easier. The idea of the signal line is easy : comparing the value to it's smoothed (slightly lagging) state, the idea of current momentum/state is made.
Discontinued signal line is inheriting that simple signal line idea and it is extending it : instead of having one signal line, more lines depending on the current value of the indicator.
"Signal" line is calculated the following way :
When a certain level is crossed into the desired direction, the EMA of that value is calculated for the desired signal line
When that level is crossed into the opposite direction, the previous "signal" line value is simply "inherited" and it becomes a kind of a level
This way it becomes a combination of signal lines and levels that are trying to combine both the good from both methods.
In simple terms, DSL uses the concept of a signal line and betters it by inheriting the previous signal line's value & makes it a level.
Included:
Loxx's Expanded Source Types
Alerts
Signals
Bar coloring
Other momentum indicators
CFB-Adaptive Velocity Histogram
Variety-Filtered, Squeeze Moving Averages
William Blau Ergodic Tick Volume Indicator (TVI)
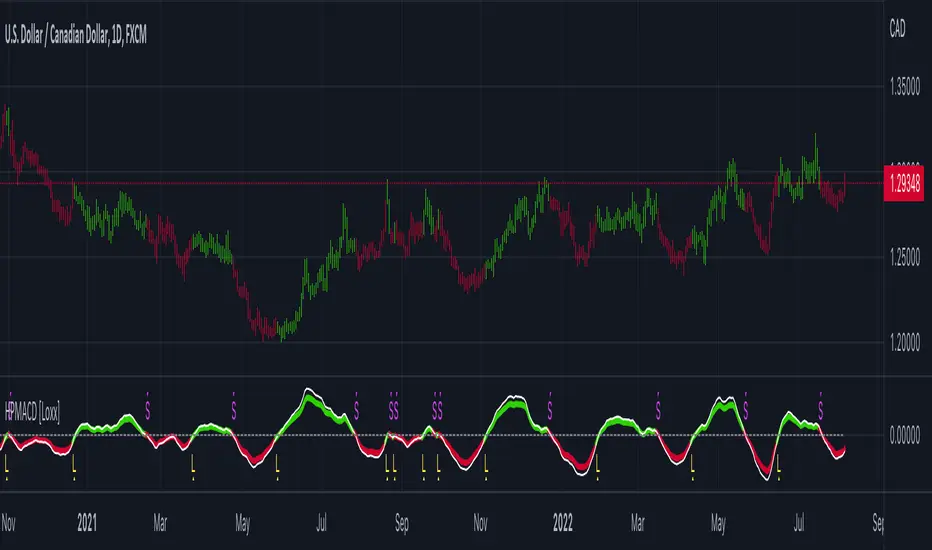
Hodrick-Prescott MACD [Loxx]Hodrick-Prescott MACD is a MACD indicator using a Hodrick-Prescott Filter.
What is Hodrick–Prescott filter?
The Hodrick–Prescott filter (also known as Hodrick–Prescott decomposition) is a mathematical tool used in macroeconomics, especially in real business cycle theory, to remove the cyclical component of a time series from raw data. It is used to obtain a smoothed-curve representation of a time series, one that is more sensitive to long-term than to short-term fluctuations. The adjustment of the sensitivity of the trend to short-term fluctuations is achieved by modifying a multiplier Lambda.
The filter was popularized in the field of economics in the 1990s by economists Robert J. Hodrick and Nobel Memorial Prize winner Edward C. Prescott, though it was first proposed much earlier by E. T. Whittaker in 1923.
There are some drawbacks to use the HP filter than you can read here: en.wikipedia.org
Included
Bar coloring
3 types of signals
Alerts
Loxx's Expanded Source Types
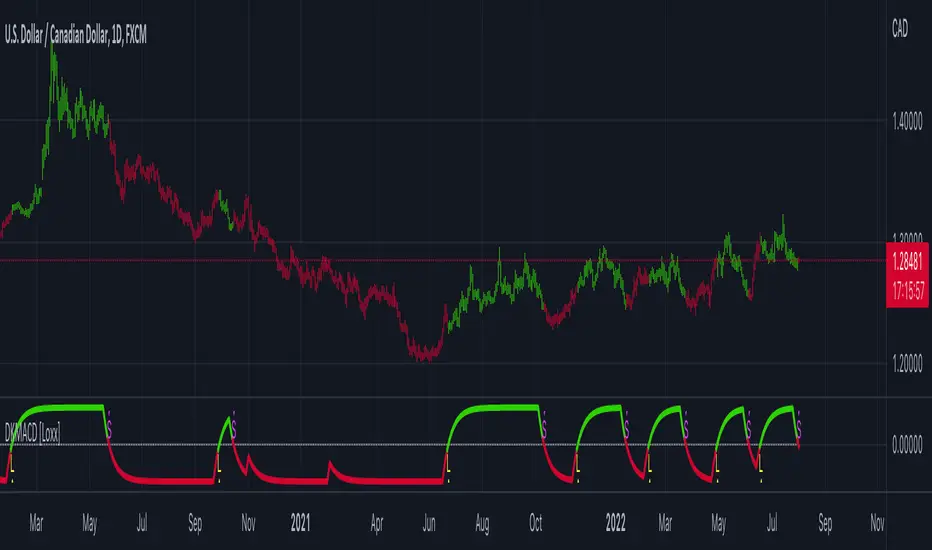
Digital Kahler MACD [Loxx]Digital Kahler MACD is a MACD indicator that uses an extreme noise reduction algorithm by Philipp Kahler. For our purposes here, we call it Digital Kahler.
What is Digital Kahler?
From Philipp Kahler's article for www.traders-mag.com, August 2008. "A Classic Indicator in a New Suit: Digital Stochastic"
Digital Indicators
Whenever you study the development of trading systems in particular, you will be struck in an extremely unpleasant way by the seemingly unmotivated indentations and changes in direction of each indicator. An experienced trader can recognise many false signals of the indicator on the basis of his solid background; a stupid trading system usually falls into any trap offered by the unclear indicator course. This is what motivated me to improve even further this and other indicators with the help of a relatively simple procedure. The goal of this development is to be able to use this indicator in a trading system with as few additional conditions as possible. Discretionary traders will likewise be happy about this clear course, which is not nerve-racking and makes concentrating on the essential elements of trading possible.
How Is It Done?
The digital stochastic is a child of the original indicator. We owe a debt of gratitude to George Lane for his idea to design an indicator which describes the position of the current price within the high-low range of the historical price movement. My contribution to this indicator is the changed pattern which improves the quality of the signal without generating too long delays in giving signals. The trick used to generate this “digital” behavior of the indicator. It can be used with most oscillators like RSI or CCI.
First of all, the original is looked at. The indicator always moves between 0 and 100. The precise position of the indicator or its course relative to the trigger line are of no interest to me, I would just like to know whether the indicator is quoted below or above the value 50. This is tantamount to the question of whether the market is just trading above or below the middle of the high-low range of the past few days. If the market trades in the upper half of its high-low range, then the digital stochastic is given the value 1; if the original stochastic is below 50, then the value –1 is given. This leads to a sequence of 1/-1 values – the digital core of the new indicator. These values are subsequently smoothed by means of a short exponential moving average. This way minor false signals are eliminated and the indicator is given its typical form.
Included:
Bar coloring
Signals
Alerts
Loxx's Expanded Source Types
Loxx's Moving Averages
Sherry on Crypto - MACD ScalpingThis indicator is originally made by someone else, I just modified it to increase its win rate.
How to use this indicator?
Step 1: This indicator only works in 5 minutes timeframe (BTC) . Apply 5 minutes timeframe in Tradingview.
Step 2: Apply 2 EMA(s), 1st EMA length 50, 2nd EMA length 200.
Step 3: Draw support and resistance and understand price action as well.
Step 4: Use RSI along with this indicator.
Strategy: When you see a down tick on the MACD in 5 minutes timeframe,
you are allow to take a long position. When you see an up tick on the MACD in 5 minutes timeframe, you are allow to take a Short position,
but RSI should be Included (you can do your own settings of RSI).
Recommended TP 0.50 and SL 0.40.

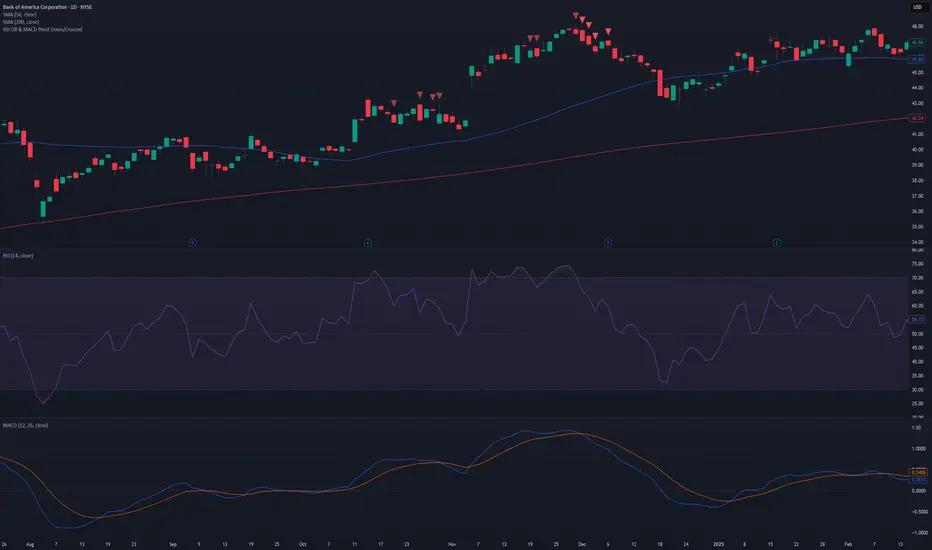
TUE ADX/MACD Confluence V1.0The ADX and MACD confluence can be a powerful predictor in stock movements. This script will help you find those confluences in an easy to understand visual manner.
It includes Buy and Sell signals for detected confluences, and will show colored candles to help you determine when to exit a trade. When the candles turn to white that means the detected confluence is no longer in play and you may want to consider a trailing stop loss.
The Buy and Sell signals will display on the first occurrence of each confluence.
It's important to understand that both of these are lagging indicators, but with a careful attention to your stoploss you can easily generate a positive profit factor.
This code is provided open source and you're free to use it for any purpose other than resale.

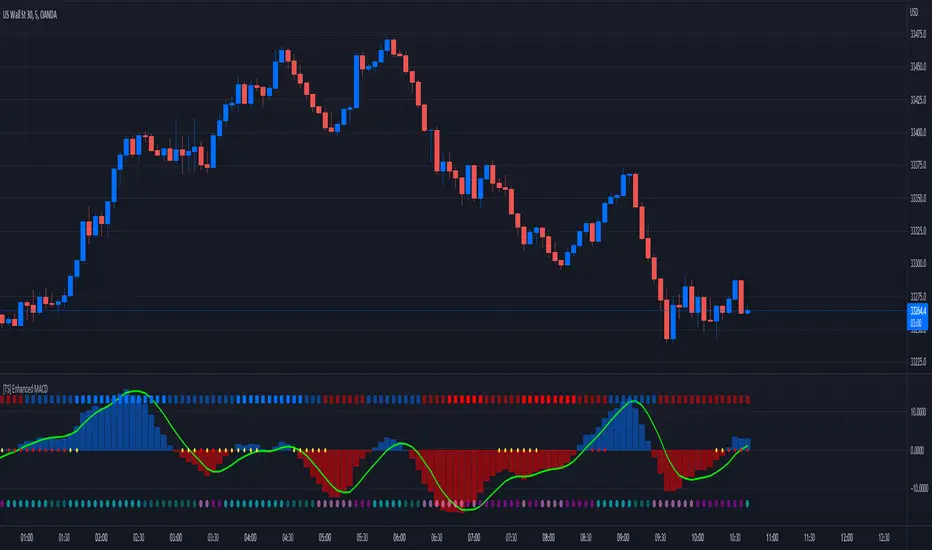
[TS] Enhanced MACDThis is an Enhanced version of the standard MACD Indicator.
It displays the MACD Histogram as a normalized oscillator for a better visual representation (With values between -100 to 100)
On the top we have the WaveTrend indicator, showing the general trend of an asset (4 Color codings)
On 0 line, with red and yellow circles, is displayed the Contraption (or so-called Squeeze) of the price action.
When these circles appear a major shift in trend is expected.
On the bottom, we have another set of circles, which measure the price compression - These signal a period of very low price volatility.
Predictive MACDThis is MACD indicators have display prediction of next 3 bar which if close price not change or price move following directions of momentum this indicators will show how price will move next 3 bar.

DiNapoli MACD Predictor TableThis indicator displays a table containing the MACD Predictor states from Higher Timeframes: a green background denotes a bullish predictor in that particular timeframe, and a red one denotes a bearish predictor.
Only Higher Timeframes states do appear in the table. Lower Timeframes are grayed out, due to inability to get reliable results for such behaviour in current Tradingview environment.
The position of the table can be customized through the input panel.
Note: The indicator is resource hungry, and sometimes it might need some seconds to fully populate the table.
