WMA + MACD strategy with trailing stopHi!
That's my first strategy. I already learn pine, so i will work on it more. Now i search how to make trailing stop working.
"WMA + MACD strategy with traiing stop" is very simple strategy which is designated for stocks market. It is created only to take long positions.
Buy signal is when WMA(120) is below price and macd(10,20,10) histogram is higher than 0.
Position should be automaticly closed when price hits stoploss level.
One transaction should be max 20% of our capital and stoploss is set 3% lower than last closing price.
Search in scripts for "macd"

Simple Alt Coin Strategy - EMA and MACD w/Profit and StopThis script prints BUY and SELL signals based on settings you input. I use it to save time while scrolling through charts deciding what alts I want to look at.
BUY SIGNALS
Positive EMA Crossover
Positive MACD Crossover
Single Candle Gains
SELL SIGNALS
Profit Capture
Stop Loss
I don't trade based just on the BUY or SELL from this strategy, but I have found that these indicators do very well well looking at the large cap alt coins. It backtests well.
Default Settings EMA 5/12/50, MACD 9/12/26, Single Candle Gain 10%, Stop 10%, Profit Capture 45%

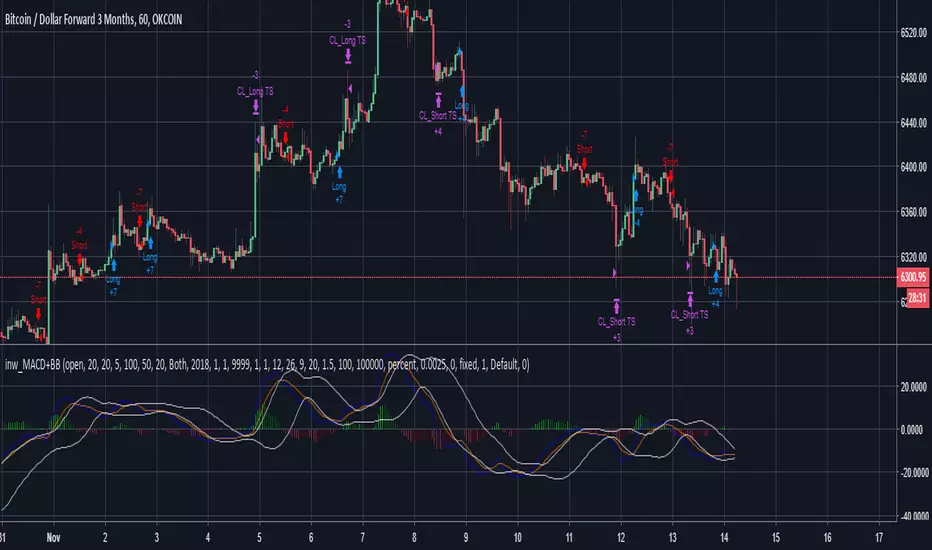
inwCoin MACD + BB Cross StrategySimple yet effective strategy by using MACD and BB the MACD line then cross it for short/long entry.
This strategy using trailing stop to exit position.
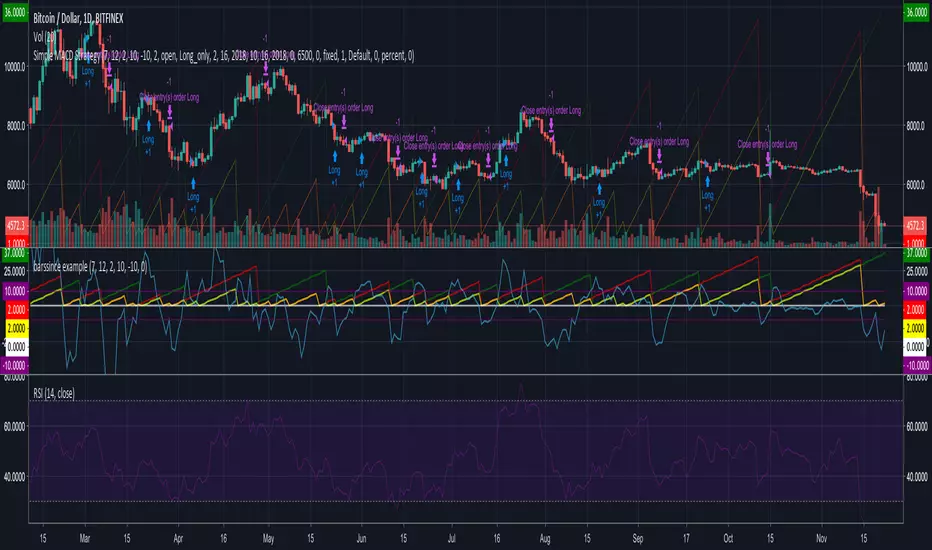
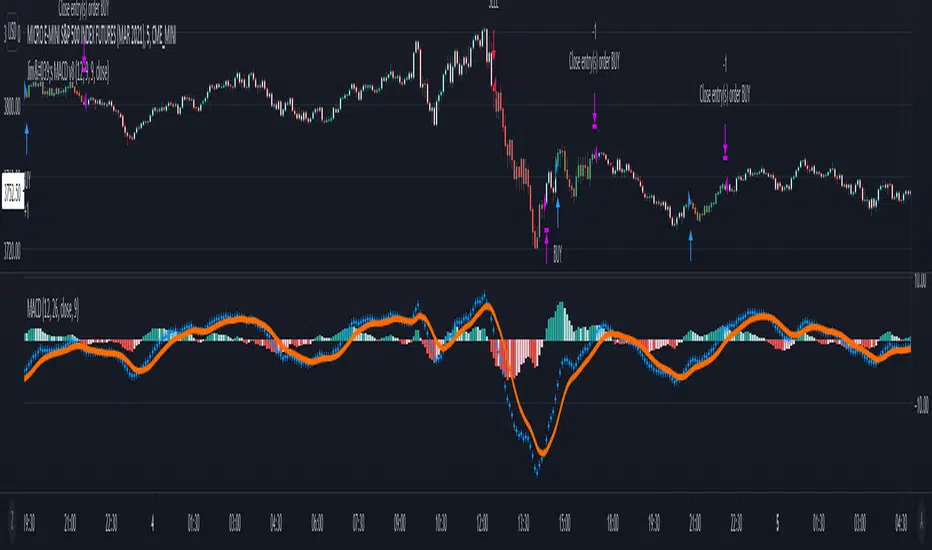
Simple MACD StrategyThis simple MACD strategy takes in account a given a time frame and the basic MACD parameters ( short, long, signal values).
The current implementation does not takes persistance or thresholds in accounts.
LFH/ Long positions using MACD histogram, long EMA and short EMADisclaimer: I'm a noob.
Hey there!
I'm trying to implement a script which enter market long position when long EMA crossover short EMA and MACD histogram is positive and histogram at T time is lesser than histogram at T-1.
And when short EMA crossover long EMA, plus MACD histogram is negative and histogram at T is greater than histogram at T-1, I want the script to exit market long position.
Now, I have something pretty close to what I am looking for. What I am missing and can't figure out yet is:
How to moderate entries, ie. I would like it to enter positions when trends are really interesting not just every time the conditions are fulfilled (same for exits) as there is way too much positions
I need to find a way to exit appropriated positions.


ComiCo - Joel on Crypto - MACD ScalpingThis is a modified (hopefully improved) version of the "Joel on Crypto - MACD Scalping" indicator. It got turned into a strategy, and added some extra filters, like number of trades after EMA cross, minimal EMA distance (EMA 50's distance from the EMA 200). It is just an experiment to see how good this scalping strategy can get.
Play around with it and let me know if you found good settings, or just have a comment on it.
I could get fairly good results on BTCUSDT 5m with these settings (all others left on default values):
Ticks Avg. Multiplier = 1.4
Max trades after EMA cross = 16
Limit Price Difference = 0
Take Profit = 0.0065
Stop Loss = 0.0085
Min EMA difference = 110
Pyramiding = 3

Customizable Non-Repainting HTF MACD MFI Scalper Bot StrategyThis script was originally shared by Wunderbit as a free open source script for the community to work with.
WHAT THIS SCRIPT DOES:
It is intended for use on an algorithmic bot trading platform but can be used for scalping and manual trading.
This strategy is based on the trend-following momentum indicator . It includes the Money Flow index as an additional point for entry.
HOW IT DOES IT:
It uses a combination of MACD and MFI indicators to create entry signals. Parameters for each indicator have been surfaced for user configurability.
Take profits are fixed, but stop loss uses ATR configuration to minimize losses and close profitably.
HOW IS MY VERSION ORIGINAL:
I started trying to deploy this script myself in my algorithmic trading but ran into some issues which I have tried to address in this version.
Delayed Signals : The script has been refactored to use a time frame drop down. The higher time frame can be run on a faster chart (recommended on one minute chart for fastest signal confirmation and relay to algotrading platform.)
Repainting Issues : All indicators have been recoded to use the security function that checks to see if the current calculation is in realtime, if it is, then it uses the previous bar for calculation. If you are still experiencing repainting issues based on intended (or non intended use), please provide a report with screenshot and explanation so I can try to address.
Filtering : I have added to additional filters an ABOVE EMA Filter and a BELOW RSI Filter (both can be turned on and off)
Customizable Long and Close Messages : This allows someone to use the script for algorithmic trading without having to alter code. It also means you can use one indicator for all of your different alterts required for your bots.
HOW TO USE IT:
It is intended to be used in the 5-30 minute time frames, but you might be able to get a good configuration for higher time frames. I welcome feedback from other users on what they have found.
Find a pair with high volatility (example KUCOIN:ETH3LUSDT ) - I have found it works particularly well with 3L and 3S tokens for crypto. although it the limitation is that confrigurations I have found to work typically have low R/R ratio, but very high win rate and profit factor.
Ideally set one minute chart for bots, but you can use other charts for manual trading. The signal will be delayed by one bar but I have found configurations that still test well.
Select a time frame in configuration for your indicator calculations.
Select the strategy config for time frame. I like to use 5 and 15 minutes for scalping scenarios, but I am interested in hearing back from other community memebers.
Optimize your indicator without filters (trendFilter and RSI Filter)
Use the TrendFilter and RSI Filter to further refine your signals for entry. You will get less entries but you can increase your win ratio.
I will add screenshots and possibly a video provided that it passes community standards.
Limitations: this works rather well for short term, and does some good forward testing but back testing large data sets is a problem when switching from very small time frame to large time frame. For instance, finding a configuration that works on a one minute chart but then changing to a 1 hour chart means you lose some of your intra bar calclulations. There are some new features in pine script which might be able to address, this, but I have not had a chance to work on that issue.

MACD Signal with RSI Indicating StrategyThis strategy looks for MACD signal crossover and RSI confirmation of oversold/overbought condition.
Tune to your crypto/stock for best results using the strategy and sent an alert. Currently set up to use 25% of equity at each buy signal and will sell 1/3 of position at each sell signal. Initial investment is $1000, but adjust as necessary.
Currently tuned to DOGEUSD on 30min chart.
If you like/use/profit, follow me or shoot me a donation. If you are looking for a script design, I can help.

[KL] BOLL + MACD Strategy v2 (published)This strategy will look for opportunities when price touches the lower Bollinger band, then enters Long when it anticipates a MACD crossover signal.
Setup: on 1-day chart interval
Exits when either (a) hitting trailing stop loss, or (b) meeting risk-to-reward, if defined by user.

Jim's MACDMACD Buy/Sell Strategy
Filters bearish crossovers above the 0 line and bullish crossovers below.
Uses 34 ema to further filter the trades and take only longs above and only shorts below.
Apply at least 2:1 risk to reward ratio to account for losing trades.
Trade at own risk!
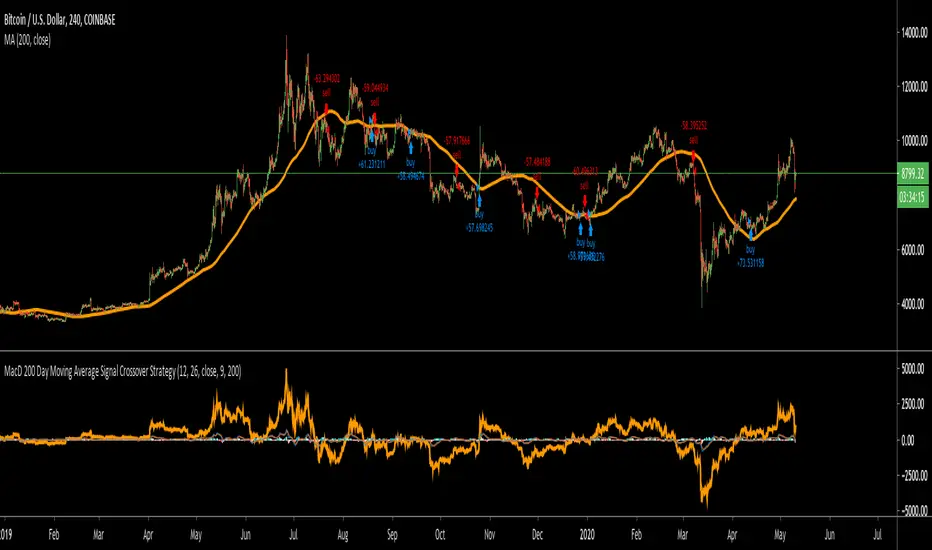
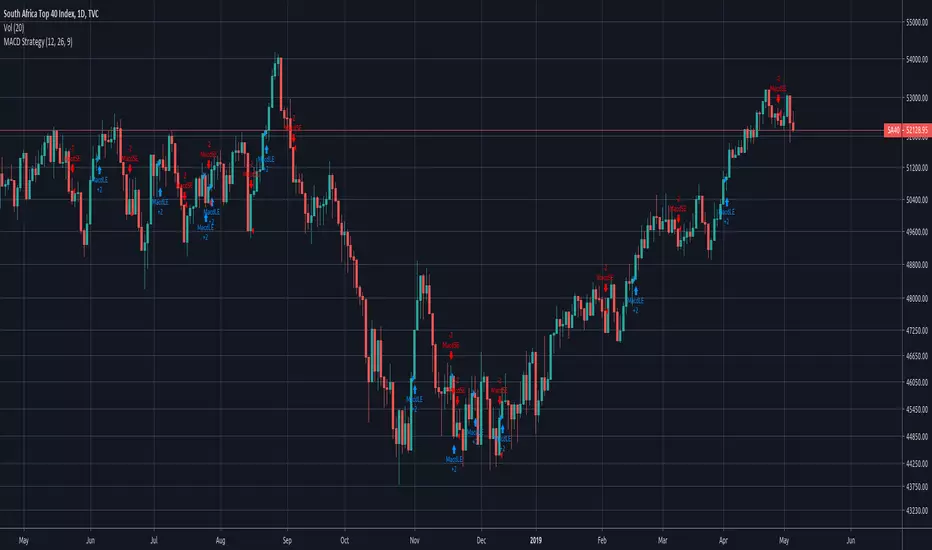
MacD 200 Day Moving Average Signal Crossover StrategyThis works on most time frames, but I noticed the 4 hour for BTCUSD on coinbase seems to work well as an example. The strategy is pretty simple. I was inspired by a youtube video that said to backtest their strategy so I did. Most of the time it doesn't work but sometimes it's pretty good as in the case I showed.
Basically, you buy if the MacD crossers over the signal line and the histogram is below 0 and you are above the 200 day moving average. Do the opposite to sell!

MACD BF 🚀Customised MACD strategy with dynamic stop losses based on ATR.
Signals are generated when the delta value becomes positive or negative (when it crosses the zero line)
Stop losses are printed on the chart in yellow and orange. They are based on recent average True Range to allow for volatility.
INSTRUCTIONS
Green background = long
Red background = short
Yellow dotted line = stop loss placement for long
Orange dotted line = stop loss placement for short
White background = you have been stopped out, wait patiently for the next signal


Simple MACD Strategy - CrossoverSimple MACD Crossover Strategy
No secret sauce here!
Script was requested by user
Adjustable MACD StrategyThis script provide a backtest version MACD, and provide some adjustable options.
CM Chris MACD - Strategy - Modified by FrancisRosarioThis one utlized " MacD Custom Indicator-Multiple Time Frame " By Chris Moody, I've turned it to strategy.
Additional Features will be added soon like utilizing Parabolic SAR..
Next feature I'll filter the bad signals..
All Credits to Chris Moody.

Buy/Sell Using MACD and ReversalsUsing the crossover of Signal Line and MACD line predict the reversals of trends in the chart.

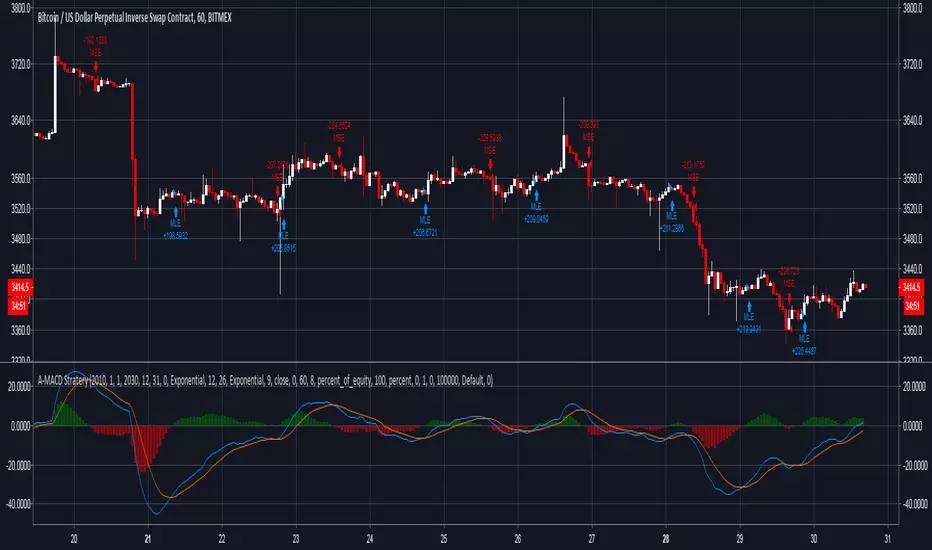
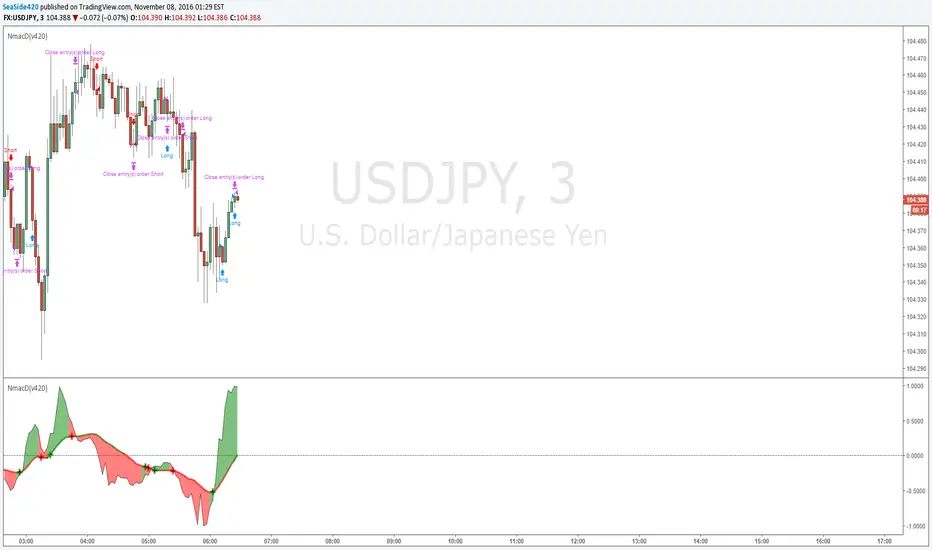
Normalized MACD (v420) strategyNormalized MACD but heavily modified for example hullMA instead of EMA
the strategy
MACD+STOCHASTICA simple strategy that use MACD and STOCHASTIC to give buy/sell signal. Use fractals to put stop loss
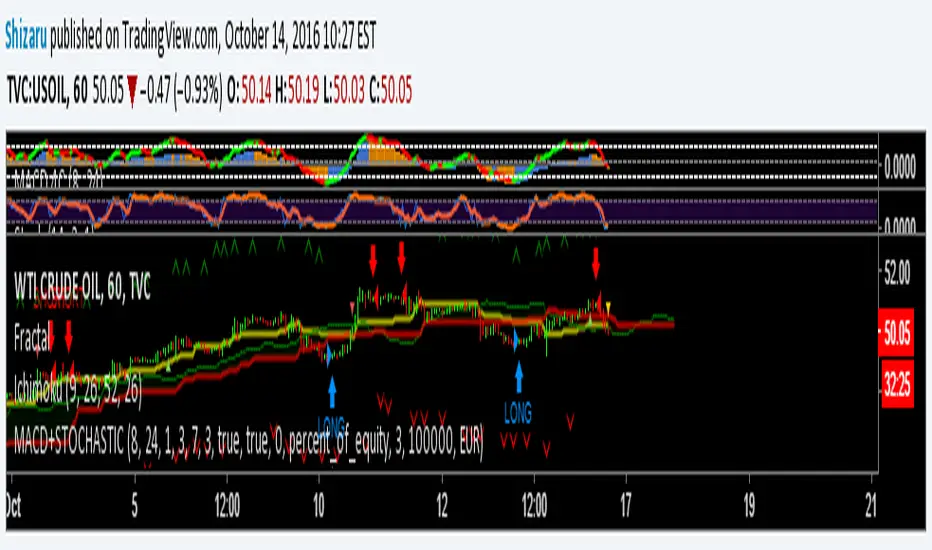
Ichimoku + Daily-Candle_X + HULL-MA_X + MacDIchimoku_cloud + Daily-Candle_cross(DT) + HuLL-MovingAverage_cross + MacD
any timeframe, all indicators settings adjustable for fine tuning to pair/timeframe
Target Point and Stop Loss settings
set SL low to reduce repaint

