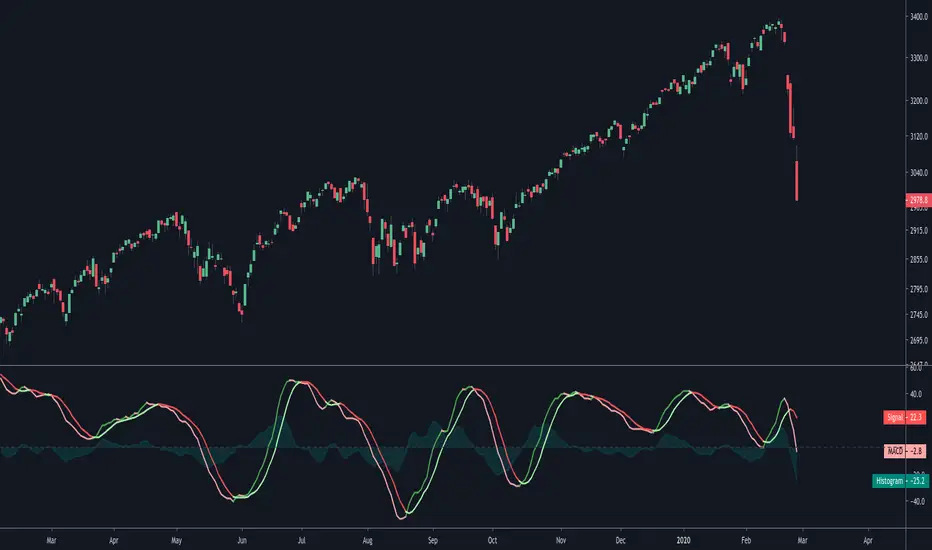
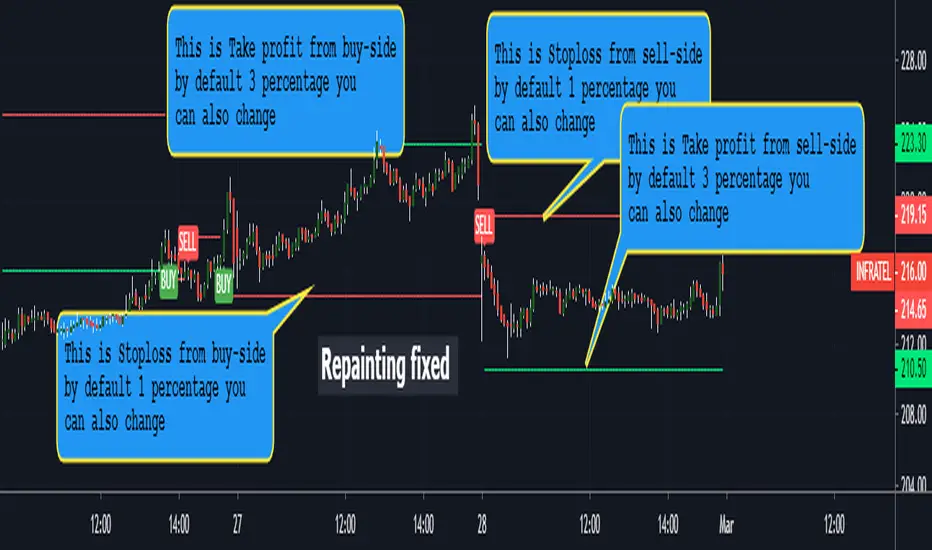
MACD classic strategy setupsetup for a classic MACD strategy with some filter to choose.
it keep the default setup of MACD because is the most popular.
it place the stop loss and take profit based on the trading rush video of MACD, if you want a different profict factor you can change until to reach 3, over this as a fixed risk reward don't have so much sense
Search in scripts for "macd"

MACD With Trend Filter: Visual Backtest Module TemplateSample Strategy: MACD Crossover with trend filter options
MA Filter : Price Close Above MA, Search for Buy, Price Close Below MA, Search for Sell
ADX Filter : Take trade only when ADX is above certain treshold
MACD Signal : MACD Cross above signal line while under 0 line indicate Buy Signal
MACD Cross below signal line while above 0 line indicate Sell Signal
-----------------------------
Using Alert Module:
Enable Alert --> Enable TV's alert and plot signal to chart
Alert Type --> Set to take Buy only, Sell only or Both alert
----------------------------
Using Backtest Module:
Enable Backtest --> Enable Backtest simulation
Backtest Type --> Set to take Buy only, Sell only or Both
SL Type -->
ATR : Set SL in ATR times Multiplier below/above entry price
Fixed : Set SL in fixed point below entry point (in 'Dollar'). e.g. for Stocks -> 0.5 equals to 50cent while for EURUSD currency -> 0.005 equal to 50 pips
HiLo Bar : Set SL at highest/lowest wick of previous bar plus/minus Fixed point. e.g. EURUSD HiLo=3 and Fixed Point = 0.0005, buy trade will place SL 5 Pips below lowest of previous 3 bar
SL ATR Period --> Set Lookback Period used for SL's ATR calculation
SL ATR Multi --> Set ATR Multiplier for SL
SL Fixed --> Set Fixed Level for SL (Use when SL Type is either Fixed or HiLo Bar)
SL Bar --> Set Number of previous bar to check for SL placement
TP RR Ratio --> Set TP based on RR multiplier. e.g. 2 means TP level will be twice further from entry point compared to Entry-SL distance.
Notes: The point is for preliminary testing, so it only supports 1 trade at a time and no Trailing Stop
----------------------------
Disclaimer:
This script main objective is to create my personal indicator template so that i just have to modify the indicator module for preliminary testing in future.
Testing Alert Module so i can re-use it as template in future study/indicator
Testing Visual Backtest Module so i can re-use it as template in future study/indicator
i believe using Strategy function is a better approach for this but the entry/exit level seems to be hit n miss (at least for me, still trying to figure what i did wrong)
also, i rather code the strategy in other platform where i can use the more accurate tick data if i want to validate backtest statistics.
My study scripts was built only to test/visualize an idea to see its viability and if it can be used to optimize existing strategy.
credit: ADX code are originally from "ADX and DI" by @BeikabuOyaji although i re-wrote so i can have cleaner read and use RMA instead of SMA

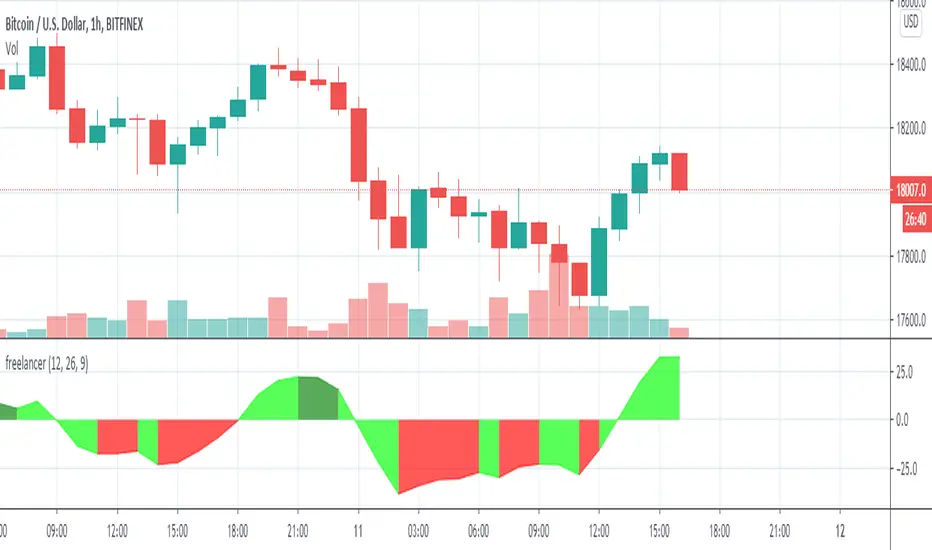
macd strategyOkay
User Avatar
Rules using ( MACD 12 26 Close 9 ):
Place a SELL signal when :
1. Histogram bar turned RED from GREEN
2. Within the previous group of green histogram bars the maximum value reached/passed +5.5
3. MACD fast & slow have values > 0
Place a BUY signal when :
1. Histogram bar turned GREEN from RED
2. Within the previous group of RED histogram bars has maximum value reached/passed -5.0
3. MACD fast & slow have values < 0
MACD/EMA Golden CrossThis is a slight modification to the MACD indicator. The golden cross indicator makes use of EMA 7 and EMA 21 as well as MACD together, in which it will turn the MACD line yellow & fill the MACD with a yellow background when MACD is above the signal line and EMA7 is above EMA21. This is best suited for swing trading on a daily timeframe.

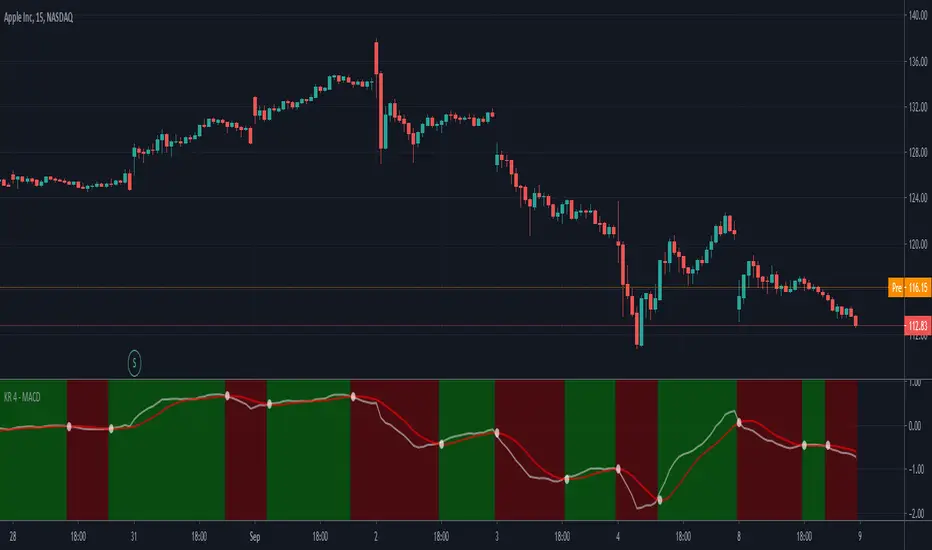
MACD with Buy & Sell alerts by Keiron RichieA redesign of the Moving Average Convergence Divergence (MACD) indicator to include background color changes for easy identification and includes Buy/Sell Alerts.
When the MACD (White line) crosses above the Signal (Red Line) the background changes to GREEN.
Likewise, when the MACD (White line) crosses under the Signal (Red Line) the background changes to RED.
Buy & Sell alerts are included.
MACD Indicator [SystemAlpha]This is a MACD indicator enhanced with:
- Show MACD and Signal Only or Histogram Only or Both
- Show Buy and Sell Alert - MACD Cross
- Show Bar Color
- Show Regular and Hidden divergence
- Show Divergence Labels
- Generate Alerts: Buy/Sell and Divergence

MACD [SystemAlpha]This is MACD indicator enhanced with:
- Show MACD and Signal Only or Histogram Only or Both
- Show Buy and Sell Alert - MACD Cross
- Show Bar Color
- Show Regular and Hidden divergence
- Show Divergence Labels
- Generate Alerts: Buy/Sell and Divergence

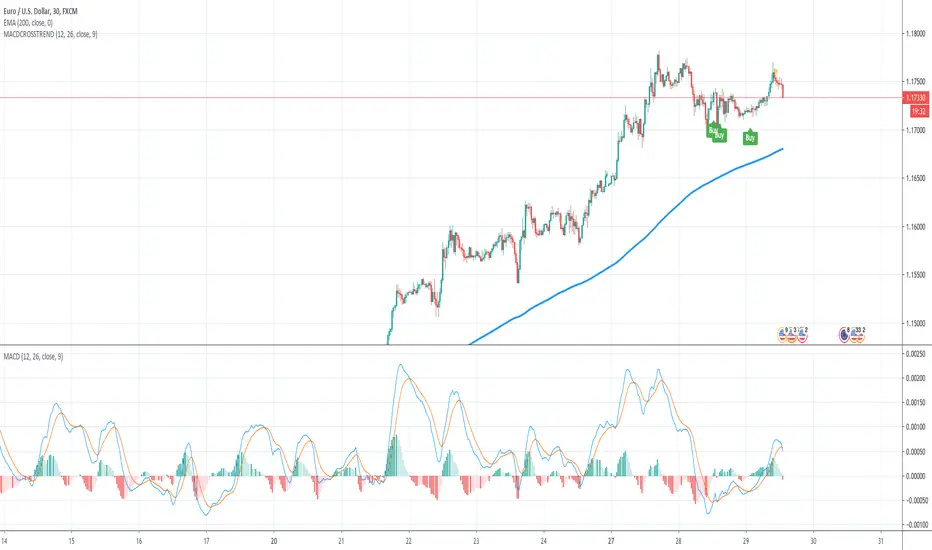
MACD Crossover Trend IndicatorHow this indicator works:
This indicator detects MACD Crossovers based on the current trend. It checks wether the current close price is above or below the 200 EMA and therefore decides whether we are in an up- or down trend.
UP-TREND: If the MACD is below 0 and crosses up the signal line, then this is a BUY signal!
DOWN-TREND: If the MACD is above 0 and crosses down the signal line, then this is a SELL signal!
How to trade this:
First rule: Be consistent!
Second rule: You will have lost trades and losing streaks - deal with it!
First set the SL slightly below the last significant low (eventually add/subtract the ATR value to/from it)
Then adjust the TP and ALWAYS use a RR ratio of 1.5.
NEVER get out of the trade earlier
Take every possible trade!
Important: Money management is key... so be consistent!
Have fun! :)
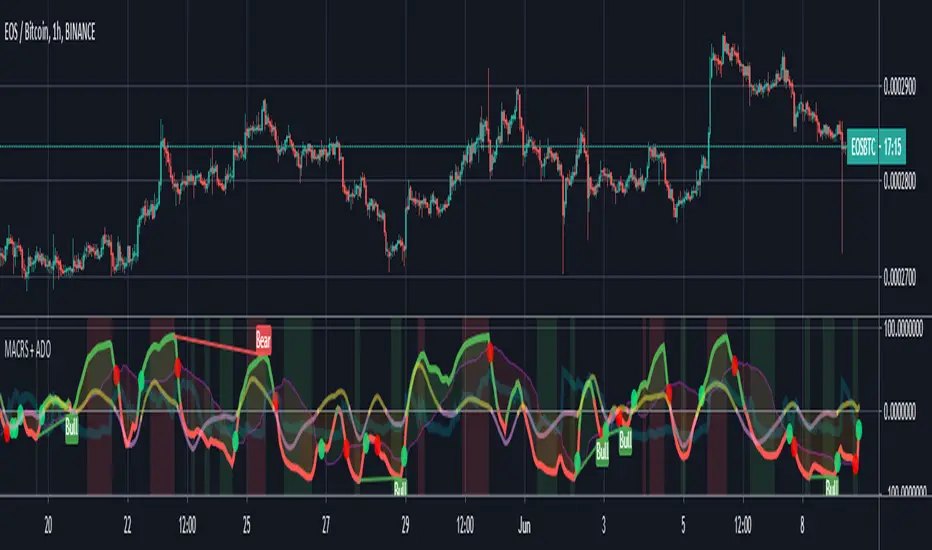
MACD modulated RSIThe main oscillator is the RSI modulated by the MACD (default). The RSI mode can be disabled to revert to a normal MACD oscillator for the main oscillator.
When the main oscillator (thicker line) is > 0, it is green; and if it is < 0, it is red.
The MACD can be re-scaled and whenever its value > 100, a background fill between the oscillator and the zeroline appear to indicates overbought condition; and < -100 indicates oversold condition. The user can tweak the scaling factor to optimize this for a given chart and timeframe.
A proprietary asymmetric differential oscillator (ADO) is also implemented, which is modulated by the main oscillator. When this (thinner line) secondary oscillator is > 0, it is yellow; and when it is < 0, it is lavender. The user can select the order of the differential (i.e. Order 1 = Momentum, Order 2 = Acceleration, Order 3 = Jerk, Order 4 = Snap, Order 5 = Crackle, Order 6 = Pop). This oscillator provides details of the more subtle underlying/hidden trends that is emerging or brewing, and may hint of an incoming move ahead of time. Divergence in the sign and slope of this secondary oscillator with respect to the main oscillator may provide a useful edge for trade setup.
A (thick transparent light blue) volume oscillator is also provided. An increase in volume trend provides confirmation of (or solidifies) the movements in the main oscillator over that period. A falling volume oscillator trend raises doubts on the main oscillator trend, and hints of the possibility of a counter-trend (also look at the secondary ADO oscillator for clues).
The novel aspects and principles of this indicator and this source code are the property of © cybernetwork.
This indicator and script is free for the TV community to use.
Quadratic Weighted (QWMA) MACDMACD but on the Quadratic Weighted Moving Average instead of regular Moving Average
"The quadratic moving average ( QMA ) or quadratic weighted moving average (QWMA) is a type of moving average who is closer to the price when price is up trending. This moving average is defined as the square root of the moving average of the squared price." @alexgrover ()
Base MACD code from @RicardoSantos ()
MACD AND SMA COMBINATION [MV]Hello everyone, This indicator based Multi-Indicator For Example MACD AND SMA.
how will come to buy signal?
When macd line crossingup signal line and sma above open bar
when will come Buy signal
or
When sma above open bar and macd line crossingup signal line
when will come Buy signal
how will come to Sell signal?
When macd line crossingdown signal line and sma below open bar
when will come sell signal
or
When sma below open bar and macd line crossingdown signal line
when will come Buy signal
if you have issues about this indicator comment there.
Thank you so much
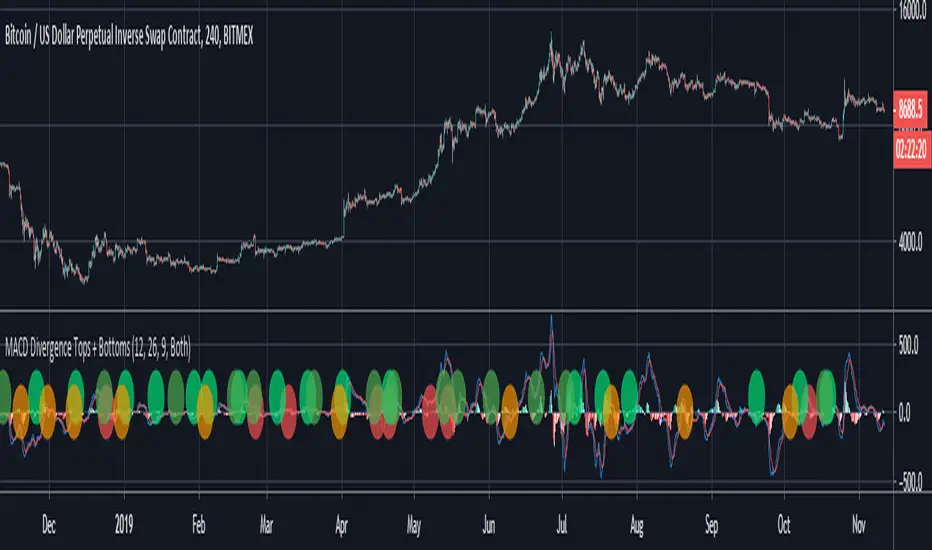
MACD Divergence Tops + BottomsMACD Indicator which plots local peaks and troughs in divergence.
"Classic" Divergence is specified as:
- A higher price, with reduced MACD high --> Potential Sell Point
- A lower price, with higher MACD low --> Potential Buy Point
"Alternative" Divergence is specified as:
- A higher MACD high, with reduced price --> Potential Sell Point
- A lower MACD low, with higher price --> Potential Buy Point
MACD Divergence should be used in combination with other indicators. This indicator identifies local tops and bottoms, with potential for macro trend shifts.
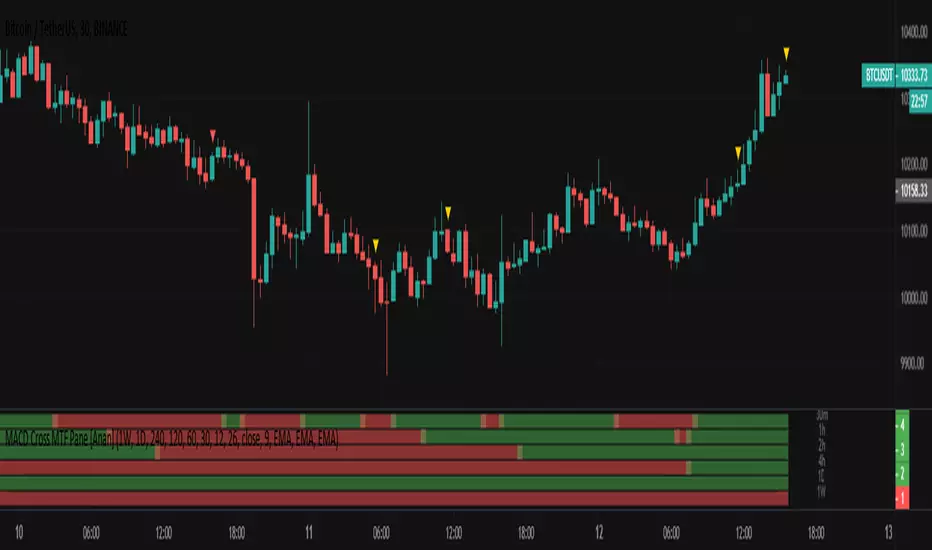
MACD Cross MTF Pane [Anan]Hello Friends,
I'm tired opening MTF charts and looking into MACD Cross, So I decide to share this tool with you ;)
Green = Bullish MACD Cross on
Red = Bearish MACD Cross on
Not Green / Not Red = The point of intersection
MACD Enhanced System MTF with optional TSL and Alerts [LTB]This script is developed to analyse MACD, MACD Signal, MACD Histogram movements by using current and higher time frame. Script calculates higher time frame automatically, no manuel entry. there is trailing stop loss line that is optional.
You can change the parameters as you wish.
btw. you should know that MACD is more successful when there is a trend.
I already shared this as a strategy script. Some ppl wanted to see the code.
You might want to see strategy test =>
by LonesomeTheBlue

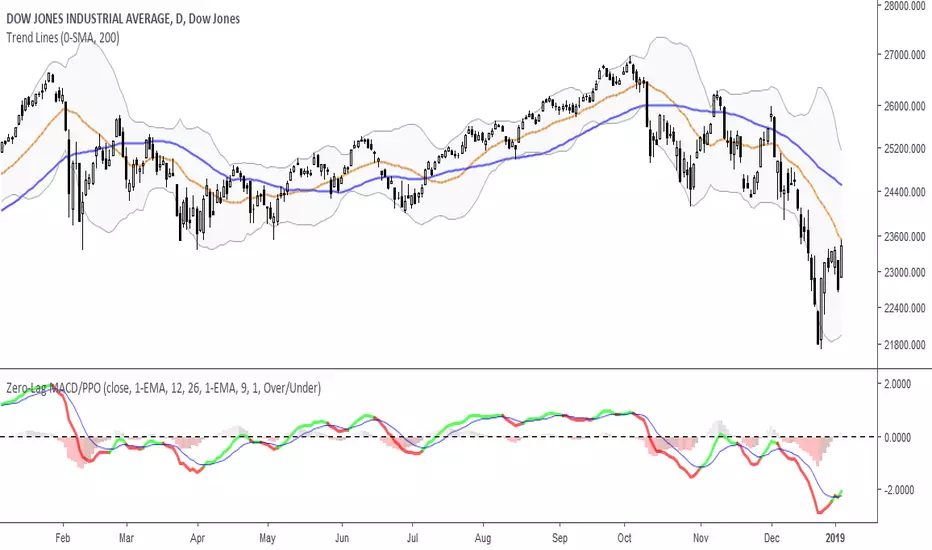
Zero-Lag MACD/PPOMACD/PPO Indicator, with optional faster EMA's to reduce lag.
-Use "MA TYPE" to select SMA, EMA, Double-EMA, Triple-EMA, or Hull as the MACD Source. Default is 'EMA'.
-Use "FAST MA" and "SLOW MA" to set the fast and slow period lengths.
-Use "SIGNAL TYPE" to select SMA, EMA, Double-EMA, Triple-EMA, or Hull as the Signal formula. Default is 'EMA'.
-Use "SIGNAL LENGTH" to set the Signal period length.
-Use "HIST. SIZE" to change the scaling of the histogram and make it stand out more.
-Use "COLOR SIGNALS" to select when to signal green/red on the MACD line.
--- "None" is always black.
--- "Over/Under" will signal based on MACD being over or under the Signal line.
--- "Rising/Falling" will signal based on MACD being over/under the Signal line and both are rising/falling.
-Use "PPO INSTEAD" to use Price Percent Oscillator scaling (works better for long-term and large price fluctuation).
MACD Divergence MarkFeatures:
Bright & Dark theme option. Choose the type that you can see clearly.
Customizable MACD length parameters.
Mark all the MACD Divergence signals on your chat!
Getting Started:
Replace your MACD indicator with this one.
Contributing:
You can report bugs or issues under this page.
Any advice would be helpful for improving this indicator's accuracy.
Acknowledgements:

MACD with Directional ColorsThis MACD indicator colors the MACD and signal lines according to the direction they are moving.
- Eliminates the histogram from the traditional MACD indicator.
- Uses a histogram for the MACD line.
- Includes Bollinger Bands for the MACD line to help detect squeezes

Volume Weighted MACD (VWMA, 4 Color, Color-blind Friendly)MACD built out of two Volume Weighted Moving Average (VWMA) lines of different periods. The signal line is still an EMA of the MACD line, just like with the normal MACD .
Colors are picked to be friendly with partial colorblindness, and can be modified in the indicator settings.

MACD TBBThis indicator works similar to the Tightened Bollinger Band (TBB) Strategy. Normally, when bollinger bands tighten, you look for the point where they widen and the direction of the price is often a breakout.
This indicator does the something similar, but using MACD, so you get other opportunities to get into plays. When the bollinger bands on the indicator tighten, wait for them to widen. The MACD line will turn red. The exit to the play is when the macd pulls away from the band and turns black again.
This indicator was built to help with some instructional material presented at www.optionsplayers.com
Let me know if you like the indicator or have any suggestions!

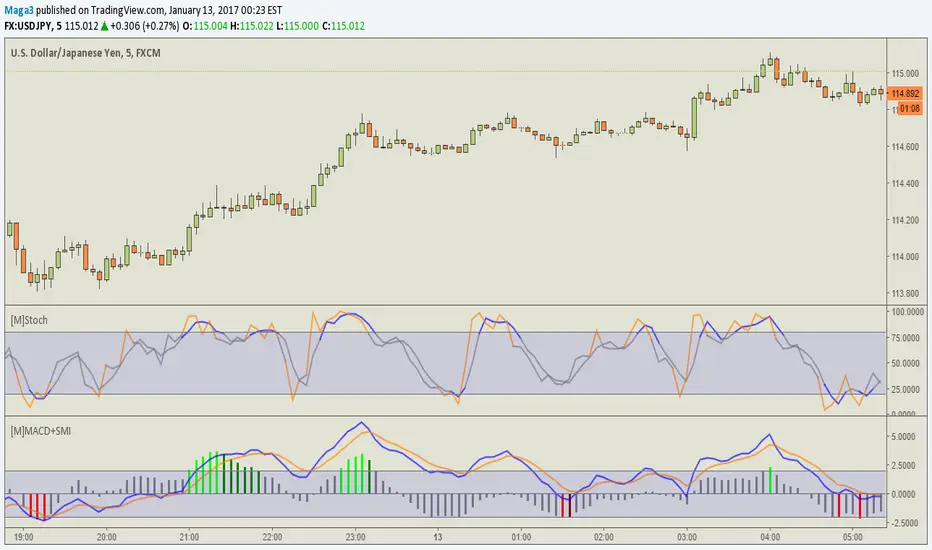
[M] MACD + SMI
MACD + SMI -2.23% Ergodic
When leaving the zone, MACD is painted in different colors, while in the area - is gray.
In the settings you can disable shading in gray or SMI -2.23% .
Works on the major currency pairs, the rest has not been tested. Because it did for me)
//Google translate
----------------------
МАКД+SMI Ergodic
При выходе из зоны, MACD окрашивается в разные цвета, при нахождении в зоне - остается серым.
В настройках есть возможность отключить закрашивание в серый или SMI -2.23% .
Работает на основных валютных парах, на остальных не тестировался, потому что делал для себя)
MACD trend heatmap (by ChartArt)This is an overlay indicator which uses the classic period settings and signals from the MACD (Moving Average Convergence/Divergence) indicator to overlay a heatmap using all the information the MACD generates with its three periods (12,26,9).
The first two moving averages which the MACD uses (12 and 26) can be plotted on the chart like usual EMAs.
In addition to the background color function (the heatmap) and the EMAs, there is an optional bar color alert when the uptrend or the downtrend as measured by the MACD appears to be very strong.

Dual MACD With Pilot Background + + Stoch RSI Alert HELL 2macd 1 chart time macd 2 4x chart time with over bought and over sold stoc rsi alerts
MACD - Ostinato TradingMACD oscillator from Ostinato Trading, the classic momentum indicator. With this particular code you can superpose two different MACD and add a background to display cross of second indicator if you don't want to display it completely.
