Average Daily Range (ADR) (Multi Timeframe, Multi Period)Average Daily Range (ADR)
(Multi Timeframe, Multi Period, Extended Levels)
Tips
• Narrow Zones are an indication of breakouts. It can be a very tight range as well.
• Wider Zones can be Sideways or Volatile.
What is this Indicator?
• This is Average Daily Range (ADR) Zones or Pivots.
• This have Multi Timeframe, Multi Period (Up to 3 Levels) and Extended Target Levels.
Advantages of this Indicator
• This is a Leading indicator, not Dynamic or Repaint.
• Helps to identify the reversal points.
• The levels are more accurate and not like the old formulas.
• Can practically follow the Buy Low and Sell High principle.
• Helps to keep minimum Stop Loss.
Who to use?
• Highly beneficial for Day Traders
• It can be used for Swing and Positions as well.
What timeframe to use?
• Any timeframe.
When to use?
• Any market conditions.
How to use?
Entry
• Long entry when the Price reach at or closer to the Green Support zone.
• Long entry when the Price retrace to the Red Resistance zone.
• Short entry when the Price reach at or closer to the Red Resistance zone.
• Short entry when the Price retrace to the Green Support zone.
• Long or Short at the Pivot line.
Exit
• Use past ADR levels as targets.
• Or use the Target levels in the indicator for breakouts.
• Use the Pivot line as target.
• Use Support or Resistance Zones as targets in reversal method.
What are the Lines?
Gray Line:
• It the day Open or can be considered as Pivot.
Red & Green ADR Zones:
• Red Zone is Resistance.
• Green Zone is Support.
• Mostly price can reverse from this Zones.
• Multiple Red and Green Lines forms a Zone.
• These lines are average levels of past days which helps to figure out the maximum and minimum price range that can be moved in that day.
• The default number of days are 5, 7 and 14. This can be customized.
Red & Green Target Lines:
• These are Target levels.
What are the Labels?
• First Number: Price of that level.
• Numbers in (): Percentage change and Change of price from LTP (Last Traded Price) to that Level.
General Tips
• It is good if Stock trend is same as that of the Index trend.
• Lots of indicators creates lots of confusion.
• Keep the chart simple and clean.
• Buy Low and Sell High.
• Master averages or 50%.
Search in scripts for "nifty"

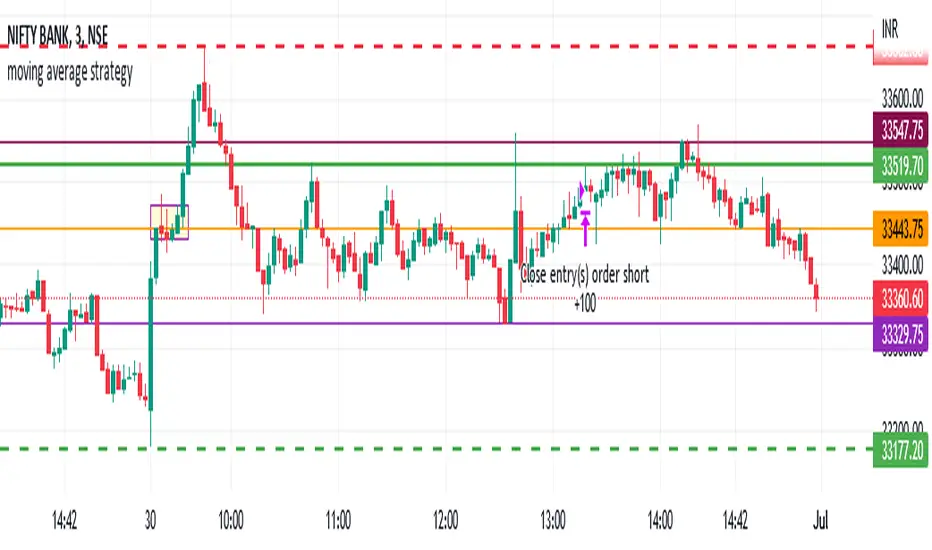
DMI StrategyThis strategy is based on DMI indicator. It helps me to identify base or top of the script. I mostly use this script to trade in Nifty bank options, even when the signal comes in nifty . It can be used to trade in other scripts as well. Pivot points can also be used to take entry. Long entry is taken when DI+(11) goes below 10 and DI-(11) goes above 40 , whereas short entry is taken when DI-(11) goes below 10 and DI+(11) goes above 40.
For bank nifty , I take the trade in the strike price for which the current premium is nearby 300, with the SL of 20%. If premium goes below 10% I buy one more lot to average, but exit if the premium goes below 20% of the first entry. If the trade moves in the correct direction, we need to start trailing our stoploss or exit at the pre-defined target.
As this a strategy, there is one problem. While we are in the phase of "long", if again the "long" phase comes, it will not be shown on chart until a "short" phase has come, and vice versa. This has been resolved by creating an indicator instead of strategy with the name of "DMI Buy-sell on chart". Please go through that to get more entry points.
Please have a look at strategy tester to back test

Point of Control V2 The genesis of this project was to create a POC library that would be available to deliver volume profile information via pine to other scripts of indicators and strategies.
This is a republish of an invite only script to open access
This is the indicator version of the library function.
A few points of significance:
- Allows the choice of reset of the study period, day/week or bars. This is simple enough to expand to other conditions
- Bar count resets starting from the beginning of the data set (bar index =0) vs bars back from the end of the data set
- A 'period' in this context is the time between resets - the start of the POC (eg. start of Day or Week) until it resets (for example at the beginning of a next day or week)
- Automates the determination of the increment level rather than the user specifying ticks or price brackets
- Does not allow for setting the # of rows and then calculating the implied price increment levels
- When a period is complete it is often useful to look back at the POCs of historical periods, or extend them forward.
- This script will find the historical POCs around the current price and display them rather than extend all the historical POC lines to the right
- This script also looks across all the period POCs and identifies the master POC or what I call the Grand POC, and also the next 3 runner up POCs
This indicator is also available as a library.
BINANCE:BTCUSDT NSE:NIFTY OANDA:XAUUSD NASDAQ:AAPL TVC:USOIL

VolumeThis helps to view volume data for Nifty and BankNifty indices based on the futures volume. Other scrips' volume will be same as the available data.
#rvtradesetups #basils
BadloIt's Spread between Nifty & Banknifty
Create your own pair to see the relative price movement between 2 Script.
This indicator is a good reference tool to do hedge trading.
Users can enter the exchange and ticker name they like.

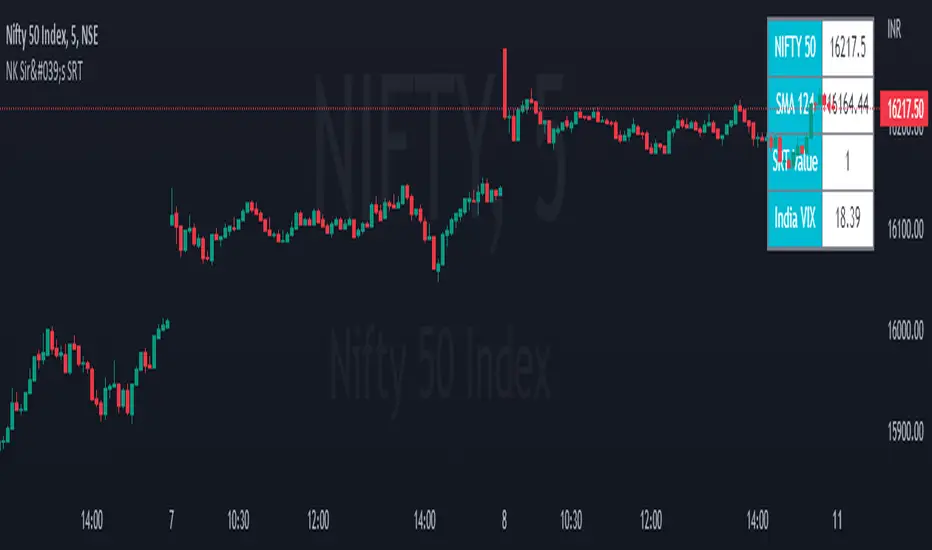
NK Sir's SRTFirst of all I would like to thanks Nitish Sir for teaching us the concept of SRT, which proves to be an excellent tool for Investing.
In a year, there are around 248 to 252 trading days .
On dividing the same by 2 we get 124. Even 125 / 126 can be taken.
We get SRT value by dividing Nifty Spot with 124 SMA value & SRT is applicable on Nifty in a Day Chart.
This value ranges in between 0.6 (Low) to 1.38/1.4/1.45/1.5 (High).
Ideal Entry in a stock will be at 0.6, which is very rare. You tend to buy at 0.7/0.8/0.9/1.10.
Exit from a stock will be at 1.3 - 1.5.
However generally we get a value of 0.8/0.9 and we should start investing 20 % of our capital that we have planned to invest. For every 0.1 decrease in SRT Value, we should add 20% to the stock portfolio.
Start Booking Profit if SRT value above 1.35 & book 50 % of the portfolio when SRT value is 1.45.
For Traders, as an when SRT value comes to 0.8/ 0.9. Buy when Hilega Milega gives us a clear BUY signal on Monthly Time Frame.
Stock bought at SRT value of 0.6 tend to double in a year. It generally quite rare to see a SRT Value of 0.6.
sonu1997full banchod
Information technology (IT) companies will kick off the first-quarter earnings season in July amid expectations they will post strong revenue growth, offset by pressure on profit margins exerted by higher. wage costs. IT companies including Infosys and HCL Technologies are unlikely to change their full-year guidance despite concerns of a recession in the US and Europe, analysts said.
Major IT companies typically announce their earnings for the three months ended June in the first fortnight of July, with Infosys and Tata Consultancy Services leading the pack.
The earnings season follows a tumultuous quarter marked by worries over the Russia-Ukraine war, accelerating inflation and tightening of interest rates by global central banks to cool it, supply-chain disruptions, and tumbling financial markets.
IT stocks have fallen the most among sectors, with the Nifty IT index correcting 29 percent from its high in January. Higher valuations and rising fears of an economic slowdown, even recession, in the US and Europe, the biggest markets for IT companies, weighed on the sector
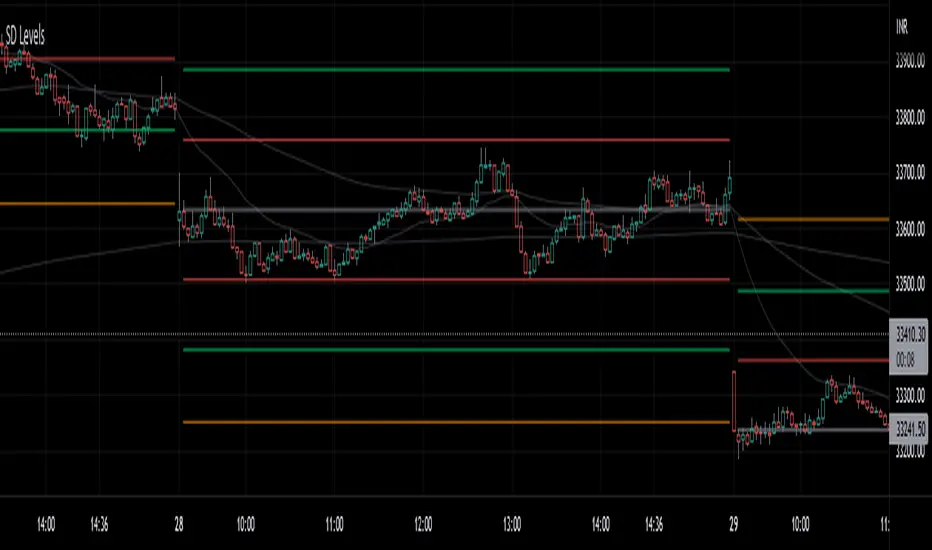
SD LevelsSD Levels is an indicator for the gap-up gap down markets
Works best on 5minute and lower time frames.
Involves standard deviation levels, Emas and Vwap.
Colorful lines are standard deviation levels which are +0.33,-0.33,+0.66,-0.66,+1.00 and -1.00 based.
Static Gray line is settlement line based on the first candle of the day and the tf you choose (default source OHLC4, also works good on close source)
SST Table NewData Table for Update GTT Orders in Stocks....
Updated GTT Order details for SST , also added Relative Strength of Stock compared with NIFTY Index for 55 Days (3 Months) period.
RS line plotted on chart… taken reference of close price of day candle… just a bigger picture of actual RS indicator plotted on chart itself... RS line in red color means below zero line (negative) and green color means above zero line (positive).
Added code for checking RS value on chart for any previous day.

RSITrendStrategyI don't know if there is any strategy based on RSI cross over. The strategy is designed based on RSI crossover, considering RSI(5) and RSI(11), with RSI(6) to identify highs & lows.
I used this strategy to trade in Nifty 50 & Nifty bank indices. Whenever there is long mentioned on chart, I go for buying call option with premium near to 300, and placing stoploss of 50 on candle closing basis, vice versa.
Target is open until short is mentioned on the chart. Sometimes, i used standard pivot points as well to mark my targets and also to trail my trades.

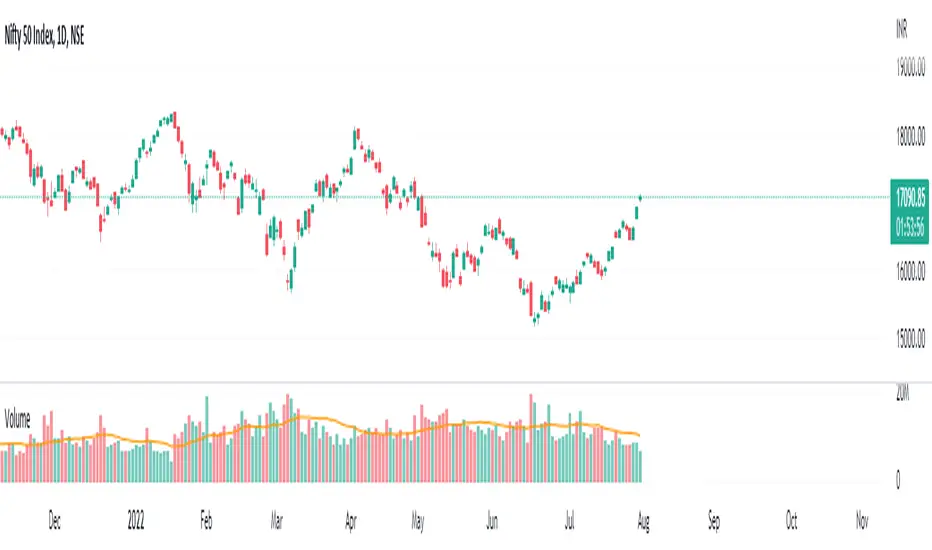
SRT Indicator script based on Knowledge sharing by NKIn a year, there are 248/ 252 trading days .
Half of this is 124. Even 125/ 126 can be taken.
For Ex: We get SRT value by dividing the Nifty Spot with 124 SMA value applied on Nifty in a Day Chart.
This value Travels between 0.6 ( Bottom) to 1.38/1.4/1.45/1.5 ( Top).
Ideal Entry in stock will be at 0.6, which is very rare. You tend to buy at 0.7/0.8/0.9/1.10.
Exit from stock will be at 1.5.
However, generally, we get a value of 0.8/0.9 and we should start investing 20 % at a time. For every 0.1 declines, we should add 20 % to the stock portfolio.
Start Booking Profit if the SRT value is above 1.35 & book 50 % of the portfolio when SRT value is 1.45.
For Traders, as when SRT value comes to 0.8/ 0.9. Buy when HM comes in a buy in Monthly Time Frame.
SRT moves between 0.6 to 1.5 and which is a very reliable parameter for Investing.
Best time to invest in NIFTY is when SRT is between 0.6 to 0.9, NIFTY returned 2X, 3X or even more in less than a year.
Make sure Hilega Milega on Monthly Time frame is BUY before investing at these levels
Invest in batches, 30% of your capital when SRT is 0.9 and repeat every 0.1 downside

Nifty_Top10Movement of Nifty Top 10 Stocks
This script shows us the movement in Nifty Top 10 stocks based on price.

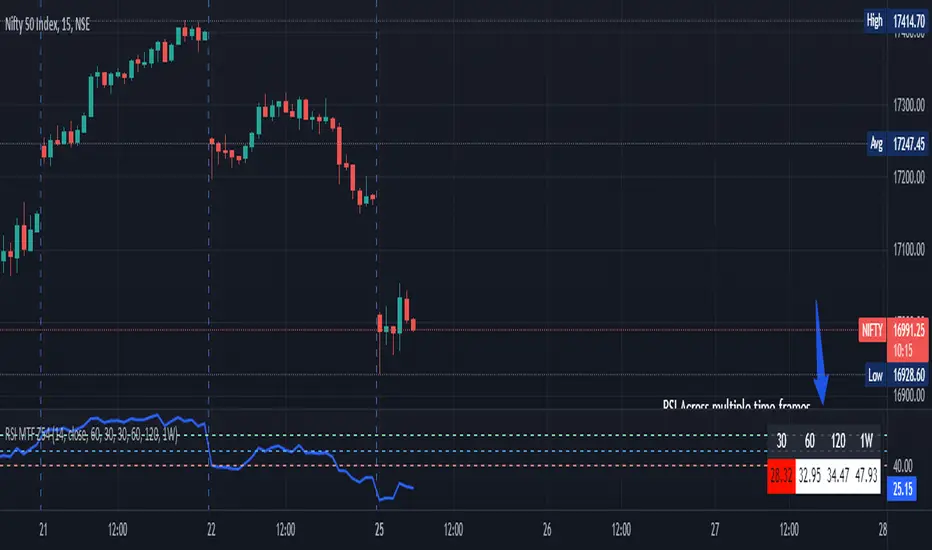
RSI Multi Time Frame (MTF). Fully customizable. [Zero54]NSE:NIFTY
An easy to read Multi Time Frame RSI that does not take too much space. All parameters and colors are customizable. Please feel free to give your suggestions. Feel free to modify the code as per your liking. Like this if you find this useful.
Portfolio Laboratory [Kioseff Trading]Hello!
This script looks to experiment with historical portfolio performance. However, a hypothetical cash balance is not used; weighted percentage increases and decreases are used.
You can select up to 10 assets to include in the portfolio. Long and short positions are possible.
Show in the image are the portfolio's weight, the total return of the portfolio and the total return of the asset on the chart over the selected timeframe.
Shown in the image above are the constituents of the portfolio, which can include any asset, the weighted percentage gain/loss of the constituents in addition to 10 major indices and their respective total percentage gain/loss over the timeframe.
Shown in the image above are the dividend yield % of the portfolio and relevant portfolio metrics - ex-post calculations are applied and are predicated on simple returns.
Shown in the image above is a portfolio of all short positions; portfolio calculations adjusted to the modifications.
Also shown is a change in the index the portfolio is calculated against. I have been asked a few times to include NIFTY 50 in my scripts - I made sure this was achieved, lol!
Show in the image is a performance line of performance of percentage increases/decreases for the index calculated against, the asset on the chart, and the portfolio.
All lines start simultaneously on the selected start date at the close price of the session for the asset on your chart.
However, the right-hand scale, whether displaying price or percent, cannot be used to assess the performance of each line - they are useful for visualization only and can extend below zero on a low-priced asset. Calculations will not execute correctly when selecting a start date prior to any asset in the portfolio's first trading session; calculations do not begin on the first bar of the asset on your chart.
I decided to code the script this way so statistics remain fixed when moving from asset to asset!
To compensate for this limitation, I included a label plot and background color change at the first session in which all assets in the portfolio had at least one bar of price data. You can adjust the calculation start date to the date portrayed on the label to test al possible price data!
The statistics table, and the performance lines, can be hidden in the user input section.
I plan on putting a bit more work into this script. I have some ideas on what to include; however, any input is greatly appreciated! If there's something you would like me to include please let me know.
@scheplick mentioned me in a script he recently coded:
My inspiration came from his script! I thank him for that!

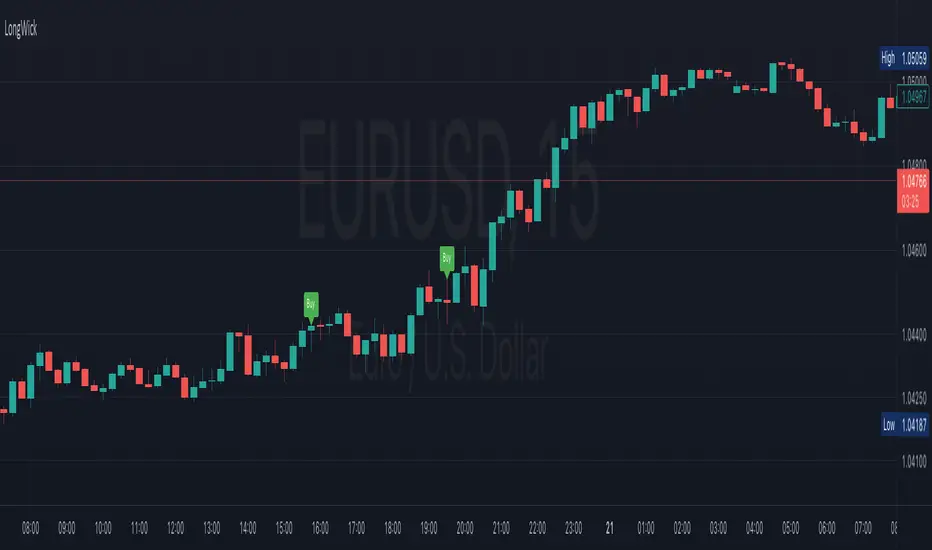
Long WickIt will work on Bank Nifty future only with 2 min time frame. GO Long above candle if the lower wick is more than 50 points and go short below the candle if upper wick is more than 50 points. It will work better with price action.(demand and supply zone)
BLSHBuy Low Sell High Strategy for Top Market Cap Stocks from Nifty 50. Buy only after price recovery of 5% from it's 25 Days Lowest price for a small target of 5%. It confirms the trend reversal

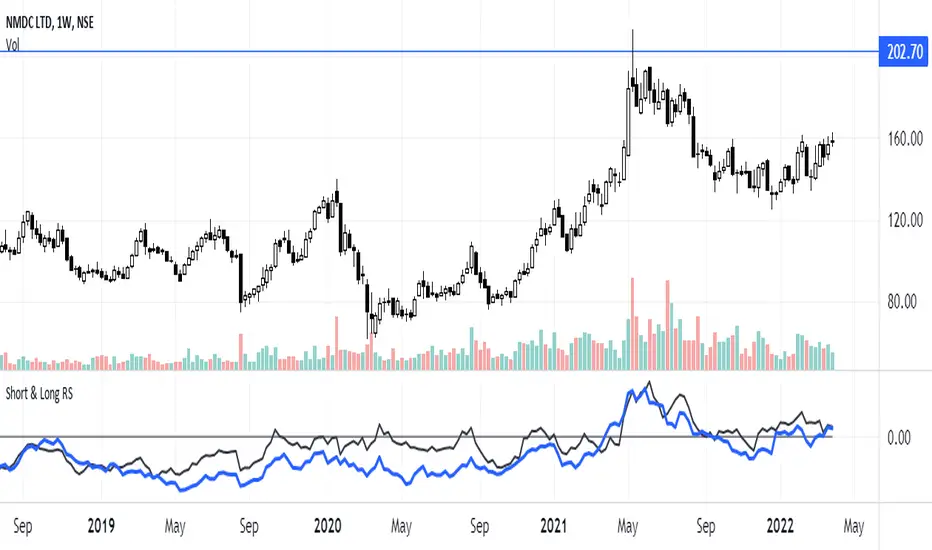
Short & Long Relative StrengthRelative Strength (RS) is a method of identifying stocks which are relatively stronger or weaker as compared the market as a whole or to a relevant benchmark.
To calculate the relative strength of a particular stock, divide the percentage change over some time period by the percentage change of a particular index over the same time period.
The value of RS Indicator oscillates around zero. If value of RS is above ZERO then security is outperforming the benchmark and if value of RS is below ZERO then security is outperforming the benchmark.
Here i have used two RS indicator lines in one indicator - Short Term RS (default value is 65) and Long Term RS (default value is 123).
I have set default benchmark index as Nifty 50 (NSE:NIFTY)
Candle ClassifierThis indicator uses allows its users to locate classifications of candles based on user defined input.
Using a % of candle range the user can specify,
High Wick %
Candle Body %
Low Wick %
The user can also search for candles within a (user defined) variance range.
A nifty feature of this indicator is the display of your criteria, so that you can be reminded while you're looking through your chart!

R-Smart - Relative Strength On observing the market for years I learned that Relative Strength will help us in staying invested in strong bullish stocks (relative to primary indices of your country, in my case it's Nifty 50 for India). Once you identify a strong stock, it's important to know if the stock is trending and is in momentum. To identify, trends and momentum, I used ADX and MACD indicators respectively as part of the R-Smart.
In R-Smart, I used Relative Strength primarily to plot the chart, if the Histogram is positive (greater than 0) then the security is bullish. But then how do we know that it's in trend and having momentum. Well the below color code will help you identify them
1. Histogram in Green : Strong Bullish
2. Histogram in Blue : Weak Bullish
3. Histogram in Orange: Bearish
Apart from the above indicator, I would like to use Super Trend to know the immediate support/resistances on the chart.
# StayInvested
# StayProfitable
# ManageYourRisk

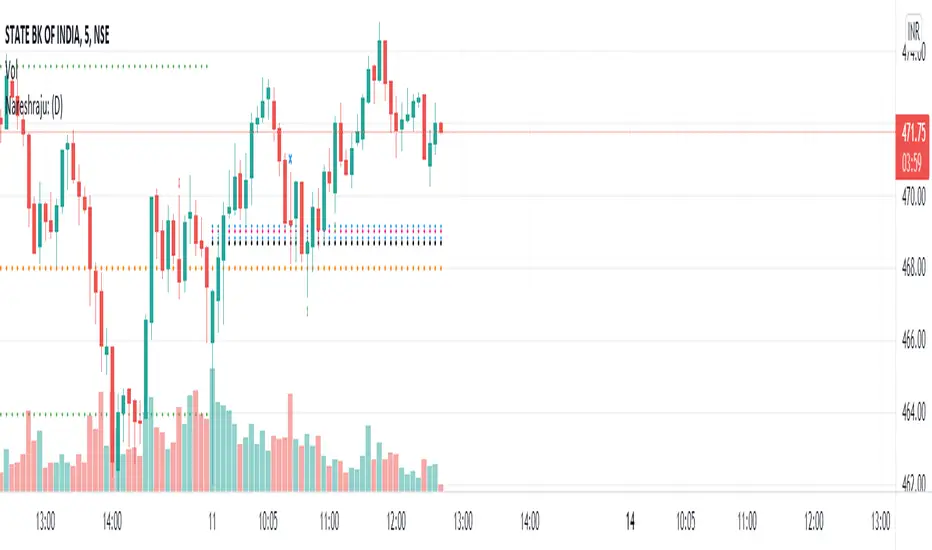
Nareshraju CPRHi friends this is Cpr indicator which means central pivot range. it contains supports and resistances to take perfect entry.
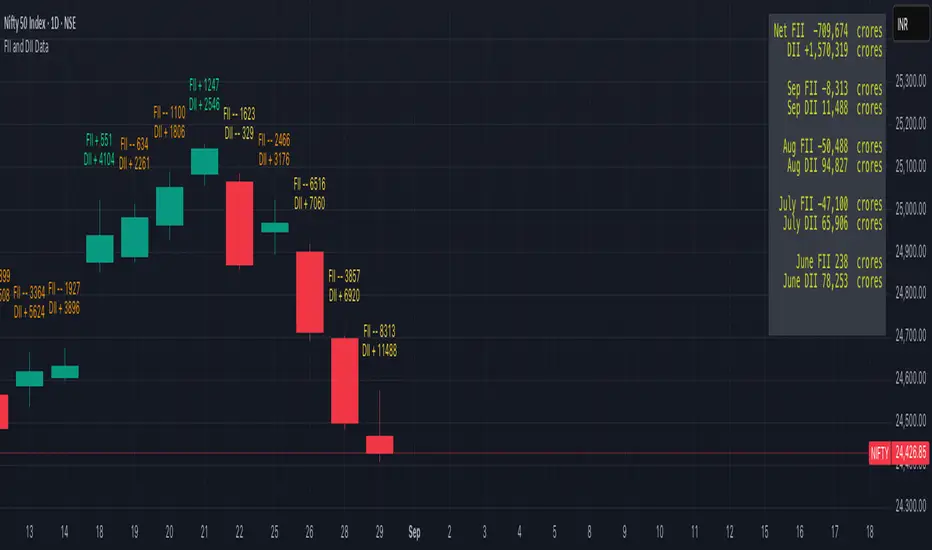
FII and DII Data
Greetings to All of you.
The script is plotting FII & DII activity of buying or selling on Daily TimeFrame of Nifty Spot.
Will display only on Nifty 50 Spot on Daily TimeFrame . Codes are hardcoded because novice to PineScripting.
Data is collected from NSE website on daily basis, it's an manual process.
Observation:
Start date of observation is 16th Nov., 2021. FII bought worth 14,240 & kept buying for next 2 days & bought stocks worth 17,760 crores. But market kept falling as we can see in the chart.
Now FII's started selling & in next 5 days they sold stocks worth 18,698 crores. What makes sense from this is might have cut their losses early. FII's kept selling & Nifty made an low of 16410.
FII had sold stocks worth -21,954 crores.
FII are negative & the top green box which you see is FII & DII activity from 19th Oct 2021 when Nifty Spot made an High of 18604.45.
As of 14th Jan.,2022 they are still Negative & DII are extremely positive.
NOTE: DII have not sold any thing yet. They are PLUS +74,428 Crore . Now if they start selling we need to take care of our portfolio.
Hope the information might help in someway.
Take Care & Stay Safe why because Health is Wealth.
PS: If you have any better way to improve the hard coded codes please enlighten. Thank you in advance
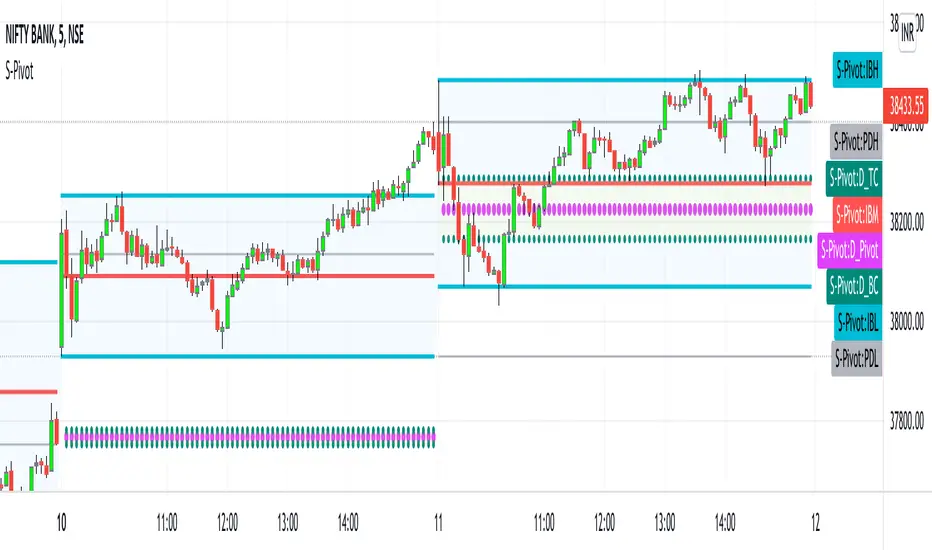
CPR_Previous Day Ranges_Initial BalanceHello Traders,
This script best works on Indian Index (Tested on BANKNIFTY & NIFTY)
This indicator can be used only for day trading (intraday: ex: 5min, 15min Timeframes) on indices.
This script helps to plot
1. Central Pivot Range(CPR)
2. Previous Day Ranges (PDH & PDL)
3. Initial Balance(IB)
brief description of indicators:
1. CPR: Central Pivot Range --> This indicator helps to identify key price points to set up trades. CPR is beneficial for intraday trading.
2.Previous Day Ranges: These ranges will help to understand the current day market.
PDH: Previous Day High value on current day
PDL: Previous Day Low value on current day
3.Initial Balance(IB):This indicator will help in day trading. IB will plot current day first 1hr high, low & mid values.
Disclaimer: This indicator can be used as refrence only. This has been tested on Banknifty and Nifty indices on day trading 5 minutes and 15 minutes timeframe. Understand yourself to knowledge of different trading methods.
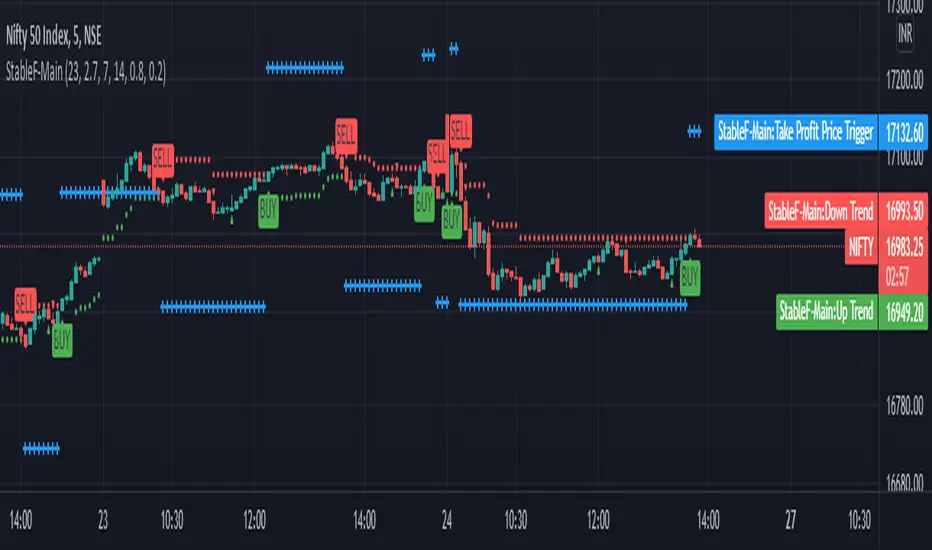
StableF-MainIt is combination of Built in Super trend and Adx with take profit
uptrend is considered when +dmi is above -dmi and +dmi is above 25 and adx is above 25 and supertrend gives Buy
downtrend is considered when -dmi is above +dmi and -dmi is above 25 and adx is above 25 and supertrend give sell
use fibo for target by taking as previous swing high and swing low
-supertrend crossover is referred as buy plotshape
-supertrend cross under is referred as Sell plotshape
-keep stoploss at dot line of supertrend
-adx-dmi crossover (+dmi crossed above -dmi) is shown by Triangle Up symbol
-adx-dmi crossunder( -dmi crosses below +dmi) is shown by Triangle down symbol
--Cross symbol with blue line with linewidth 2 is referred as Take profit
--combine this with adx -dmi setting with 7 and 14
----disclaimer-----
used free built in supertrend and adx so u can use same setting in other broker or in trading view
not responsible for any loss or gain
-only for educational purpose