Pivot Point V2 Pivot points simply took the high, low, and closing price from the previous period and
divided by 3 to find the pivot. From this pivot, traders would then base their
calculations for three support, and three resistance levels. The calculation for the most
basic flavor of pivot points, known as ‘floor-trader pivots’, along with their support and
resistance levels.
Search in scripts for "pivot"


Pivot Points)Pivot Point Display:
Calculate and draw the Pivot Point line (center point).
Calculate and display Support and Resistance levels.
Types of Pivot Calculation Methods:
Classic (default)
Ability to select other methods such as Fibonacci, Camarilla, Woodie's (but not yet implemented in the code).
Support and Resistance Lines:
Four resistance levels (R1, R2, R3, R4) in red.
Four support levels (S1, S2, S3, S4) in bright green.
Ability to adjust line thickness:
The user can change the thickness of the lines.
Value Labeling:
Display a numerical value for Pivot, resistance and support next to each level.
Automatic Update:
Delete previous lines and labels and draw new lines on the last candle.
Works on all timeframes:
This indicator works on different timeframes such as 1 minute, 5 minutes, 1 hour, 4 hours, daily, weekly and monthly.

Pivot Points Std iazzuPivot point std iazzu
In financial markets, a pivot point is a price level that is used by traders as a possible indicator of market movement. A pivot point is calculated as an average of significant prices from the performance of a market in the prior trading perio

Pivot Points by ParaticaPivot Points are very important for specially day traders. But Tradingview provides only monthly Pivot Points. You can check Pivot Points in any Chart Interval with this indicator.

Pivot Reversal AlertsPivot Reversal Study script, for generating Alerts and visual plotting of Pivot Reversal lines on the charts. Use a Strategy script (like Figs & Dates), for backtesting different settings on various time frames and charts.

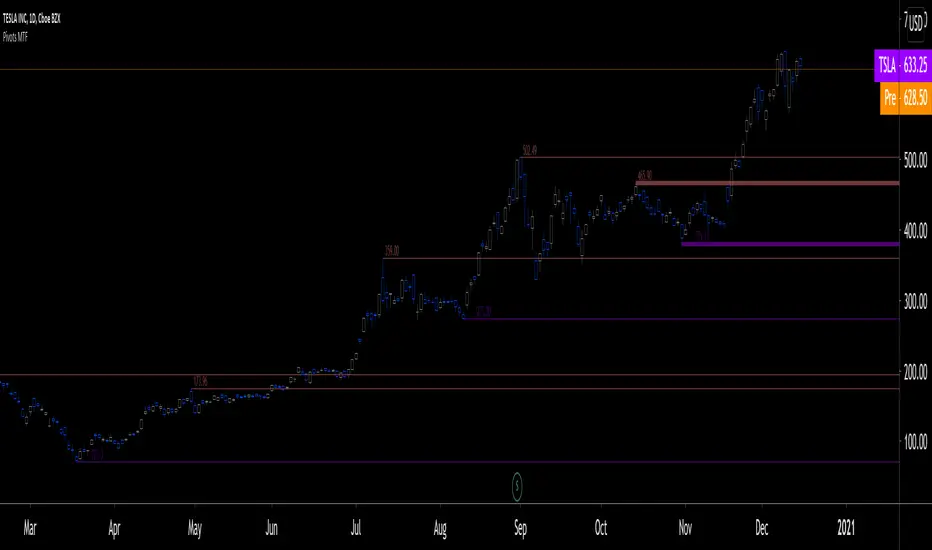
Pivots MTF [LucF]Pivots detected at higher timeframes are more significant because more market activity—or work—is required to produce them. This indicator displays pivots calculated on the higher timeframe of your choice.
Features
► Timeframe selection
— The higher timeframe (HTF) can be selected in 3 different ways:
• By steps (15 min., 60 min., 4H, 1D, 3D, 1W, 1M, 1Y). This setting is the default.
• As a multiple of the current chart's resolution, which can be fractional, so 3.5 will work.
• Fixed.
— The HTF used can be displayed near the last bar (default).
— Note that using the HTF is not mandatory. If it is disabled, the indicator will calculate on the chart's resolution.
— Non-repainting or repainting mode can be selected. This has no impact on the display of historical bars, but when no repainting is selected, pivot detection in the realtime bar will be delayed by one chart bar (not one bar at the HTF).
► Pivots
— Three color schemes are provided: green/red, aqua/pink and coral/violet (the default).
— Both the thickness and brightness of lines can be controlled separately for the hi and lo pivots.
— The visibility of the last hi/lo pivots can be enhanced.
— Prices can be displayed on pivot lines and the text's size and color can be adjusted.
— The number of bars required for the left/right pivot legs can be controlled (the default is 4).
— The source can be selected individually for hi and lo pivots (the default is hlc3 and low .
— The mean of the hi/lo pivot values of the last few thousand chart bars can be displayed. Pivots having lasted longer during the mean's period will weigh more in the calculation. The mean can be displayed in running mode and/or only showing its last level as a long horizontal line. I don't find it very useful; maybe others will.
► Markers and Alerts
— Markers can be configured on breaches of either the last hi/lo pivot levels, or the hi/lo mean. Crossovers and crossunders are controlled separately.
— Alerts can be configured using any of the marker combinations. As is usual for my indicators, only one alert is used. It will trigger on the markers that are active when you create your alert. Once your markers are set up the way you want, create your alert from the chart/timeframe you want the alert to run on, and be sure to use the “Once Per Bar Close” triggering condition. Use an alert message that will remind you of the combination of markers used when creating the alert. If you use multiple markers to trigger one alert, then having the indicator show those markers will be important to help you figure out which marker triggered the alert when it fired.
A quick look at the pattern of these markers will hopefully convince you that using them as entry/exit signals would be perilous, as they are prone to whipsaw. I have included them because some traders may use the markers as reminders.
Using Pivots
These pivots can be used in a few different ways:
— When using the high / low sources they will show extreme levels, breaches of which should be more significant.
— Another way to use them is with hlc3 (the average of the high , low and close ) for hi pivots and low for the lo pivots. This accounts for my personal mythology to the effect that drops typically reach previous lows more easily than rallies make newer highs.
— Using low for hi pivots and high for lo pivots (so backward) can be a useful way to set stops or to detect weakness in movements.
You will usually be better served by pivots if you consider them as denoting regions rather than precise levels. The flexibility in the display options of this indicator will help you adapt it to the way you use your pivots. To indicate areas rather than levels, for example, try using a brightness of 1 with a line thickness of 30. The cloud effect generated this way will show areas better than fine lines.
Realize that these pivot lines are positioned in the past, and so they are drawn after the fact because a given number of bars need to elapse before calculations determine a pivot has occurred. You will thus never see a pivot top, for example, identified on the realtime bar. To detect a pivot, it takes a number of bars corresponding to the dilation of the higher timeframe in the current one, multiplied by the number of bars you use for your pivots' right leg. Also note that the Pine native function used to detect pivots in this indicator considers a summit to be a top when the number of bars in each leg are lower or equal to that top. Bars in legs do not need to be progressively lower on each side of the pivot for a pivot to be detected.
If you program in Pine
— See the Pinecoders MTF Selection Framework for an explanation of the functions used in this script to provide the selection mechanism for the higher timeframe.
— This code uses the Pine Script Coding Conventions .
Thanks
— To the Pine coders asking questions in the Pine Script chat on TV ; your questions got me to write this indicator.
Pivot Points High Low & Missed Reversal Levels [LuxAlgo]Pivot Points High/Low, sometimes referred to as "Bar Count Reversals" allows highlighting market prices local tops and bottoms. This method compares the price value at a certain index within a user-specified window length and tests whether it is the highest (pivot high) or lowest (pivot low).
This method can return successive pivots of the same type, thus missing certain reversals, as such, we aimed to highlight those missed reversals and provide a level at their location to determine if they had any significant role to play. A zig-zag is additionally built, connecting regular pivots with missed reversals.
Settings
Pivot Length: Determine the "Bar Count Reversals" window size. higher values will highlight more significant reversals.
Other settings control the look of the displayed graphical elements within the indicator.
Usage
Missed reversals are highlighted by labels with a ghost emoji, a Zig-Zag line connecting a missed reversal is dashed. Note that labels are offset by -Pivot Length bars (with the exception of the most recent one), and as such are detected further ahead of their location.
When a missed reversal is detected, a level is displayed, starting at the location of the missed reversal and ending when a new missed reversal is detected.
These levels can be used as support and resistance.
The most recent label estimates the possible location of a confirmed reversal, and will continuously readjust whether price makes a new higher high/lower low depending on the type of previously detected pivot. A level is also made out of this estimated reversal.

Pivot Points High Low ExtensionPivot Points High Low Extension
See Also:
- A Simple 1-2-3 Method for Trading Forex
- The Classic 1-2-3 Pattern: An Underestimated Powerhouse
- Bulkowski's 1-2-3 Trend Change
Pivot Point Pivot points simply took the high, low, and closing price from the previous period and
divided by 3 to find the pivot. From this pivot, traders would then base their
calculations for three support, and three resistance levels. The calculation for the most
basic flavor of pivot points, known as ‘floor-trader pivots’, along with their support and
resistance levels.
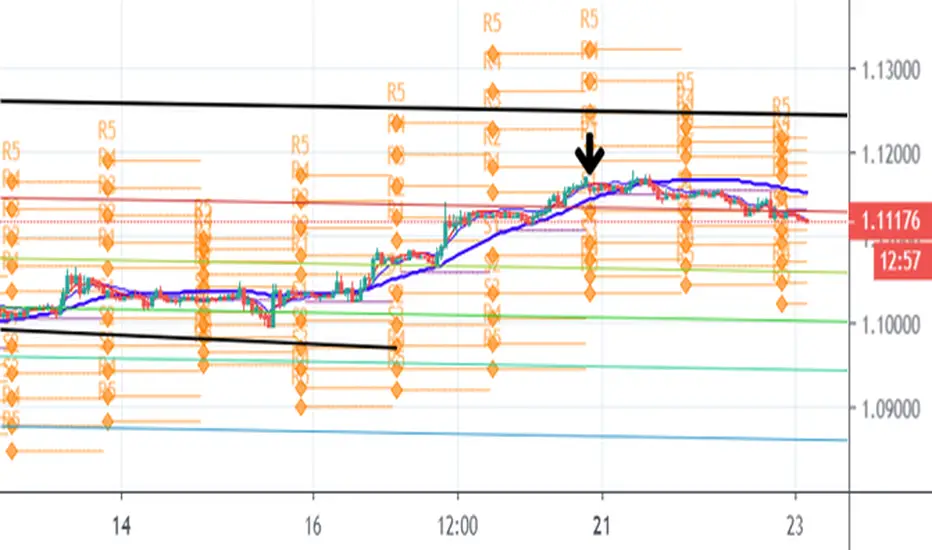
Pivot PointsPivot points are technical indicators used in financial markets (such as stocks, forex, or commodities) to identify potential turning points in price movement. They provide reference levels based on the previous day’s price action.
How to use the Pivot Points indicator
Traders use pivot points to identify significant price levels where the market may reverse or consolidate.
PP, S1, and R1 are considered primary levels, while S2 and R2 are secondary levels.
R3, R4, R5, S3, S4 and S5 are considered more extreme levels and we normally don't see price action trade near these levels on a typical day. This indicator calculates those extreme levels to help on days with extreme price action.
Pivot points can be calculated for different timeframes (daily, weekly, monthly, quarterly, 6-months and yearly).
Pivot points calculated using the daily timeframe is a popular chose among day traders traders who trade intraday timeframes.
Trading Strategies
Bounce Strategy:
Buy near support (S1 or S2) if the price bounces off these levels.
Sell near resistance (R1 or R2) if the price reverses from these levels.
Breakout Strategy:
If the price breaks above R1, consider a long position.
If the price breaks below S1, consider a short position.
Profit targets:
If in a long trade and price hits R1, you take some profit.
If in a short trade and price hits S1, you take some profit.
Combine pivot points with other technical indicators (e.g., moving averages, candlestick patterns) for confirmation. Remember that pivot points are just one tool among many, and their effectiveness varies across different markets and timeframes. Always practice risk management and consider the overall market context when using pivot points in your trading decisions.


Pivot Breakout with Trend ZonesOverview
Pivot Breakout with Trend Zones is a technical analysis indicator that identifies key pivot points and trend direction through dynamic candle coloring. It helps traders visualize breakouts and ongoing trends in real-time.
Key Features
🔍 Pivot Point Detection
Automatically identifies significant high and low pivot points
Customizable left/right bar parameters for sensitivity adjustment
Displays pivot levels as cross-style lines with offset positioning
🎨 Smart Candle Coloring
White candles: Breakout above pivot high (bullish signal)
Black candles: Breakout below pivot low (bearish signal)
Teal candles: Uptrend continuation
Coral Red candles: Downtrend continuation
Optional color fill toggle for customization
📊 Trend Identification
Automatically tracks trend direction after breakouts
Maintains trend state until opposite breakout occurs
Clear visual distinction between breakout and trend-following phases
Input Parameters
Pivot Settings
Left Bars (High/Low): Number of bars to the left of pivot
Right Bars (High/Low): Number of bars to the right of pivot
Display Options
Enable Candle Color Fill: Toggle color visualization on/off
Line Offset: Adjust pivot line positioning (-50 to 0 bars)
How It Works
Pivot Calculation: Uses TradingView's built-in pivothigh() and pivotlow() functions to detect significant turning points
Breakout Detection: Monitors when price closes beyond pivot levels, triggering trend changes
Trend Management: Once a breakout occurs, the indicator maintains the trend direction until a counter-breakout signals reversal
Visual Feedback: Provides immediate color-coded feedback for quick market analysis
Use Cases
Swing Trading: Identify entry points at pivot breakouts
Trend Following: Stay in trades during trend continuation phases
Market Structure: Visualize support/resistance levels and trend changes
Risk Management: Use pivot levels for stop-loss placement
Ideal For
Traders looking for clear visual trend identification
Technical analysts monitoring breakout opportunities
Anyone seeking to combine pivot analysis with trend following strategies
This indicator provides a clean, intuitive way to spot trend changes and follow market momentum with immediate visual feedback through candle coloring.

Pivot Move Ranges█ OVERVIEW
“Pivot Move Ranges” is an indicator that displays only the historical price ranges of moves that match the direction of the current swing.
It measures the price range of each individual swing and draws them as horizontal Δ-boxes positioned at the level of the most recently detected pivot.
The indicator operates with a delay equal to the set pivot detection length – after each new Pivot High, only red Δ-boxes appear showing the sizes of previous downward moves; after each new Pivot Low, only green Δ-boxes appear showing the sizes of previous upward moves. When the swing direction changes, the displayed set of levels instantly switches to the opposite direction.
█ CONCEPTS
The indicator was created to instantly provide the trader with objective, real historical price ranges – perfectly reinforcing classic tools such as Fibonacci extension/retracement, daily/weekly pivots, moving averages, order blocks, or Volume Profile.
It detects classic Pivot High and Pivot Low points:
- New Pivot High → only previous downward moves are shown (red Δ-boxes)
- New Pivot Low → only previous upward moves are shown (green Δ-boxes)
This ensures that at any moment you see only the historical ranges that match the current market direction. Price moves very often repeat themselves – the indicator makes these recurring levels immediately visible and ready to serve as natural reinforcement for other technical analysis tools.
█ FEATURES
- Pivot High / Pivot Low detection with adjustable length (default 12)
- Δ-boxes – thin horizontal lines showing the exact size of previous moves that match the current swing
- Automatic switching of the Δ-box set whenever a new opposite pivot appears
- Memory of the last N moves (default 6, max. 50) – oldest are automatically removed
- Labels showing move size (Δ) and start date/time
- Full color customization (separate for up and down), border and text transparency
- Choice of date format (DD.MM.YYYY or MM/DD/YYYY)
- Small circles marking the exact pivot locations
█ HOW TO USE
Add the indicator to your TradingView chart → paste the code → Add to Chart.
Settings:
- Pivot Length – higher values = fewer but more significant pivots (detected with a delay equal to this length)
- Max Corrections to Keep – how many previous matching moves are displayed at once
- Upward / Downward Box Color – colors of the Δ-boxes
- Box Border Transparency (%) – 0 = solid lines, 50–70 = subtle
- Show Δ Text + Move Start Date – turn labels on/off
Interpretation:
At any given moment the chart shows only the historical ranges of moves in the current direction:
- after a Pivot High → red Δ-boxes = “how far the market previously fell”
- after a Pivot Low → green Δ-boxes = “how far the market previously rose”
█ APPLICATIONS
- Instant reinforcement of technical levels – historical moves matching the current swing direction often coincide with Fibonacci levels, daily/weekly pivots, moving averages, or order blocks
- Fast cluster detection – set a high Max Corrections value (30–50) to see where the largest number of similarly sized moves cluster, then reduce to 6–10 and focus only on the most recent levels
█ NOTES
- On very strong trends, Δ-boxes can be extremely long – this is normal and correct behavior
- Always use as a supporting layer alongside other technical analysis tools

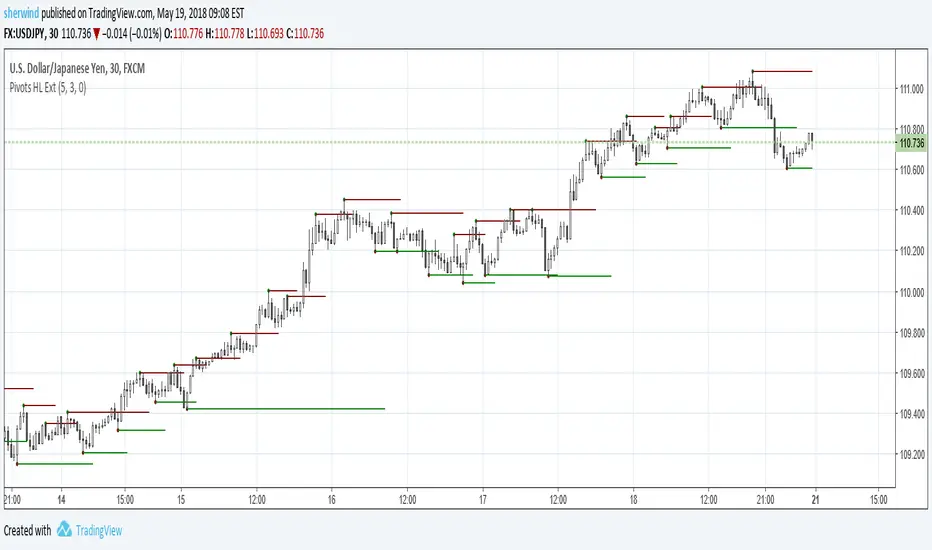
Pivot Points High Low Multi Time Frame + AlertsThis script is a modified version of “Pivot Points High Low Multi Time Frame” for TradingView, enhanced with price alerts when the market reaches or crosses recent pivot levels.
What it does:
Detects Pivot Highs and Pivot Lows based on your chosen timeframe and bar settings.
Draws visual lines and labels at each pivot level for clear identification.
Keeps track of the latest pivot high and low values.
Triggers an alert condition when the price crosses either of those pivots.
Alert conditions included:
🔔 Price Crossed Pivot High — notifies when the price touches or moves above the last pivot high.
🔔 Price Crossed Pivot Low — notifies when the price touches or moves below the last pivot low.
How to use:
Add the script to your chart in TradingView.
Click the Alarm (🔔) icon → choose Add Alert.
Under Condition, select this indicator and pick one of the two alert types.
Choose your preferred alert frequency (Once per bar, Every time, etc.).
Tip: You can also visually see when alerts are triggered — small green and red triangles will appear above or below the bars where the price crosses a pivot.

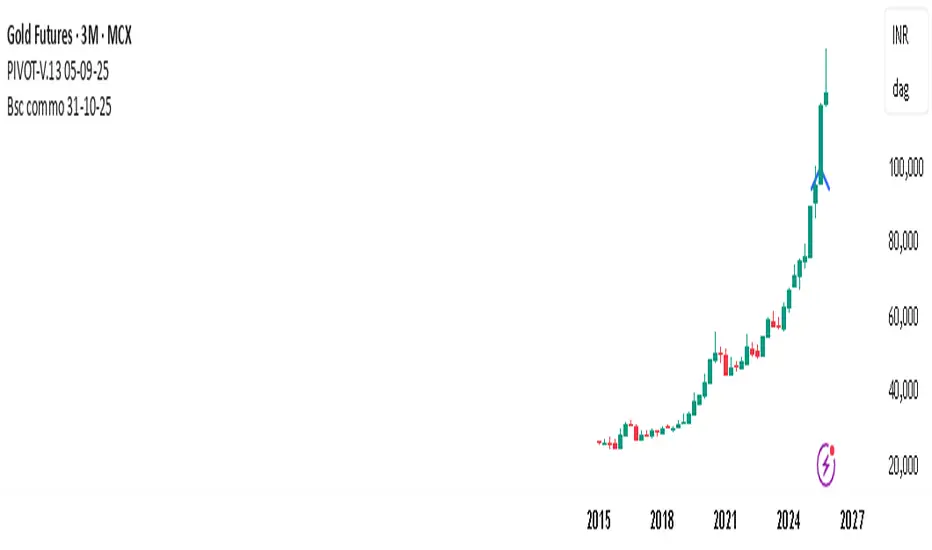
PIVOT-V.13 05-09-25This Pine Script automatically detects pivot levels and generates buy/sell signals based on price action around those pivots. It identifies key support and resistance zones derived from previous period highs, lows, and closes, then marks optimal entry, target, and stop-loss levels on the chart.
The script is designed to assist traders in systematic decision-making using pivot-based strategies.
🔍 Core Features
Automatic Pivot Detection: Calculates and updates pivots in real-time using standard formulas.
Smart Trade Setup:
Buy Signal: Triggered when price action confirms strength above a pivot or resistance level.
Sell Signal: Triggered when price action confirms weakness below a pivot or support level.
Entry, Target & Stop-Loss Levels: Automatically plots potential entry points, stop-loss levels, and take-profit zones based on the nearest pivot structure.
Customizable Settings:
Choose pivot type and timeframe (daily, weekly, or monthly).
Adjust risk ratio, stop size, and confirmation filters.
Enable/disable visual labels or alerts.
Visual Clarity: Clearly marks all pivot levels and trade signals on the chart with colored labels and lines.
🎯 Purpose
This script helps traders quickly identify high-probability entry zones and maintain disciplined trade management by following pre-defined pivot-based rules — reducing emotional bias and enhancing consistency.
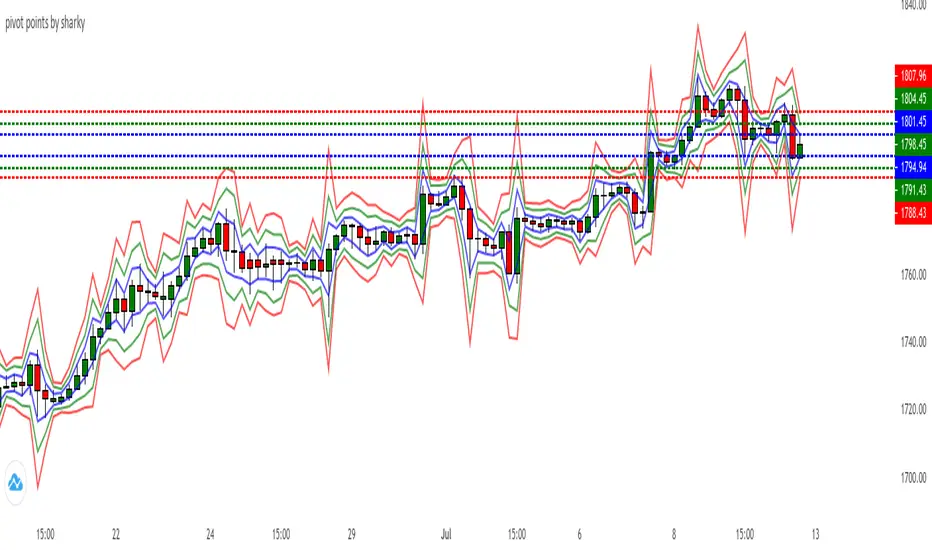
Pivot Points mura visionWhat it is
A clean, single-set pivot overlay that lets you choose the pivot type (Traditional/Fibonacci), the anchor timeframe (Daily/Weekly/Monthly/Quarterly, or Auto), and fully customize colors, line width/style , and labels . The script never draws duplicate sets—exactly one pivot pack is displayed for the chosen (or auto-detected) anchor.
How it works
Pivots are computed with ta.pivot_point_levels() for the selected anchor timeframe .
The script supports the standard 7 levels: P, R1/S1, R2/S2, R3/S3 .
Lines span exactly one anchor period forward from the current bar time.
Label suffix shows the anchor source: D (Daily), W (Weekly), M (Monthly), Q (Quarterly).
Auto-anchor logic
Intraday ≤ 15 min → Daily pivots (D)
Intraday 20–120 min → Weekly pivots (W)
Intraday > 120 min (3–4 h) → Monthly pivots (M)
Daily and above → Quarterly pivots (Q)
This keeps the chart readable while matching the most common trader expectations across timeframes.
Inputs
Pivot Type — Traditional or Fibonacci.
Pivots Timeframe — Auto, Daily (1D), Weekly (1W), Monthly (1M), Quarterly (3M).
Line Width / Line Style — width 1–10; style Solid, Dashed, or Dotted.
Show Labels / Show Prices — toggle level tags and price values.
Colors — user-selectable colors for P, R*, S* .
How to use
Pick a symbol/timeframe.
Leave Pivots Timeframe = Auto to let the script choose; or set a fixed anchor if you prefer.
Toggle labels and prices to taste; adjust line style/width and colors for your theme.
Read the market like a map:
P often acts as a mean/rotation point.
R1/S1 are common first reaction zones; R2/S2 and R3/S3 mark stronger extensions.
Confluence with S/R, trendlines, session highs/lows, or volume nodes improves context.
Good practices
Use Daily pivots for intraday scalps (≤15m).
Use Weekly/Monthly for swing bias on 1–4 h.
Use Quarterly when analyzing on Daily and higher to frame larger cycles.
Combine with trend filters (e.g., EMA/KAMA 233) or volatility tools for entries and risk.
Notes & limitations
The script shows one pivot pack at a time by design (prevents clutter and duplicates).
Historical values follow TradingView’s standard pivot definitions; results can vary across assets/exchanges.
No alerts are included (levels are static within the anchor period).

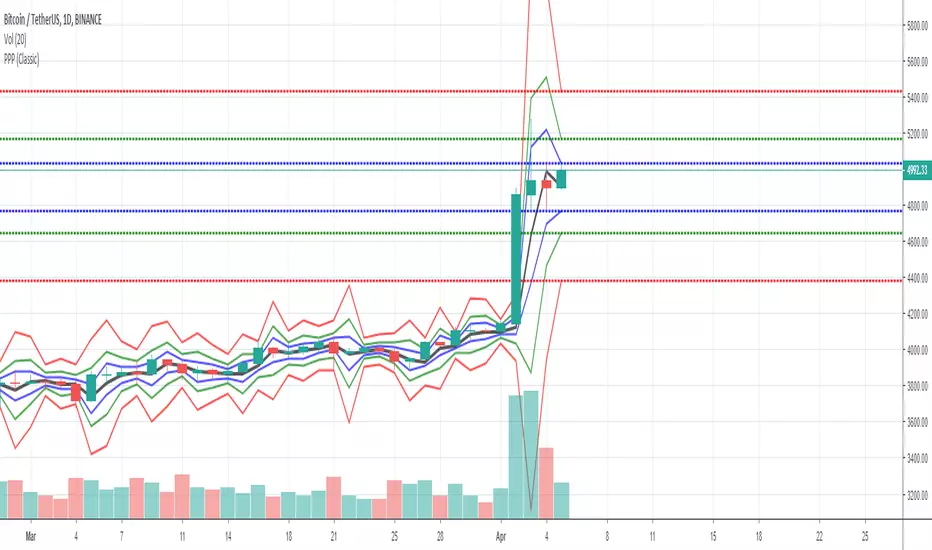
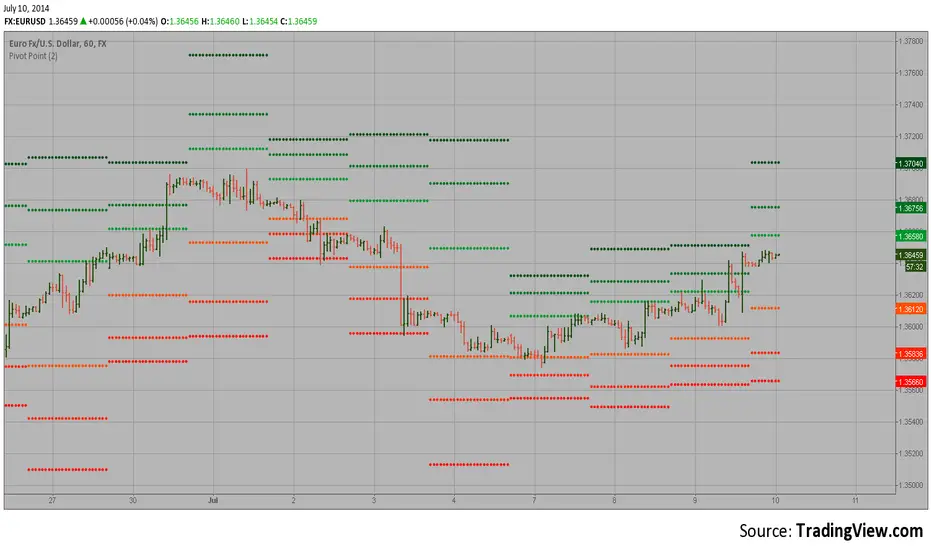
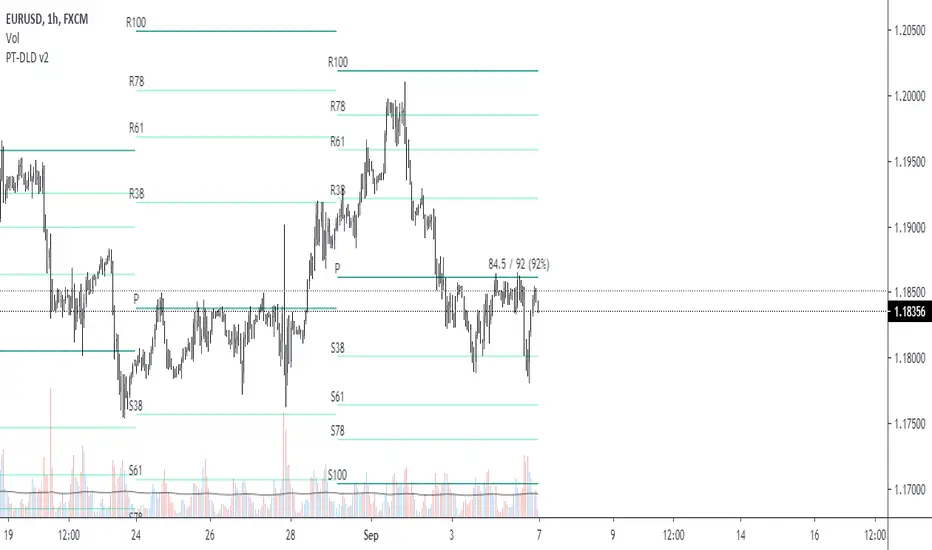
Pivot Fibonacci TradingWe use fibonacci in many things, why not the Pivot? Hey, it does works, price does reacts to the fibonacci off the pivot.
Pivots are road map for the price, fibonacci are just some stops or gas stations appear on the road, with these additional lines, there's more time for price to think about which way it'd move, therefore, more time for us traders to track and follow.
I know they usually use Daily pivot in H1, Weekly in H4 and Monthly in Daily timeframe, but since there are more lines now, price now needs space to travel between line. I recommend using Weekly Pivot for intraday(H1,...), Monthly for H4 and Yearly for Daily.
I also add some text that shows current day's range in pips (High - Low = range) and compare it to Average Daily Range. I thinks this is helpful if you use it for day trading.
I'll let this as a open sources as you may find something to customize in your own way.
Hope this helps you in someway, community :)
Happy trading!
#Thanks to @Davit on forexfactory for the idea
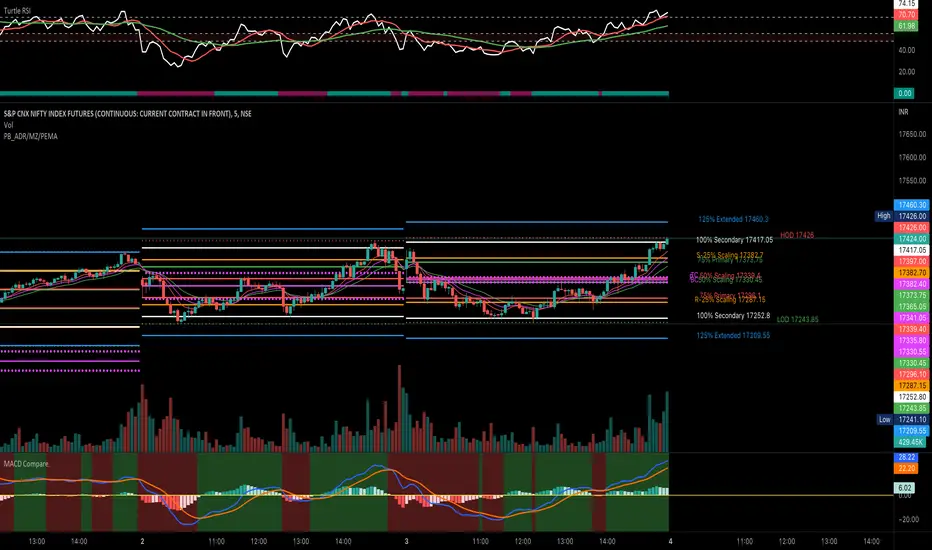
PivotBoss ADR LevelsBased on Pivot Boss ADR Methodology
Can be used only in Intraday - Hope someone will make it for all TF
All available script in TV do not have scaling at 25%
Due to which price needs to reach at 50% to derive any conclusion
This script solves this issue and can be used in sideways market as it provides scaling at 25 %
Script is original in its way to solve problem in sideways market