Moving Averages & PivotsOptional MA and Pivots which can be changed as per your needs.
Moreover you can opt to see all and none at all or some.
Search in scripts for "pivot"

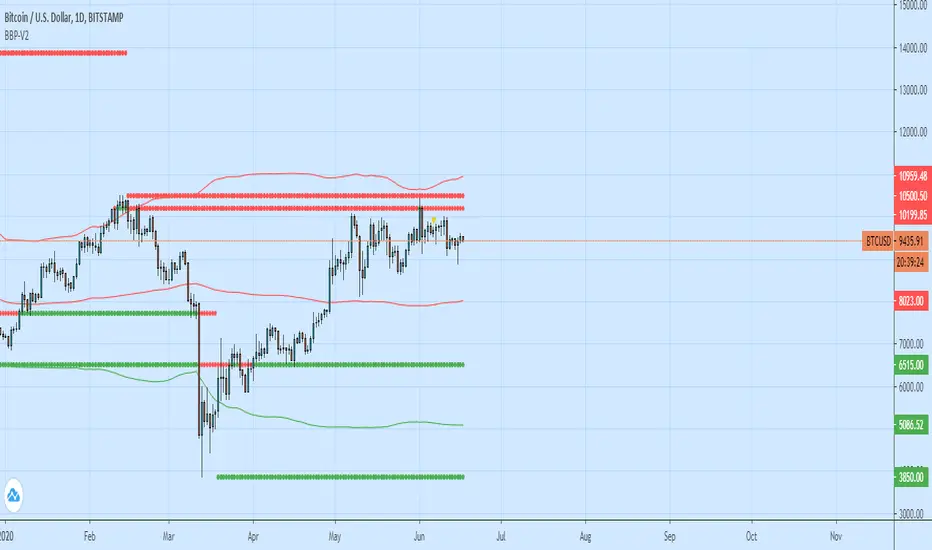
Bollinger Bands + Pivots - V2It drawes a higest or lowest pivot when price intersects with bollinger bands.
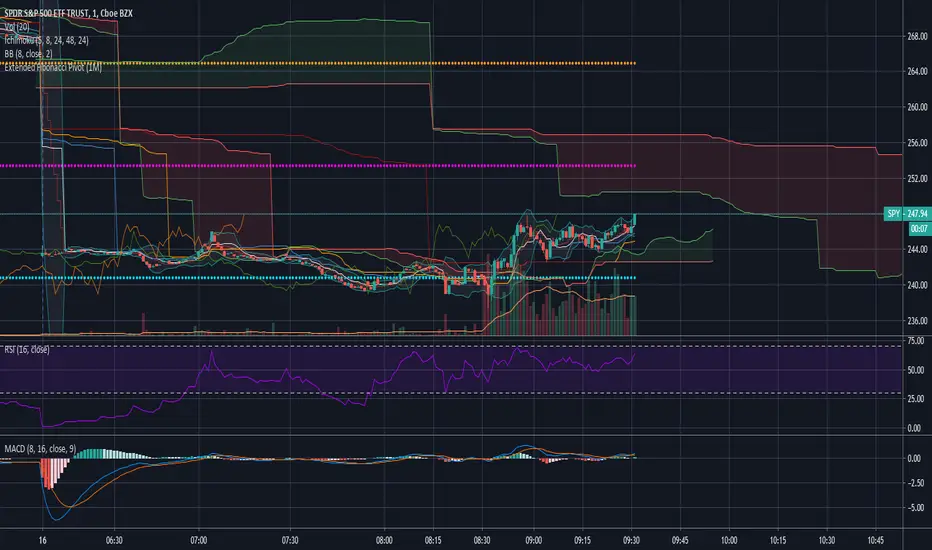
Hakimi - Ichi Based Pivot Time Prediction - V.2This indicator is based on multitime ichimoku and can be used to predict some of pivots .
How to use:
1- Select the arbitrary chart (Candles, Heikin Ashi, Line and Renko) and time frame.
2. Set the “Offset” value. Default value is -1.
3. Set the “Time Coefficient 1” to “Time Coefficient 4”. Default values are 2, 3, 4 and 5.

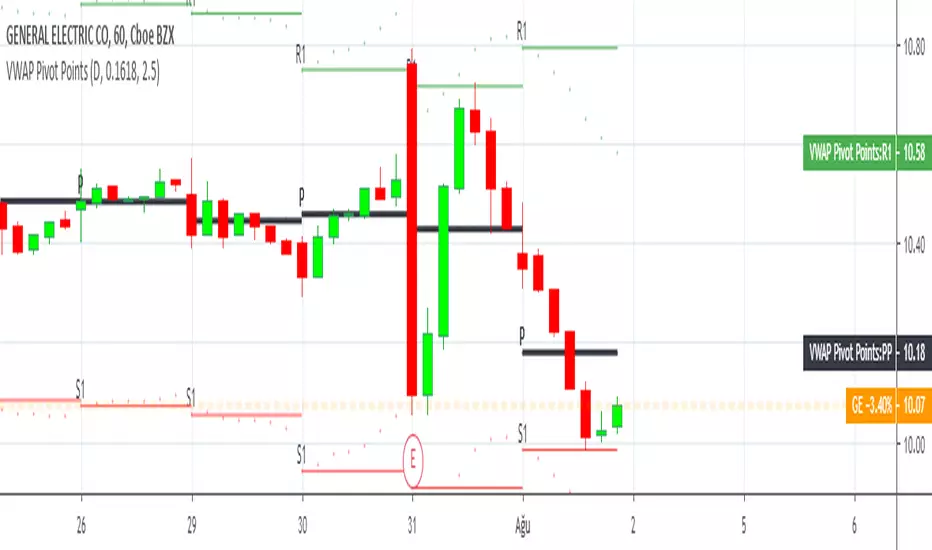
Extended Fibonacci PivotEditable Fibonacci Pivots. 0.236, 0.382, 0.618, 0.786, 1.000. Easy to extend further if needed. Can be used with intervals from 1 minute to 1 Day.
A Few Recommended timeframes:
1 minute chart - 15 Minute Pivot Timeframe
3 minute chart - 1 Hour Timeframe or Daily Timeframe
15 Minutes to < 60 Minutes - Daily Timeframe
1 Hour to 4 Hour - Weekly Timeframe
Daily - Monthly Timeframe
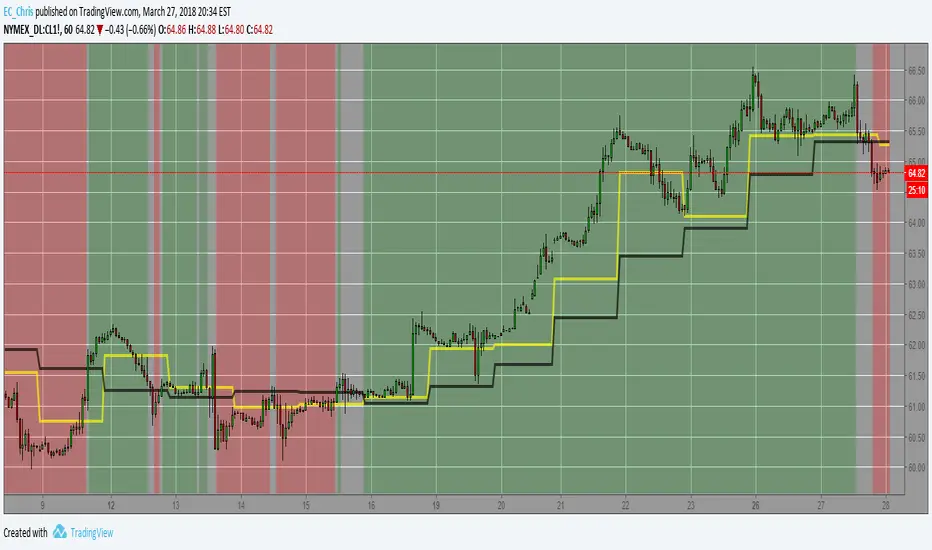
True Rolling Pivot Range IndicatorHere is the actual 3 day rolling pivot range indicator as detailed in Mark Fisher's book The Logical Trader.
LL-HL PivotThis indicator scans for the bullish structure known as a Higher Low (HL) across multiple lengths simultaneously, automatically selects the most suitable pattern, and plots it on the chart.
Below is a detailed explanation of how it works.
1. Basic Calculation Method (Definition of LL and HL)
This indicator is built on TradingView’s ta.pivotlow function.
Detecting Pivot Lows
For a given length, a Pivot Low is identified as the lowest point among the candles within the specified range to the left and right.
LL and HL Determination
LL (Lowest Low): The most recent Pivot Low is treated as the previous low.
HL (Higher Low): When a new Pivot Low forms above the previous LL, it is recognized as an HL, and the setup is considered “complete.”
Identifying the Pivot Line
During the LL–HL structure, the highest high between them is identified and used as the breakout level (Pivot Line / resistance), where a horizontal line is drawn.
2. Multi-Length Scanning
Unlike standard indicators that use only one length (e.g., Length = 5), this indicator evaluates a full range of lengths.
Min Length to Max Length
Example: Min = 2, Max = 10
Internally, it functions as if nine separate indicators (Length 2, 3, 4 … 10) are running simultaneously.
This allows the indicator to capture:
Small waves (short-term pullbacks)
Larger waves (broader structural moves)
3. Priority Mode System
Because multiple lengths are calculated at the same time, different LL–HL patterns may appear simultaneously.Priority Mode determines which setup is selected and displayed.
A. Lowest LH
Selects the pattern with the lowest pivot line (intermediate high).
Advantages:
Produces the lowest possible entry price
B. Longest Length
Selects the pattern with the longest length.
Advantages:
Focuses on larger structures and broader waves
Filters out noise
C. Shortest Length
Selects the pattern with the shortest length.
Advantages:
Reacts quickly to small moves
Useful for scalping or fast trend-following
Captures very short-term pullbacks
4. Additional Behavior and Features
Real-Time Invalidation
If price breaks below the confirmed HL, the structure is immediately considered invalid.
All previously drawn lines and labels are removed instantly, preventing outdated structures from remaining on the chart.
Pivot Line Extension
As long as the HL remains intact, the Pivot Line (breakout level) continues extending to the right.
Alerts
An alert can be triggered the moment price breaks above the Pivot Line on a closing basis.

Tomo's Pivots // last W, last M, last Q, last30d, last90d.These are pivots that you can use to look back at various time periods to find magnetic Price points of support and resistance. There are: weekly, last 30 days, last month, last 90 days, and last quarter. You can change the color and style of every indicator and its label. So if it happens to be November 29 today, you will see the last 90 days representing 90 days before November 29. But you will also see last quarter which represents from July 1 to September 30. These values are fair value equilibrium price point by averaging the high low and close of that time period. Weekly is great for intraday trading and the last 30 is great for momentum. Consider using the monthly for swing trading. Stay in the green.

VWAP Multi Sessions + EMA + TEMA + PivotThis indicator combines several technical tools in one, designed for both intraday and swing traders to provide a complete view of market dynamics.
- VWAP Multi Sessions: calculates and plots five independent VWAPs, each based on a specific time range. This allows you to better identify value zones and price evolution during different phases of the trading day.
- Moving Averages (EMA): three strategic EMAs (55, 144, and 233 periods) are included to track the broader trend and highlight potential crossovers.
- TEMA (Triple Exponential Moving Average): two TEMAs (144 and 233 periods) offer a more responsive alternative to EMAs, reducing lag while filtering out some market noise.
- Daily Levels: the previous day’s open, close, high, and low are plotted as key support and resistance references.
- Pivot Point (P): also included is the classic daily pivot from the previous session, calculated as (High + Low + Close) / 3, which acts as a central level around which price often gravitates.
In summary, this indicator combines:
- intraday value references (session VWAPs),
- trend indicators (EMA and TEMA),
- and daily reference points (OHLC and Pivot).
It is particularly suited for intraday, scalping, and swing trading strategies, helping traders anticipate potential reaction zones in the market more effectively.

Auto-Calculated Pivot Line/Zone (Based on Time Range)Automatically Calculated Pivot Line/Zone
Harness the power of precision with this Custom Time Range Average Line indicator—designed to pinpoint key equilibrium and pivot levels within consolidation zones after a breakout. Select any start and end time to capture the critical price action shaping the market structure between swings, and calculate the true average price using your choice of open, close, high, low, or midpoint.
Once the defined period concludes, the indicator freezes the average and extends it forward as a clear horizontal ray, acting as a powerful reference for fair value and market balance. This dynamic line shines brightest within consolidation phases, helping traders identify pivot points and equilibrium zones that often serve as magnets for price after a breakout.
Customize the line width to suit your style—use a thinner line width input for a precise single average line, or increase the width to visually represent a broader range or zone. Fully adjustable line color and thickness options ensure this tool integrates seamlessly into any chart setup.
Elevate your trading edge by visualizing the hidden balance points between market swings—turning consolidation chaos into clear, strategic opportunities!

Fibonacci Pivot Points & Previous D,W&M Highs/LowsIndicator Overview
This indicator combines Fibonacci Pivot Points with previous high and low levels for different timeframes (day, week, month). It plots these levels on the chart to provide traders with key support and resistance areas, making it easier to identify potential trading opportunities.
Features
Fibonacci Pivot Points:
The indicator calculates pivot points based on the high, low, and close prices.
Fibonacci levels are used to determine support (S1, S2, S3, S4, S5) and resistance (R1, R2, R3, R4, R5) levels.
Users can customize the Fibonacci levels for both support and resistance.
Previous Highs and Lows:
The indicator plots previous day, week, and month high and low levels.
Each of these lines can be customized in terms of visibility, color, and width.
This helps traders to see key historical levels that might act as support or resistance in the future.
Inputs and Customization:
Fibonacci Time Frame:
Users can select the timeframe for calculating the pivot points (Daily, Weekly, Monthly).
Fibonacci Levels:
Customizable input fields for each Fibonacci level (R1, R2, R3, R4, R5, S1, S2, S3, S4, S5).
Previous High/Low Lines:
Day Lines:
Options to show or hide previous day's high/low lines.
Customizable color and width for these lines.
Week Lines:
Options to show or hide previous week's high/low lines.
Customizable color and width for these lines.
Month Lines:
Options to show or hide previous month's high/low lines.
Customizable color and width for these lines.
Technical Calculations:
Fibonacci Pivot Points:
Calculated as:
pp = (High + Low + Close) / 3
S1 = pp - ((High - Low) * Fibonacci Level)
R1 = pp + ((High - Low) * Fibonacci Level)
Previous High/Low Levels:
Uses request.security to fetch previous high and low values for the selected timeframe.
Plotted using line.new to draw lines across the chart.
Plotting:
The indicator plots Fibonacci Pivot Points and previous high/low lines on the chart, using distinct colors for each level.
Customizable transparency and linewidths make it easier to visually interpret the levels.
This indicator is particularly useful for traders who rely on technical analysis to identify key support and resistance levels, offering a blend of historical data and Fibonacci-based predictions.
Feel free to ask if you have any specific questions or need further adjustments!

HTF EMA Pivot PointsHTF EMA Pivot Points - TradingView Indicator
📌 Overview
The HTF EMA Pivot Points indicator displays Exponential Moving Averages (EMAs) from higher timeframes (HTF) on your current chart. These EMAs act as dynamic support and resistance levels, helping traders identify key areas where price is likely to react.
⚡ Key Features
✅ Plots EMAs from multiple timeframes (1H, 4H, Daily)
✅ Works on any chart (1M, 5M, 15M, etc.)
✅ Acts as pivot points for price action, helping with trade entries & exits
✅ Customizable EMA lengths for flexibility
✅ Ideal for scalping, 0DTE options trading, and swing trading
🛠 How It Works
The script calculates EMAs from 1H, 4H, and Daily charts and overlays them on your current timeframe. These levels often act as support and resistance zones, where price tends to bounce or reject.
🎯 How to Use It for Trading
📍 Bullish Setup (Buy Calls)
• Price bounces off a higher timeframe EMA (e.g., 4H or Daily EMA)
• Confirmation with RSI or Fair Value Gaps (FVGs)
📍 Bearish Setup (Buy Puts)
• Price rejects from a higher timeframe EMA
• Confirmation with other indicators (RSI, MACD, Order Flow)
🚀 Why Use This Indicator?
• Filters out noise from lower timeframe EMAs
• Confirms trend direction using key moving averages
• Helps avoid false breakouts by identifying strong institutional levels
This is a must-have tool for traders who rely on higher timeframe confluence for scalping, options trading, or swing trading. 📈🔥

CPR with inside candle, Pivot Points and 4EMA The CPR trading strategy is a technical analysis approach that combines multiple indicators to determine potential price levels and trading opportunities. The strategy uses three main components: Inside Candles, Pivot Points, and the 4EMA.
Inside Candles: The Inside Candle pattern is a candlestick pattern where the current candle has a lower high and a higher low than the previous candle. This pattern can indicate a period of consolidation or indecision in the market and can signal a potential reversal or continuation of the trend.
Pivot Points: Pivot Points are technical indicators that use the previous day's price data to calculate key levels of support and resistance for the current trading day. These levels can act as potential areas of buying or selling pressure and can help traders identify potential entry and exit points.
4EMA: The 4EMA is a short-term Exponential Moving Average that tracks the average price of an asset over the previous four periods. This indicator is used to help identify short-term trends in the market and can signal potential buying or selling opportunities.
To apply the CPR strategy, traders first look for Inside Candles on their chart, indicating a period of consolidation or indecision in the market. Next, they identify the Pivot Points for the current trading day, which can act as potential areas of support or resistance. Finally, traders use the 4EMA to confirm the direction of the trend and potential entry or exit points.
For example, if an Inside Candle forms at a Pivot Point level and the 4EMA is indicating an uptrend, this could be a potential buying opportunity. Conversely, if an Inside Candle forms at a Pivot Point level and the 4EMA is indicating a downtrend, this could be a potential selling opportunity.

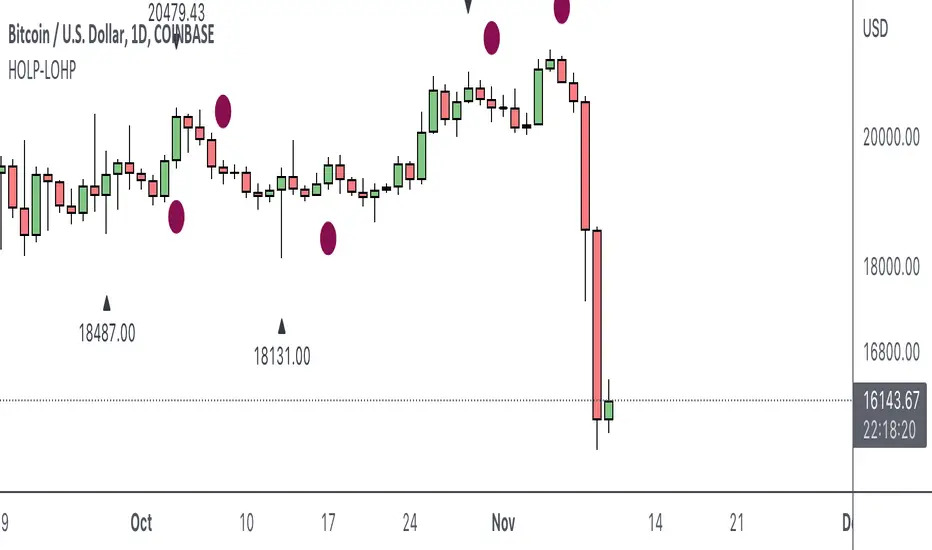
HOLP LOHP PivotCOINBASE:BTCUSD
HOLP and LOHP based on John Carter's Mastering the Trade.
HOLP stands for High Of the Low Period
LOHP stands for Low Of the High Period
This indicator is based on John Carter’s HOLP and LOHP from Mastering the Trade. The basic idea is to identify the session high and mark the low of the session high for a short entry, and vice versa for a long entry.
The default look back period is set to 10 here, albeit John Carter didn’t specify a hard coded number but rather the use of experience and common sense.
Option to turn on labels of the highs and lows of the pivots.
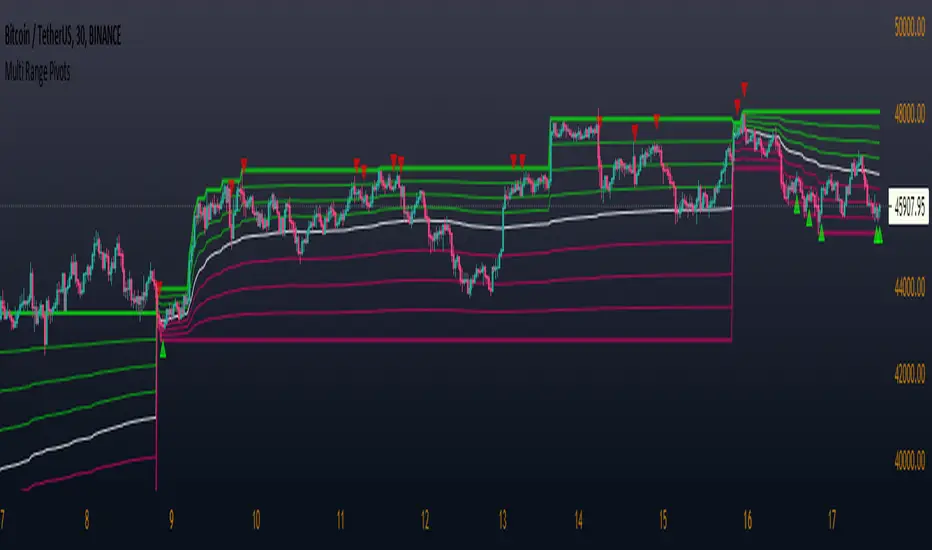
Multi Range Pivots
Multi Range Pivots works by recognizing the high and low of the timeframe selected and plotting range high to MEAN averages and range low to MEAN averages.
This is essentially the VWAP pivots updated to include not only VWAP as a MEAN, but also SMA, EMA, VWMA, DEMA, TEMA, TRIMA, KAMA, MAMA, T3, H/L basis and Donchian basis.
Also, with high and low no longer repainting, I was able to add true reliable signals.
Enjoy

Smart Indicator 28 - Swing Pivots (Higher Highs and Lower Lows)A simple way to find Higher Highs and Lower Lows (HH and LL) whit automatic Fibonacci Lines in the most common levels.
In this indicator the Higher Highs only happens when a high value are rising from each other in the last "Length of Real Pivots" highs and the next same number of highs are falling in every single bar.
The Lower Lows are inverted, LL only appears if a low is falling in every single bar in the last number of length and the lows price of the "n" bars next are rising.
You can use this Indicator in any kind of market.

Pocket Pivot IndicatorFrom Gil Morales and Chris Kacher (O'Neil's disciples). Designed to find buy points in bases and continuation buy points in an uptrend. The volume today must be greater then the maximum down volume of the past 10 trading days. Recommended to use in conjunction with the 10 day and/or 50 day moving average.
Typical use :
Scan for pocket pivots.
Is stock strong fundamentally? i.e- leader in it's sector
Has the stock developed a base ?(see O'Neil's work for base discussion)
Is the stock breaking through or bouncing off the 10 period sma? (can use 50 sma too)
If so.. a possible buy.
Cheers
David

Shashwat Khurana's Pivot + Mean Reversion + RSI (Signals Only)Show BUY labels below bars when a bullish reversal is detected.
Show SELL labels above bars when a bearish reversal is detected.
Uses pivot levels, mean reversion, big candle, RSI, and volume filters.

ICT Killzones + Pivots [TFO]Designed with the help of TTrades and with inspiration from the ICT Everything indicator by coldbrewrosh, the purpose of this script is to identify ICT Killzones while also storing their highs and lows for future reference, until traded through.
There are 5 Killzones / sessions whose times and labels can all be changed to one's liking. Some prefer slight alterations to traditional ICT Killzones, or use different time windows altogether. Either way, the sessions are fully customizable. The sessions will auto fit to keep track of the highs and lows made during their respective times, and these pivots will be extended until they are invalidated.
There are also 4 optional Open Price lines and 4 vertical Timestamps, where the user can change the time and style of each one as well.
To help maintain a clean chart, we can implement a Cutoff Time where all drawings will stop extending past a certain point. The indicator will apply this logic by default, as it can get messy with multiple drawings starting and stopping throughout the day at different times.
Given the amount of interest I've received about this indicator, I intend to leave it open to suggestions for further improvements. Let me know what you think & what you want to see added!

Seasonal pivot datesPlots approximate equinox and solstice dates, which are often zones around which market pivots occur.

Saty Pivot RibbonA 3 EMA Ribbon + Conviction EMAs system that simplifies measuring and using EMAs for trend and support/resistance . If you are familiar with using a faster EMA (8 or 9) with a pivot EMA (21) you should feel right at home.
Features include:
- 3 EMA Trend Ribbon (8, 21, 34 default)
- 2 color system for showing bullish trend (green + blue)
- 2 color system for showing bearish trend (red + orange )
- Ribbon folding visual indicates EMA crossover
- Conviction Arrows based on 13/48 EMA crossover
- 13/48 Conviction EMAs
- Time Warp: Warp the Ribbon into a different timeframe than the chart.
Inspired by Ripster EMA Clouds.

[GarufiCommunity] Multi Indicator: VWAPs, MA, Pivot PointsThis script provides a collection of indicators to help traders look at multiple trends while maintaining a consistent configuration, even when jumping around different timeframes and symbols.
Additionally, this collection is particularly useful when trading decisions involve looking at dozens of indicators and analyzing, in aggregate, their confluence.
With this collection of indicators you can configure anchored VWAPs, MA, and Pivot Points:
- Anchored VWAPs: For each you define a fixed time and date to anchor it in the graph, and it stays consistent even when you change the symbol. An example use case can be setting one of the VWAPs to always start on the first candle on January 1st 2021, and a second VWAP a decade prior, so you don’t need to keep manually adjusting/adding VWAPs to the graph. At the moment you can define up to 4 anchored VWAPs.
- MA and Pivot Points: For each you can set independent timeframes, periods, and types, while using a single configuration panel. This helps reduce the amount of clicking needed when trying different configurations, such as testing different MA and Pivot periods and comparing how each behave in the graph (this personally helps me build trust in indicators). Permits use of up to 3 MAs and 2 Pivot Points.
Lastly, this script leverages and reuses modified code from the sources below:
- Médias e Tempos-v.2.1 by VeraLucia (with permission);
- Multiple Anchored VWAP v1.0 by GuilhermeNogueira (with permission);
- Pivot Point by TradingView.
