Ichimoku Kinkō hyō 目均衡表█ OVERVIEW
Ichimoku is known to be an Indicator that completes itself, for its power but also for its complexity. This is why I decided to improve the work of
Goichi Hosoda in order to offer the maximum number of options for the most seasoned users but also beginners with options to simplify the
reading of Ichimoku (such as a panel directly giving you the status of each Ichimoku options or Supports/Resistances drawn automatically
according to the conditions chosen in the settings.
█ OPTIONS
Here is the complete list of options to implement :
- "Source" and "Alternative Source" (with lots of choices)
- Heikin Ashi volume.
- Weighted Moving Average Smoothing
- Minimum, Maximum and Adaptive Percentage Length adjustable for Tenkan-Sen, Kijun-Sen, Chikou Span and Senkou-Span)
- The Chikou has a Filter with modifiable Length (in Lookback Percentage)
- Advanced Filter Settings: Volume, Tenkan-Sen/Kijun-Sen Cross, Volatility, Tenkan-Sen Equal Kijun-Sen, Chikou Greater Than Price,
Chikou Momentum, Price Greater Than Kumo, Price Greater Than Tenkan-Sen, Chikou Trend Filter .
- Oscillator volume adjustable via drop-down menu with 5 types of oscillators available: "TFS Volume", "On Balance Volume",
"Klinger Volume", "Cumulative Volume", "Volume Zone".
- Relative Volume Strength Index with Length, Peak and EMA's adjustable. 3 Oscillators available: “On Balance Volume”,
“Cumulative Volume”, “Price Volume Trend”.
- Volatility adjustable with Fast and Slow Length.
- Totally customizable Support and Resistance.
- Bar Trend Color based on chosen settings.
- Fully customizable help panel.
- Alerts available for: Labels Detection, Support/Resistance Line Cross, Panel Trend Status Direction.
█ NOTES
Remember to only make a decision once you are sure of your analysis. Good trading sessions to everyone and don't forget,
risk management remains the most important!
Search in scripts for "relative volume"

Volume Adaptive Bollinger Bands (MZ VABB)This indicator is a functional enhancement to John Bollinger's Bollinger Bands. I've used Volume to adapt dynamic length which is used in basis (middle line) of Bollinger Bands and Simple Moving Average is replaced with Adaptive Ehlers Deviation Scaled Moving Average ( AEDSMA ).
BOLLINGER BANDS BASIC USAGE AND LIMITATIONS
Bollinger bands are popular among traders because of their simple way to detect volatility in market and redefine support and resistance accordingly. These are some basic usages of original Bollinger Bands:
Most commonly Bollinger Band works on 20 period Simple Moving Average as Basis / Middle Line and standard deviation of 2 for volatility detection.
Upper and lower bands can act as support and resistance which accordingly update with standard deviation of same period as of Simple Moving Average.
As upper and lower bands act as volatility measure which benefits in Squeeze detection and breakout trading.
Among all the usages there are some limitations as follows:
Original Bollinger Bands use 20 period Simple Moving Average as Basis which itself restricted to some number of data pints and if market moves in one direction or simply goes sideways for long time; candles can stay on either bands for long time. This gives benefit for staying in directional trade but will completely nullify the use of both bands as support and resistance.
Above point simply be explained as markets can stay overbought / oversold for long time and one way to make Bollinger Bands more useful is to simply use higher periods in SMA but as we know with higher periods SMA becomes more laggy and less adaptive.
Most traders use BBs alongside some other Volume Oscillator for example "On Balance Volume" but that does solve BBs limitations issue that it should be more adaptive to detect volatility in market.
VOLUME ADAPTIVE BOLLINGER BAND WORKING PRINCIPLE
Best way to make original Bollinger band more adaptive was to just use dynamic length instead on constant 20 period. This dynamic length had to be based on some other powerful parameter which can't be volatility as BB itself is a volatility indicator and adapting its length based volatility would have been superimposing volatility on Bollinger bands giving unrealistic results.
For adaptive length, I tried using Volume and for this purpose I used my Relative Volume Strength Index " RVSI " indicator. RVSI is the best way to detect if Volume is going for a breakout or not and based on that indication length of Bollinger Band Basis Moving Average changes.
RVSI breaking above provided value would indicate Volume breakout and hence dynamic length would accordingly make Bollinger band basis moving average more over fitted and similarly standard deviation of achieved dynamic length would give better bands for support and resistance. Similar case would happen if Volume goes down and dynamic length becomes more underfit.
According to my back testing studies I found that Simple Moving Average wasn't the best choice for dynamic length usage in Bollinger Band Basis. So, I used Adaptive Ehlers Deviation Scaled Moving Average ( AEDSMA ) which is more adaptive and already modified to adapt with RVSI.
SLOPE USAGE FOR TREND STRENGTH DETCTION
Volume Adaptive Bollinger Bands are more reactive to market trends so, I used slope for trend strength detection.
If slope of Volume Adaptive Bollinger Band Basis (i.e. AEDSMA ), Upper and Lower Bands is supporting a trend at same time then script will provide signal in that direction. That signal can also use Volume as confirmation if Bollinger Bands trend direction is supported by Volume or not.
DYNAMIC COLORS AND TREND CORRELATION
I’ve used dynamic coloring in Basis ( AEDSMA ) to identify trends with more detail which are as follows:
Lime Color: Slope supported Strong Uptrend also supported by Volume and Volatility or whatever you’ve chosen from both of them.
Fuchsia Color: Weak uptrend only supported by Slope or whatever you’ve selected.
Red Color: Slope supported Strong Downtrend also supported by Volume and Volatility or whatever you’ve chosen from both of them.
Grey Color: Weak Downtrend only supported by Slope or whatever you’ve selected.
Yellow Color: Possible reversal indication by Slope if enabled. Market is either sideways, consolidating or showing choppiness during that period.
SIGNALS
Green Circle: Market good for long with support of Volume and Volatility or whatever you’ve chosen from both of them.
Red Circle: Market good to short with support from Volume and Volatility or whatever you’ve chosen from both of them.
Flag: Market either touched upper or lower band and can act as good TP and warning for reversal.
FIBONACCI BANDS
I’ve included Fibonacci multiple bands which would act as good support/resistance zones. For example, 0.618 Fib level act as good local support and resistance in both upper and lower zones. Fibonacci values can be modified but should be lower than 1.
DEFAULT SETTINGS
I’ve set default Minimum length to 50 and Maximum length to 100 which I’ve found works best for almost all timeframes but you can change this delta to adapt your timeframe accordingly with more precision.
Dynamic length adoption is enabled based on Volume only but volatility can be selected which is already explained above.
Trend signals are enabled based on Slope and Volume but Volatility can be enabled for more precise confirmations.
In “ RVSI ” settings "Klinger Volume Oscillator" is set to default but others work good too especially Volume Zone Oscillator. For more details about Volume Breakout you can check “MZ RVSI Indicator".
ATR breakout is set to be positive if period 14 exceeds period 46 but can be changed if more adaption with volatility is required.
EDSMA super smoother filter length is set to 20 which can be increased to 50 or more for better smoothing but this will also change slope results accordingly.
EDSMA super smoother filter poles are set to 2 because found better results with 2 instead of 3.
FURTHER ENHANCEMENTS
So far, I've achieved better results with "Klinger Volume Oscillator" in RVSI but TFS Volume Oscillator and On Balance Volume can be used which would change dynamic length differently. It doesn't mean that results would be wrong with some oscillator and precise with others but every oscillator works in its specific way for and RVSI just detect strength of Volume based on provided oscillator.

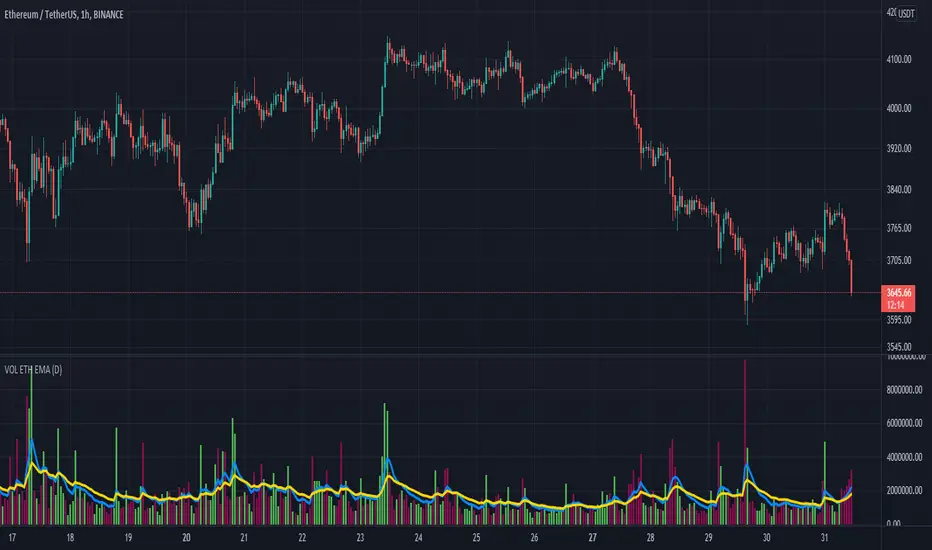
Performante's Average Ethereum Volume Indicator EMAThis indicator takes the volume from the biggest exchanges and plots the average volume. Exchanges incorporated in this average include Bitfinex, Coinbase, Bitstamp, Bitmex, Kraken, Binance, Bithumb, Flyer, OkEx, and CEX. The chart also has two Exponential Moving Averages (9-candle EMA & 21-candle EMA) added onto the volume pane to better understand relative volume. Thank you Julio and Mitch for this indicator
niceVOL (relative volume)Welcome to niceVOL - a quick display on if todays volume is above or below the average 30 day volume.
- When niceVOL is displayed in red and the number is below 100 we know todays volume is below average.
- When niceVOL is displayed in blue and the number is above 100 we know todays volume is above average.
The niceVOL indicator in the chart above is displaying a red color and a number below 100, this tells us todays volume is quite low and might be the reason why it isn't showing much movement.
Equation - ( todays volume / average 30 day volume ) * 100 = niceVOL
Below is snapshot of two assets, one with niceVOL above 100, in blue, and the other asset with niceVOL below 100, in red. This should give you a quick example of how easy it is to use.
Stay nice, this is not financial advice.
mrnicegvy

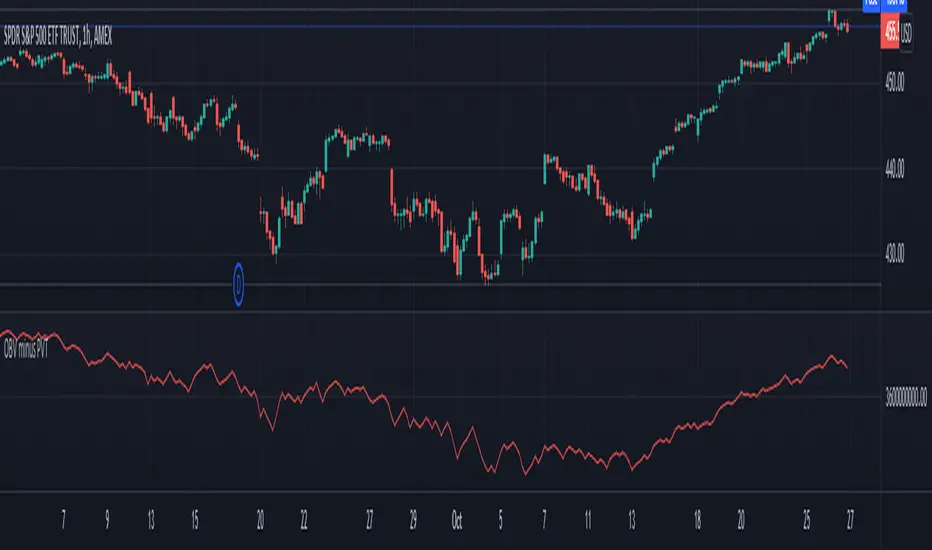
Volume Difference IndicatorThis indicator is a simple volume difference indicator.
How it works:
First we calculate the on balance volume, and then we calculate the price volume trend.
For those unaware, the OBV subtracts all volumes when price records a lower close and adds them in the case of a higher price close. In contrast, PVT subtracts or adds only a proportion of the volume from its cumulative total in relation to a percentage change in price.
Using this knowledge, we are using the difference of OBV (the indicator with the entire amount added or subtracted), minus PVT (which subtracts a percent based on the percentage in price), this gives us a unique indicator which out puts a more whole picture of the two indicators. It shows us the difference of absolute volume minus relative volume based on the percent of close price. It allows us to see large shifts in volume BEFORE it happens.
How to use this indicator:
When there is a sharp increase of Volume Difference Indicator, but close has NOT risen, price tends to rise immediately following this. When the Volume Difference Indicator drops, but price has NOT changed, price tends to fall immediately following this.
TradeGuider VSA LiteThe TradeGuider VSA Lite package is designed for those traders who want to trade in harmony with the professionals (‘smart money’) and is based on Tom Williams’ Volume Spread Analysis methodology (VSA). It works in any market and any time frame. The trader can use it as a standalone toolkit to support their trading decisions, or in conjunction with other trading tools to obtain additional confirmations.
The package consists of two parts:
TradeGuider VSA Lite indicator
TradeGuider Relative Volume indicator
The TradeGuider VSA Lite indicator provides information about the imbalance between supply and demand on the price charts via VSA principles. The VSA principles introduced in this indicator can be divided into two groups: Signs of Strength (SOS) and Signs of Weakness (SOW). The following six VSA principles are implemented:
SOSs: Potential Professional Buying (PB), Shakeout (SO), Test (TE)
SOWs: Potential Professional Selling (PS), Upthrust (UT), No Demand (ND)
VSA principles ARE NOT BUY and SELL SIGNALS on their own, but in combination may create VSA Setups to the long and short sides which are used in the VSA methodology to identify low-risk entries into, and optimal exits from, a trade.
A potential VSA Setup to the long side means that strength is presented on that particular chart at the current moment and the following conditions are present:
Potential Professional Buying (PB) is found in the background.
The price has risen above the high of the Potential Professional Buying (PB).
The price behavior has changed to the upside (the Short Term Trending Tool is changing color from red to gray or green).
The confirmation (a Test) is identified.
With a VSA Setup to the long side and strength on higher time frames, the price very often moves higher and the user may trade it.
A potential VSA Setup to the short side means that weakness is presented on that particular chart at the current moment and the following conditions are present:
Potential Professional Selling (PS) is found in the background.
The price has moved below the low of the Potential Professional Selling (PS).
The price behavior has changed to the downside (the Short Term Trending Tool is changing color from green to gray or red).
The confirmation (a No Demand) is identified.
With a VSA Setup to the short side and weakness on higher time frames, the price very often moves lower and the user may trade it.
The TradeGuider VSA Lite indicator is equipped with alerts which, when set, inform users of VSA Setups as they appear.
See the Author's instructions below to get access to this package and the accompanying documentation.
DISCLAIMER: The TradeGuider VSA Lite package is developed for educational purposes only. None of the content including the alerts should be considered as financial or investment advice. Investments are always made at your own risk and are based on your personal evaluations. We cannot be held responsible for any losses you may have. Please trade sensibly and carefully and only when you have a clear understanding of what is happening in the markets.

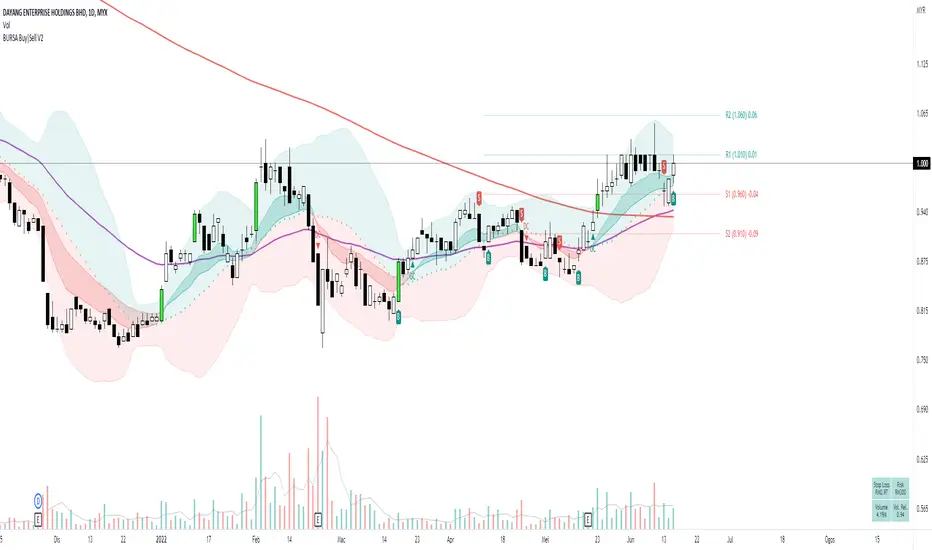
[HuD] BURSA Buy|Sell V1My main problem when I first started trading is to decide where is the best entry point and where should I sell it.
So using ATR and ema lines I build this indicator which I hope it can guide trader to make that decision.
This indicator contains :
I. Bollinger Band with standard-setting
- Green Zone indicates a positive trend, while red is negative trend
2. Moving average line ( I recommend using ema ) which are ema5,10,20, 50 and sma200
- ema10 and 20 are represented by green ribbon ( when its uptrend = ema10 is bigger value than ema20 ) and red ( when its downtrend)
- I'm also using ema7 and ema 21 as guides for the beginning of uptrend/downtrend. Represented by a green and red triangle
3. Default ATR setting is 10 with 1 multiplication
4. Buy Sell signal represented with labels B and S
- It acts as a guide on where to make the entry or exit. It acts as a guide and traders can decide to Entry at BUY signal and exit at SELL signal.
- Traders can also consider taking the BUY entry even after they miss the BUY signal if the price did not close lower than the opening price of BUY candle, which is 2 to 3 candles after the signal.
- SELL signal acts as a guide when it breaks the trailing stop line. Traders will have the option to exit the trade if they follow this signal or wait for another 1 or 2 candles.
5. Breakout Candle
- when the candle breaks the highest level of the previous 5 candles with volume > average 5 days, the candle's color will change to lime green.
6. Line High and Low ( need to turn on at setting menu )
- act as support and resistance guide
7. EMA Crossing
There is an option to display the Golden Cross (GC) and Death Cross (DC) of ema lines such as :
Golden Cross (GC) - Green Label
- EMA5 Crossover EMA20
- EMA20 Crossover EMA50
- EMA50 Crossover MA200
Death Cross (DC) - Red Label
- EMA5 Crossunder EMA20
- EMA20 Crossunder EMA50
- EMA50 Crossunder MA200
8. Table Info will display :
- Stop Loss Information
- Risk
- Current Volume
- Relative Volume. If relative volume > 1, means the current volume is higher than normal volume. For example, if RV = 5, meaning current trading volume is very active and it's 5 times higher than average volume.
This is only version 1 and will be upgraded from time to time. Hope this indicator can help traders in making wise decision in trading.
Volume Pressure AnalysisVolume Pressure Analysis is a new concept I have been working on designed to show the effort required to move price. An ideal tool for confirming trends or locating reversals early. This indicator can highlight whale action and market manipulation. It calculates volume vs volatility and displays the results as a meter:
Above 0 shows how easy price action is traveling, the bigger these bars the less volume and effort is required to push price. These are indicated with a teal or red arrows and can confirm the beginning or continuation of a trend. This is the natural direction the chart wants to travel at that time.
Below 0 shows how hard price is to move. The bigger these bars the more volume and effort is required to push price. When whales and market makers push price against its will these bars will get bigger.
Yellow arrows signal pressure in that direction and excessive amounts of volume is required to move price. These signals can lead to reversal/ pivot points as price action struggles to continue its trend. These signals can be turned on in settings or use the overlay version of this script to display signals on chart. This is a very powerful tool when used with relative volume.

Performante's Average Bitcoin Volume EMA Indicator This is the average Bitcoin volume with the data collected from the major retail exchanges + the exponential moving average (EMA) for the volume added on to better understand relative volume.
Thank you Julio!

Climatic Volume X- Climate volume detection
- Relative volume value in bar
- Automatic zone generation (possibility of configuration)
- Additional features
¡¡¡Thumbs up¡¡¡
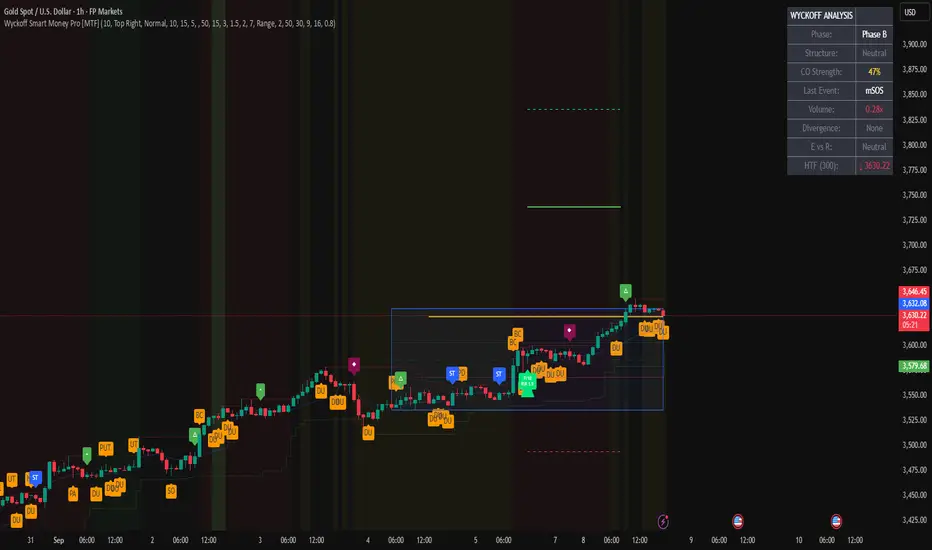
Wyckoff Smart Money Pro [MTF]Wyckoff Smart Money Pro detects trading ranges, phases, and events from the Wyckoff method and confirms them with VSA (Volume Spread Analysis), divergence checks, and a composite “smart money” strength index. It generates optional buy/sell signals only when multiple conditions align (phase, VSA, CO strength, effort vs. result, time/volume filters). The dashboard, POC/Value Area, and MTF backdrop help you manage context and risk in real time.
What this indicator does
Wyckoff Smart Money Pro is a multi-timeframe Wyckoff tool that:
⦁ Finds accumulation/distribution ranges and tracks Phases A–E.
⦁ Labels Wyckoff events (PS, SC, AR, ST, Spring/Test, SOS, LPS, UTAD, SOW, LPSY, TS…) and VSA patterns (No Demand/Supply, Stopping Volume, Upthrust, etc.).
⦁ Computes a Composite Operator (CO) Strength score from price/volume behavior to approximate “smart money” bias.
⦁ Adds divergence, effort vs. result, and a volume profile (POC & 70% value area) inside the detected range.
⦁ Provides buy/sell signals only when a configurable confluence is present (events + VSA + CO + EVR + phase + filters).
⦁ Supports MTF context (with a safe HTF resolver and fallbacks) and an Info Dashboard to summarize the current state.
It is designed to make the Wyckoff workflow visual and rules-based without promising results or automating decisions.
How it works (methods & calculations)
1) Range & Phase model
⦁ A sliding lookback searches for a valid range (recent highest high/lowest low), requiring width within 2–10× ATR(14) and a minimum bar count inside the bounds.
⦁ Once a range is active, the script derives Creek/Ice/Mid/Quartiles and classifies bars into Wyckoff Phases A–E using event recency (barssince) and where price sits relative to the range.
⦁ The background color reflects the current Phase; optional MTF events (from the chosen HTF) tint the background lightly for higher-timeframe context.
2) Wyckoff & VSA event engine
⦁ Events include PS, SC, AR, ST, Spring, Test, SOS, LPS, PSY, BC, UTAD, SOW, LPSY, TS, plus minor/multiple variants and Creek/Ice jumps.
⦁ VSA patterns detect No Demand/No Supply, Stopping Volume, Buying/Selling Climax, Upthrust/Pseudo Upthrust, Bag Holding, Shake-Out, Volume Dry-Up, etc., from spread vs. average spread and volume vs. average volume with tunable thresholds.
3) Smart-money (CO) Strength
⦁ CO Strength (0–100) blends: relative volume on up/down bars, professional accumulation/distribution, no-supply/no-demand, stopping volume, Springs/UTADs and Tests, SOS/SOW, price’s position inside the range, and volume-delta vs. its MA.
⦁ Persistent accumCount / distCount counters smooth temporary noise.
4) Divergence & Effort-vs-Result
⦁ Price vs. cum volume-delta divergence highlights weakening pushes.
⦁ EVR flags “High effort / no result” and potential Bullish/Bearish reversals, or “Low effort / high result” moves that are often unsustainable.
5) Volume Profile (inside range)
⦁ A 50-bin profile accumulates volume across the detected range to derive POC, VAH/VAL (70% value area). Lines update as the active range evolves.
6) Multi-Timeframe (MTF) safety
⦁ getHTF() converts your multiplier to a valid Pine timeframe string (e.g., 60, 240, 2D, 1W), and the script falls back to current timeframe values if an HTF request returns na.
⦁ If you enter a Custom HTF, it must be strictly higher than the chart’s timeframe (validated at runtime).
7) Signals & risk model
⦁ Signals are not tied to any single pattern. A buy may require Spring/Test/Shake-out/Creek Jump or SOS plus confirmation (VSA, CO>60, Phase C/D, divergence/EVR context).
⦁ Sell is symmetrical (UTAD/Failed Spring/SOW/Ice Jump + VSA + CO<40 + Phase C/D).
⦁ Minimum confidence is configurable; SL/TP and R:R lines are drawn from range edges or recent bar extremes.
⦁ Filters: trading hours, weekend avoidance, and a minimum volume threshold (relative to average) are available to suppress low-quality contexts.
⦁ Alerts include all major events, divergences, structure/phase changes, and the gated Buy/Sell signals (with a cooldown to reduce alert spam).
Inputs (key ones you’ll actually use)
⦁ Display Settings: toggle ranges, phases, events, VSA, signals, dashboard.
⦁ MTF: Enable HTF, set Multiplier or a Custom HTF (must be higher than current).
⦁ Range Detection: period / min bars / pivot strength.
⦁ VSA: volume sensitivity & climax multiplier.
⦁ Signal Settings: minimum confidence, risk/reward labels.
⦁ Advanced Filters: trading hours, weekend avoidance, and Min Volume Filter (× avg).
⦁ Colors: phase backgrounds, structure colors, and line styling.
How to use (practical flow)
1. Choose a symbol & timeframe you normally analyze (e.g., 5–60m for entries, 4H/D for context).
2. If using MTF, pick a multiplier (e.g., 5×) or a Custom HTF (e.g., 240/4H).
3. Wait for a range to form; watch Phase and CO Strength on the Dashboard.
4. When events (e.g., Spring/Test in Phase C or UTAD in distribution) appear with favorable VSA, CO, EVR, and volume/time filters, consider the signal and review R:R lines.
5. Use POC/VA and Creek/Ice/Mid as structure references; manage risk around the range edge that generated the setup.
On-chart legend (what the letters mean)
Wyckoff events (labels)
⦁ PS Preliminary Support, SC Selling Climax, AR Automatic Rally, ST Secondary Test
⦁ Spring Spring; Test Test of Spring
⦁ SOS Sign of Strength; LPS Last Point of Support
⦁ PSY Preliminary Supply, BC Buying Climax
⦁ UTAD Upthrust After Distribution; SOW Sign of Weakness; LPSY Last Point of Supply
⦁ TS Terminal Shakeout; MS Multiple Spring
⦁ CJ Creek Jump; IJ Ice Jump
⦁ mSOS / mSOW Minor Sign of Strength/Weakness
VSA patterns (tiny labels)
⦁ ND No Demand, NS No Supply, SV Stopping Volume, BC/SC Buying/Selling Climax
⦁ PA/PD Professional Accumulation/Distribution, BH Bag Holding, DU Volume Dry-Up
⦁ SO Shake-Out, TS Test for Supply (VSA test), UT Upthrust, PUT Pseudo Upthrust
Other visuals
⦁ Range box with Creek (upper third), Ice (lower third), Mid, Quartiles
⦁ POC/VAH/VAL: yellow solid (POC), purple dotted (value area)
⦁ VWAP and Dynamic S/R (stepline)
⦁ Green/Red triangles: gated Buy/Sell signals (only if min confidence & filters are met)
⦁ Risk label near the triangle: confidence /10 and R:R
Alerts included
⦁ Core events (Spring/Test/UTAD/SOS/SOW/TS), secondary events (SC/AR/BC/LPS/LPSY), VSA patterns, EVR states, Hidden Accumulation/Distribution, HTF events, Divergences, Phase/Structure changes, and the constrained Buy/Sell signals with a cooldown.
Notes, limits & best practices
⦁ This is not a buy/sell system; it’s a context & confirmation tool. Combine with your plan, risk limits, and execution criteria.
⦁ Long, illiquid, or news-driven bars can distort volume/spread logic; filters help but cannot eliminate this.
⦁ For MTF, if an exchange doesn’t support a specific HTF, the script falls back safely to current TF values to avoid na-propagation.
⦁ Dashboard rows/size/position are user-configurable to keep charts uncluttered.
Changelog (what’s new in this version)
⦁ MTF safety & validation (Custom HTF must be above current; graceful fallbacks for request.security() na results).
⦁ Performance caching for close position & up/down bar flags; drawing cleanup to stay under label/line limits.
⦁ Volume Profile upgraded to 50 bins; VA algorithm adjusted accordingly.
⦁ Signal gating with time/day/volume filters and alert cooldown to reduce noise.
⦁ Bug guards for parameter conflicts (e.g., rangeMinBars cannot exceed rangePeriod).
Disclaimer
This script is for educational and research purposes only and does not constitute financial advice or a recommendation to buy or sell any asset. Market risk is real; always test on a demo and trade at your own discretion.
FlowFusion Money Flow — FP + VWAP Drift + PVT (−100..+100)Title (ASCII only)
FlowFusion Money Flow — Flow Pressure + Rolling VWAP Drift + PVT (Normalized −100..+100)
Short Description
Original money-flow oscillator combining Flow Pressure, Rolling VWAP Drift, and PVT Momentum into one normalized score (−100..+100) with a signal line, thresholds, optional component plots, and ready-made alerts.
Full Description (meets “originality & usefulness”)
What’s original
FlowFusion Money Flow is not a generic mashup. It builds a single score from three complementary, volume-aware components that target different facets of order flow:
Flow Pressure (FP) — In-bar directional drive scaled by relative volume.
Drive
=
close
−
open
max
(
high
−
low
,
tick
)
∈
=
max(high−low, tick)
close−open
∈ .
Relative Volume
=
volume
average volume over
𝑓
𝑝
𝐿
𝑒
𝑛
=
average volume over fpLen
volume
.
𝐹
𝑃
𝑟
𝑎
𝑤
=
Drive
×
RelVol
FP
raw
=Drive×RelVol then squashed (softsign) to
.
Why it belongs: distinguishes real pushes (big body and big volume) from noise.
Rolling VWAP Drift — Direction of VWAP itself over a rolling window, normalized by ATR.
𝑉
𝑊
𝐴
𝑃
𝑡
=
∑
(
𝑇
𝑃
×
𝑉
𝑜
𝑙
)
∑
𝑉
𝑜
𝑙
VWAP
t
=
∑Vol
∑(TP×Vol)
over vwapLen.
Drift
=
𝑉
𝑊
𝐴
𝑃
𝑡
−
𝑉
𝑊
𝐴
𝑃
𝑡
−
1
𝐴
𝑇
𝑅
=
ATR
VWAP
t
−VWAP
t−1
→ squashed to
.
Why it belongs: persistent VWAP movement signals sustained accumulation/distribution.
PVT Momentum — Price-Volume Trend standardized (z-score) and squashed.
𝑃
𝑉
𝑇
𝑡
=
𝑃
𝑉
𝑇
𝑡
−
1
+
𝑉
𝑜
𝑙
×
Δ
𝐶
𝑙
𝑜
𝑠
𝑒
𝐶
𝑙
𝑜
𝑠
𝑒
𝑡
−
1
PVT
t
=PVT
t−1
+Vol×
Close
t−1
ΔClose
.
𝑧
=
𝑃
𝑉
𝑇
−
SMA
(
𝑃
𝑉
𝑇
)
StDev
(
𝑃
𝑉
𝑇
)
z=
StDev(PVT)
PVT−SMA(PVT)
→ squashed to
.
Why it belongs: captures volume-weighted trend pressure without relying on price alone.
Composite score:
Score
=
𝑤
𝐹
𝑃
⋅
𝐹
𝑃
+
𝑤
𝑉
𝑊
𝐴
𝑃
⋅
𝑉
𝑊
𝐴
𝑃
_
𝐷
𝑟
𝑖
𝑓
𝑡
+
𝑤
𝑃
𝑉
𝑇
⋅
𝑃
𝑉
𝑇
_
𝑀
𝑜
𝑚
𝑤
𝐹
𝑃
+
𝑤
𝑉
𝑊
𝐴
𝑃
+
𝑤
𝑃
𝑉
𝑇
Score=
w
FP
+w
VWAP
+w
PVT
w
FP
⋅FP+w
VWAP
⋅VWAP_Drift+w
PVT
⋅PVT_Mom
with a Signal = SMA(Score, sigLen). Thresholds mark strong accumulation/distribution zones.
How it works (step-by-step)
Compute FP, VWAP Drift, PVT Momentum.
Normalize each to the same
scale.
Weighted average → FlowFusion Score.
Smooth with a Signal line to reduce whipsaw.
Optional background shading when Score exceeds thresholds.
How to use
Direction filter:
Score > 0 favors longs; Score < 0 favors shorts.
Momentum turns:
Score crosses above Signal → setup for long; below → setup for short.
Strength zones:
Above Upper Threshold (default +40) = strong buy pressure; below Lower (−40) = strong sell pressure.
Confluence:
Best near S/R, trendlines, or HTF bias. For scalping on 1–5m, consider sigLen 9–13 and thresholds ±40 to ±50.
Alerts included: zero cross, zone entries, and Score/Signal crossovers.
Inputs (key)
fpLen (20): relative-volume lookback for Flow Pressure.
vwapLen (34): rolling VWAP window.
pvtLen (50): PVT z-score window.
sigLen (9): Signal smoothing.
Weights: wFP, wVWAP, wPVT to bias the blend.
Thresholds: upperBand / lowerBand (defaults +40/−40).
Display: toggle component plots and background shading.
Best practices
Trending markets: increase wVWAP (VWAP Drift) or widen thresholds.
Ranging markets: increase wFP and wPVT; take quicker profits.
News: wait for bar close confirmation or reduce size.
Data quality: use consistent volume feeds (especially in crypto).
Limitations
Oscillators can stay extreme in strong trends; use structure/trend filters.
Volume anomalies (illiquid pairs, API glitches) can distort signals—sanity-check with another venue when possible.
Disclaimer
This indicator is for educational purposes only and is not financial advice. Trading involves risk; past performance does not guarantee future results. Always paper-trade first and use appropriate risk controls.

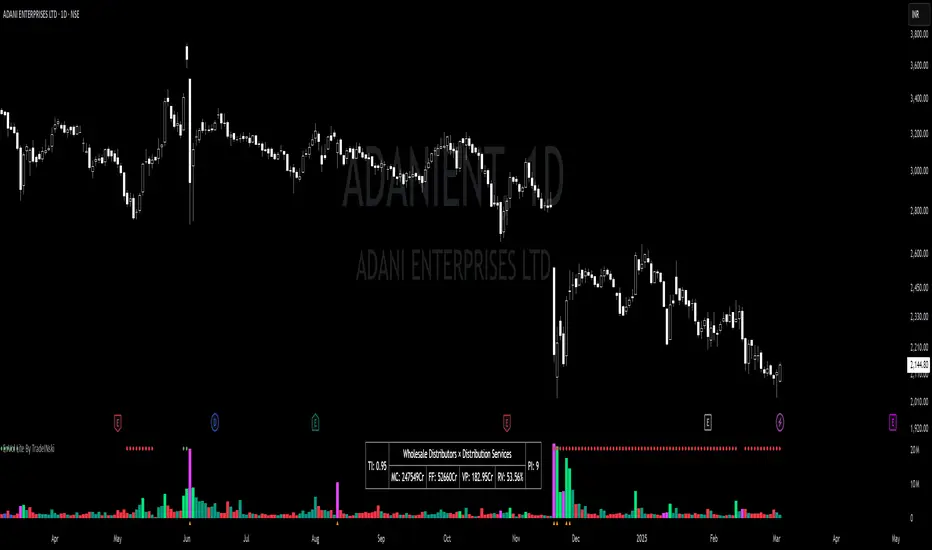
DTC AIO [India] v2.0DTC AIO v2.0 – Advanced Technical Analysis Suite
This indicator is a comprehensive dashboard designed specifically for Indian equities, providing traders with a unique blend of trend, volatility, volume, and earnings analytics—all in one panel.
Key Features
Multi-Timeframe Volatility Tables:
Instantly view daily, weekly, and monthly Average Daily Range (ADR) values in a compact, color-coded table.
Relative Volume (RVol) Panel:
Displays real-time relative volume in crores, helping you spot unusual activity at a glance.
Strength Gauge:
A proprietary scoring system that quantifies the frequency and magnitude of price bursts, giving you a unique “Strength” score for each symbol.
Earnings & Sales Table:
Automatically fetches and displays quarterly EPS and sales data, with YoY and QoQ growth, color-coded for clarity.
Theme-Aware Design:
All tables and overlays adapt to dark or light chart themes for maximum readability.
Customizable Watermark:
Add your own signature, timeframe, and price change watermark to the chart, with full control over position and color.
Sector & Industry Info:
Instantly see the symbol’s sector and industry in the main metrics table.
How It Works
Trend & Volatility:
Uses a blend of moving averages (user-selectable type and length) and price/volume patterns to highlight actionable setups.
Strength Gauge:
Calculates a proprietary score based on the frequency and size of price bursts over multiple lookback periods. This algorithm is unique to this script and not available in open-source alternatives.
Relative Volume:
Compares current volume to historical averages, displaying the result in crores for Indian market conventions.
Earnings Table:
Fetches the last four quarters of EPS and sales, automatically calculating and color-coding YoY and QoQ growth.
All tables and overlays are locked to price and update in real time.
How to Use
Add the indicator to your chart.
Customize table positions, watermark, and theme via the settings panel.
Use the dashboard to quickly assess trend, volatility, strength, and earnings for any Indian equity.
Hover over table cells for tooltips and additional information.
Why Closed Source?
This script is closed-source due to the proprietary nature of the “Strength Gauge” algorithm and the integrated dashboard logic, which are not available in open-source scripts. The unique scoring and visualization methods provide a competitive edge for users.
Notes
Designed for Indian equities, but can be used on any symbol.
All calculations are performed in real time and optimized for performance.
For best results, use on daily or higher timeframes.
If you have questions or feedback, please use the TradingView comments section.v

Impulse Volume Oscillator [Alpha Extract]Impulse Volume Oscillator
A sophisticated indicator designed to identify market impulse moves and volume-based momentum shifts, helping traders capture significant price movements with precision.
Combining price deviations with volume analysis, this oscillator dynamically measures market strength and weakness, providing clear signals for potential trend continuations and reversals.
🔶 Volume-Adjusted Normalization
Utilizes a unique normalization technique that incorporates volume impact to enhance signal quality. This approach ensures the indicator responds more strongly to high-volume price movements while filtering out low-volume noise.
vol_ratio = ta.rsi(volume, 14) / 50
vol_factor = vol_impact > 0 ? 1 + (vol_ratio - 1) * vol_impact : 1
raw_normalized = dev / (ta.stdev(source, bars) * mult)
vol_adjusted = raw_normalized * vol_factor
normalized = ta.sma(vol_adjusted, smooth)
🔶 Adaptive Regime Detection
Incorporates threshold-based regime identification that clearly distinguishes between trending and mean-reverting market conditions. The customizable threshold system allows traders to adapt to different market volatilities and timeframes.
🔶 Customizable Parameters
Fine-tune detection sensitivity with adjustable inputs for lookback period, standard deviation multiplier, volume impact, and signal smoothing. These parameters enable traders to optimize the indicator for various trading styles and market conditions.
❓How It Works
🔶 Impulse Calculation
The oscillator measures price deviation from a moving average baseline, normalized by standard deviation, and then adjusts the signal based on relative volume strength. This creates a responsive yet stable indicator that accurately reflects market momentum.
// Calculate the basis using the selected MA
basis = get_ma(source, bars)
// Calculate the normalized value with volume impact
dev = source - basis
🔶 Dynamic Visualization
The histogram changes color based on signal strength, providing instant visual cues about market conditions. Green bars indicate positive momentum while red bars represent negative momentum, with color intensity reflecting signal strength.
🔶 Trend Confirmation
Built-in trend direction analysis provides confluence with the primary signal, helping traders distinguish between counter-trend bounces and genuine trend reversals. This dual-confirmation approach significantly reduces false signals.
🔶 Visual Alerts & Boundary Tracking
Monitors signal extremes and dynamically adjusts visualization transparency based on signal strength. The indicator highlights particularly strong impulse moves with background shading, making potential trading opportunities immediately apparent.
🔶 Custom Candle Coloring
Optional candle coloring applies the same color logic as the histogram directly to price candles, providing a unified visual framework that helps traders correlate indicator signals with price action.
🔶 Momentum Shift Detection
Automatically identifies important zero-line crossovers that often signify the beginning of new impulse moves. These transition points frequently offer favorable risk/reward entry opportunities.
🔶 Snapshot samples
1 Week
1 Day
15 Min
🔶 Why Choose AE - Impulse Volume Oscillator?
This indicator provides a comprehensive approach to identifying significant market moves by combining volume analysis with price momentum. By offering clear visual signals for both trend continuation and reversal scenarios, it empowers traders to make more informed decisions across various market conditions and timeframes.

Hyperion Crypto Matrix: Ultimate Market Sentinel
// 🔰 HYPERION CRYPTO MATRIX: ULTIMATE MARKET SENTINEL
// ─────────────────────────────────────────────────────────────────────────────
/*
The **Hyperion Crypto Matrix** is an advanced crypto trend-following strategy built from the ground up for precision, not just performance. Unlike traditional “mashups” of indicators, this system was **engineered around synergy**—each module is purpose-driven and non-redundant, delivering fast, filtered, high-probability signals in volatile crypto markets.
─────────────────────────────────────────────────────────────
📌 STRATEGY PURPOSE
─────────────────────────────────────────────────────────────
Hyperion is built for **1-hour crypto trading** and optimizes for:
- High Win Rate
- Early Exits on Trend Weakness
- Partial Position Scaling (TP1/TP2)
- Real-time trade performance tracking
It is ideal for traders who want **real-time trade logic** with:
- No repainting
- No overfitting
- Realistic entry/exit structure
- No same-bar entry & exit (enforces 1-bar delay)
─────────────────────────────────────────────────────────────
🧠 WHAT MAKES IT ORIGINAL
─────────────────────────────────────────────────────────────
Each component is **custom-integrated** with strict role separation:
- **Trend Direction:** Enhanced Wave Oscillator (EWO) with adaptive band filtering
- **Trend Strength Memory:** Relative Momentum Index (RMI) with threshold locking
- **Volume Confirmation:** Historical relative volume spike filter using SMA multiplier
- **Momentum Weakness Exit:** Combined ROC and CCI to detect early reversal before price turns
- **Position Tracking:** TP1 (50% exit), TP2 (100% close) with cooldown to prevent whipsaws
- **Dynamic Dashboard:** Real-time stats including win rate, PnL efficiency, and TP hit status
These aren’t just “plugged in” indicators—they are synchronized to **filter, confirm, and adapt** to price action with timing logic that prevents premature entries or late exits.
─────────────────────────────────────────────────────────────
📊 INDICATOR LOGIC OVERVIEW
─────────────────────────────────────────────────────────────
1. **📈 Enhanced Wave Oscillator (EWO):**
- Calculates the delta between a fast and slow EMA (5 vs. 34 by default)
- Uses a dynamic banding system to detect peaks/troughs and prevent entries during exhaustion
- Filters only active, accelerating trends — reducing false positives
2. **🧠 Relative Momentum Index (RMI):**
- Similar to RSI but with a forward-looking momentum comparison
- Confirms trend *persistence* over time, preventing entries on short-term flips
- Long entries only allowed when RMI > threshold (default 55), short if RMI < 45
3. **🔊 Volume Spike Filter:**
- Uses 20-bar SMA of volume and a multiplier (1.5x default) to detect **relative volume breakouts**
- Prevents trades in low-liquidity environments (e.g., chop, overnight sessions)
4. **📉 Weak Trend Close Logic:**
- Combines Rate of Change (ROC) and Commodity Channel Index (CCI)
- Detects early signs of momentum deterioration, often before the trend visually reverses
- Triggers exit before price falls into sideways zones
5. **🎯 Take Profit System (TP1/TP2):**
- TP1: 50% position closed at +2% (default)
- TP2: Full close at +4% (default)
- Uses `strategy.exit()` with limit orders based on entry price
6. **⏱️ Reentry Cooldown:**
- After TP2 or weak trend exit, system enforces a 1-bar delay before reentry
- Avoids frequent churn in flat or noisy environments
7. **📋 Real-Time Dashboard (Optional):**
- Displays live trade status, PnL metrics, TP1/TP2 hit status, bars since entry, win rate %, and profit factor
- Color-coded background to highlight active trade direction (green for long, red for short)
─────────────────────────────────────────────────────────────
⚙️ HOW TO USE
─────────────────────────────────────────────────────────────
1. Load on a 1H chart of a crypto asset with good liquidity (e.g., BTC, ETH, LINK)
2. Toggle between \"Long Only\", \"Short Only\", or \"Both\" in the settings
3. Use default TP1/TP2 percentages, or tune them for the asset’s volatility
4. Observe trade execution and live stats on the optional dashboard
5. Review the bar coloring for EWO trend bias confirmation
> Stop-loss logic is not included. This strategy assumes exits occur at TP2 or on trend/momentum failure.
─────────────────────────────────────────────────────────────
⚖️ TRADINGVIEW COMPLIANCE & USAGE DISCLAIMER
─────────────────────────────────────────────────────────────
This strategy does **not repaint**, is fully compatible with **TradingView backtesting**, and adheres to all known Pine Script execution rules.
⚠️ **Disclaimer:** This script is for educational purposes only and does not constitute financial advice. Trading cryptocurrencies involves significant risk. Always test strategies on a demo account and consult with a financial advisor before live trading.
─────────────────────────────────────────────────────────────
🧪 CONCLUSION
─────────────────────────────────────────────────────────────
The **Hyperion Crypto Matrix** is not a mashup—it’s a **modular, optimized, logic-driven system** crafted for real-world crypto trading. Every component has been tuned for function, not fluff. Whether you're backtesting or live trading, this system is designed to give you **structured, actionable edge** with live feedback every step of the way.
*/

Smarter Money Concepts - OBs [PhenLabs]📊 Smarter Money Concepts - OBs
Version: PineScript™ v6
📌 Description
Smarter Money Concepts - OBs (Order Blocks) is an advanced technical analysis tool designed to identify and visualize institutional order zones on your charts. Order blocks represent significant areas of liquidity where smart money has entered positions before major moves. By tracking these zones, traders can anticipate potential reversals, continuations, and key reaction points in price action.
This indicator incorporates volume filtering technology to identify only the most significant order blocks, eliminating low-quality signals and focusing on areas where institutional participation is likely present. The combination of price structure analysis and volume confirmation provides traders with high-probability zones that may attract future price action for tests, rejections, or breakouts.
🚀 Points of Innovation
Volume-Filtered Block Detection : Identifies only order blocks formed with significant volume, focusing on areas with institutional participation
Advanced Break of Structure Logic : Uses sophisticated price action analysis to detect legitimate market structure breaks preceding order blocks
Dynamic Block Management : Intelligently tracks, extends, and removes order blocks based on price interaction and time-based expiration
Structure Recognition System : Employs technical analysis algorithms to find significant swing points for accurate order block identification
Dual Directional Tracking : Simultaneously monitors both bullish and bearish order blocks for comprehensive market structure analysis
🔧 Core Components
Order Block Detection : Identifies institutional entry zones by analyzing price action before significant breaks of structure, capturing where smart money has likely positioned before moves.
Volume Filtering Algorithm : Calculates relative volume compared to a moving average to qualify only order blocks formed with significant market participation, eliminating noise.
Structure Break Recognition : Uses price action analysis to detect legitimate breaks of market structure, ensuring order blocks are identified only at significant market turning points.
Dynamic Block Management : Continuously monitors price interaction with existing blocks, extending, maintaining, or removing them based on current market behavior.
🔥 Key Features
Volume-Based Filtering : Filter out insignificant blocks by requiring a minimum volume threshold, focusing only on zones with likely institutional activity
Visual Block Highlighting : Color-coded boxes clearly mark bullish and bearish order blocks with customizable appearance
Flexible Mitigation Options : Choose between “Wick” or “Close” methods for determining when a block has been tested or mitigated
Scan Range Adjustment : Customize how far back the indicator looks for structure points to adapt to different market conditions and timeframes
Break Source Selection : Configure which price component (close, open, high, low) is used to determine structure breaks for precise block identification
🎨 Visualization
Bullish Order Blocks : Blue-colored rectangles highlighting zones where bullish institutional orders were likely placed before upward moves, representing potential support areas.
Bearish Order Blocks : Red-colored rectangles highlighting zones where bearish institutional orders were likely placed before downward moves, representing potential resistance areas.
Block Extension : Order blocks extend to the right of the chart, providing clear visualization of these significant zones as price continues to develop.
📖 Usage Guidelines
Order Block Settings
Scan Range : Default: 25. Defines how many bars the indicator scans to determine significant structure points for order block identification.
Bull Break Price Source : Default: Close. Determines which price component is used to detect bullish breaks of structure.
Bear Break Price Source : Default: Close. Determines which price component is used to detect bearish breaks of structure.
Visual Settings
Bullish Blocks Color : Default: Blue with 85% transparency. Controls the appearance of bullish order blocks.
Bearish Blocks Color : Default: Red with 85% transparency. Controls the appearance of bearish order blocks.
General Options
Block Mitigation Method : Default: Wick, Options: Wick, Close. Determines how block mitigation is calculated - “Wick” uses high/low values while “Close” uses close values for more conservative mitigation criteria.
Remove Filled Blocks : Default: Disabled. When enabled, order blocks are removed once they’ve been mitigated by price action.
Volume Filter
Volume Filter Enabled : Default: Enabled. When activated, only shows order blocks formed with significant volume relative to recent average.
Volume SMA Period : Default: 15, Range: 1-50. Number of periods used to calculate the average volume baseline.
Min. Volume Ratio : Default: 1.5, Range: 0.5-10.0. Minimum volume ratio compared to average required to display an order block; higher values filter out more blocks.
✅ Best Use Cases
Identifying high-probability support and resistance zones for trade entries and exits
Finding optimal stop-loss placement behind significant order blocks
Detecting potential reversal areas where price may react after extended moves
Confirming breakout trades when price clears major order blocks
Building a comprehensive market structure map for medium to long-term trading decisions
Pinpointing areas where smart money may have positioned before major market moves
⚠️ Limitations
Most effective on higher timeframes (1H and above) where institutional activity is more clearly defined
Can generate multiple signals in choppy market conditions, requiring additional filtering
Volume filtering relies on accurate volume data, which may be less reliable for some securities
Recent market structure changes may invalidate older order blocks not yet automatically removed
Block identification is based on historical price action and may not predict future behavior with certainty
💡 What Makes This Unique
Volume Intelligence : Unlike basic order block indicators, this script incorporates volume analysis to identify only the most significant institutional zones, focusing on quality over quantity.
Structural Precision : Uses sophisticated break of structure algorithms to identify true market turning points, going beyond simple price pattern recognition.
Dynamic Block Management : Implements automatic block tracking, extension, and cleanup to maintain a clean and relevant chart display without manual intervention.
Institutional Focus : Designed specifically to highlight areas where smart money has likely positioned, helping retail traders align with institutional perspectives rather than retail noise.
🔬 How It Works
1. Structure Identification Process :
The indicator continuously scans price action to identify significant swing points and structure levels within the specified range, establishing a foundation for order block recognition.
2. Break Detection :
When price breaks an established structure level (crossing below a significant low for bearish breaks or above a significant high for bullish breaks), the indicator marks this as a potential zone for order block formation.
3. Volume Qualification :
For each potential order block, the algorithm calculates the relative volume compared to the configured period average. Only blocks formed with volume exceeding the minimum ratio threshold are displayed.
4. Block Creation and Management :
Valid order blocks are created, tracked, and managed as price continues to develop. Blocks extend to the right of the chart until they are either mitigated by price action or expire after the designated timeframe.
5. Continuous Monitoring :
The indicator constantly evaluates price interaction with existing blocks, determining when blocks have been tested, mitigated, or invalidated, and updates the visual representation accordingly.
💡 Note:
Order Blocks represent areas where institutional traders have likely established positions and may defend these zones during future price visits. For optimal results, use this indicator in conjunction with other confluent factors such as key support/resistance levels, trendlines, or additional confirmation indicators. The most reliable signals typically occur on higher timeframes where institutional activity is most prominent. Start with the default settings and adjust parameters gradually to match your specific trading instrument and style.

Bollinger Bands MTF & Kalman Filter | Flux Charts📈 Multi-Timeframe Kalman Filtered Bollinger Bands Indicator
Introducing our MTF Kalman Filtered Bollinger Bands – a powerful multi-timeframe Bollinger Bands (BB) indicator enhanced with Kalman filtering for superior smoothing and trend analysis. This indicator dynamically adapts Bollinger Bands across multiple timeframes while incorporating volume-based gradient transparency to highlight significant price movements. This indicator is better optimized for lower timeframes.
❓ How to Interpret the Bands & Volume Gradient:
Our indicator combines Lower Timeframe (LTF) and Higher Timeframe (HTF) Bollinger Bands to provide a comprehensive trend analysis. It applies Kalman filtering to the LTF bands, ensuring smoother, noise-reduced signals. The color gradient and relative volume-based transparency offer deeper insights into price strength.
🔹 LTF Bollinger Bands: Shorter-period bands filtered with a Kalman smoothing algorithm, reducing lag and noise.
🔹 HTF Bollinger Bands: Traditional Bollinger Bands plotted on a higher timeframe, offering macro trend analysis.
🔹 Volume Gradient Transparency: The bands adjust their opacity based on relative buy/sell volume, allowing traders to assess momentum strength.
📌 How Does It Work?
1️⃣ Multi-Timeframe Bollinger Bands Calculation
The LTF BB uses Kalman filtering for a smoother price representation, helping to reduce false signals.
The HTF BB is EMA-smoothed for improved trend clarity.
2️⃣ Adaptive Gradient Transparency
The opacity of the fill color between the bands is determined by relative buy/sell volume.
Higher buy volume = stronger bullish signal (greener bands).
Higher sell volume = stronger bearish signal (redder bands).
3️⃣ Dynamic Trend Signals & Breakouts
Buy Signal: When price breaks below the HTF lower band and LTF bands start rising.
Sell Signal: When price breaks above the HTF upper band and LTF bands start falling.
⚙️ Settings & Customization:
🛠 LTF and HTF Bollinger Bands Settings:
Multiplier: The multiplier applied to the BB to determine the upper and lower bands
Length: Define the number of bars determines the BB calculations.
Custom Timeframe Selection: Choose from predefined options (e.g., 5m, 15m, 1H, 4H, etc).
🎨 Gradient & Transparency Settings:
Bullish/Bearish Color Options: Customize colors for uptrend and downtrend conditions.
Max & Min Opacity: Adjust the transparency levels based on volume intensity.
Solid vs. Gradient Mode: Choose between a gradient fill or a solid color mode for clarity.
📌 Recommended Settings for Optimal Use:
1️⃣ Timeframe Selection (LTF -> HTF):
1 min -> 5 min
2 min -> 5 min
3 min -> 15 min
5 min -> 15 min
15 min -> 1 hr
1 hr -> 4 hr
4 hr -> 1 day
2️⃣ Multiplier: Use 2.0 for LTF and 2.25 for HTF
3️⃣Length: Use a length of 20 - 30 bars
🚀 Why Use This Indicator?
✅ Multi-Timeframe Bollinger Bands with Kalman Filtering – Ideal for traders looking for reduced lag and clearer trend signals.
✅ Volume-Based Transparency – See momentum shifts instantly with adaptive opacity.
✅ Dynamic Buy & Sell Signals – Alerts based on price action + volume trends.
✅ Customizable for Any Strategy – Adjust colors, timeframes, and filtering options for personalized trading.

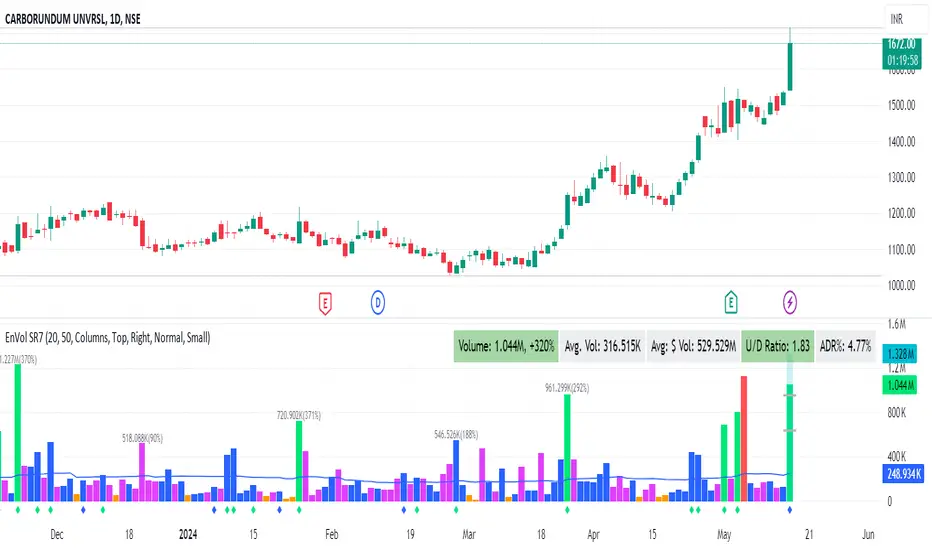
Enhanced Volume by SR7SiddharthaRay007's Enhanced Volume Indicator works on any Timeframe
⦿ Volume Labels:
1. Current Volume, Volume Change%, Average Volume, Average Doller Volume, Up/Down Ratio, ADR%.
=>Average value can be changed using 'Lookback Length' (Default: 20)
⦿ Simple Moving Average: MA (Default: 50). Color of MA changes based on the up down volume ratio.
1. Up/Down Ratio > 1: Blue
2. Up/Down Ratio < 1: Orange
⦿ Volume Bar Colors:
1. High Relative Volume Positive Candle: Lime Green .
2. High Relative Volume Negative Candle: Red .
3. Normal Volume Positive Candle: Blue .
4. Normal Volume Negative Candle: Fuchsia .
5. Low Relative Volume Positive/Negative Candle: Orange .
=>High Relative Volume > 300% of Average Volume; Low Relative Volume < 30% of Average Volume
⦿ Pocket Pivot (A pocket pivot is an up day with volume greater than any of the down days volume in the past 10 days)
1. 10 day Pocket Pivots: Lime Green Diamond below volume bar
2. 5 day Pocket Pivots: Blue Diamond below volume bar
⦿ 'Highest Volume (HV) ' on top of the Volume Bar:
1. Highest Volume Ever (HVE)
2. Highest Volume in Over a Year (HVY)
⦿ Projected Volume Bar: Aqua
⦿ Plot a line at 2x and 3x Average Volume and set Alerts
Liquidity Finder v2.0Description:
The Liquidity Finder v2.0 is a powerful technical indicator designed to identify divergence between volume and price movements in financial markets. Divergence occurs when there is a significant disparity between trading volume and price action, often signaling potential changes in market direction or trends.
This indicator calculates the relative volume and relative price change over a user-defined lookback period. Relative volume is determined by comparing the current volume to the average volume over the specified period, while relative price change compares the current price change to the average price change over the same period.
Key Features:
Customizable parameters allow users to adjust the lookback period, volume threshold, and price threshold to suit their trading preferences.
Divergence detection is visually represented by changing the color of price bars, making it easy for traders to identify potential trading opportunities.
Alerts can be set to notify traders when divergence is detected, enabling timely decision-making and trade execution.
The Volume-Price Divergence Detector is a valuable tool for traders and investors seeking to enhance their technical analysis toolkit. By spotting divergence between volume and price movements, traders can anticipate potential trend reversals or continuations, leading to more informed trading decisions and improved trading outcomes.

EnVol Lite By TradeINskiEnVol Lite By TradeINski
First things first,
This indicator is inspired by Enhanced Volume By TradeINski.
Best suited for momentum/ swing traders whose primary trade timeframe is Daily charts.
Suitable for for dark and light theme of trading view
Contents of the indicator.
1. Moving Average
2. Bar Colors
(a) Default Up & Down
(b) Relatively Up & Down
1. Moving Average
This is a simple moving average line plotted over a specific period of time frame. Default Value is 50 that means average number of shares that are volume traded over the last 50 days.
{Input}
Users have the option to change Period as per their requirement.
{Style}
Users have the option to change Show/Hide the line with "Check Mark".
Users can also change color, thickness and type of representation. "MA line".
2. Bar Colors
(a) Default Up & Down
- If on any specific day % change is positive then that day's volume bar is colored in teal. Hence default Up.
- If on any specific day %change is negative then that day's volume bar is colored in red. Hence Default Down.
- My interpretation for Default Up & Down day is its "Usual volume - usual activity"
(b)Relatively Up & Down
- To get a better understanding of relative Volume it's absolutely necessary to learn about ADR, which is Average daily range. This is coordinates with price not volume of the ticker.
Now ADR Calculation is based on High and low of the day that is average percentage change over a specified period of days. Here the period considered is 20 days.
- Now If on any specific day %change is positive that is up day, Specific day volume is 2 times the average volume and %change is 2 times the ADR then it is considered as relatively Up.
Similarly If on any specific day %change is negative that is down day, Specific day volume is 2 times the average volume and %change is 2 times the ADR then it is considered as relatively own.
- My interpretation for Relatively Up & Down day is its "unusual volume - unusual activity"
{Inputs}
- Users can change colors as per their preference. Default colors are for Default Up "Teal", Default Down "Red", Relatively Up "Lime" and for Relatively Down is "Fuchsia".
Volume Bars - Leviathan x Tradingriot This script is a collaboration with Tradingriot. It improves the regular volume indicator by coloring the bars based on different criteria to provide additional insights into market activity.
Coloring conditions are calculated using a combination of relative volume (current trading volume relative to past trading volume) and price movements (candle high-low range):
1. **High Volume**: This is represented by bars that exceed a user-defined relative volume (RVOL) or are the highest volume over a certain lookback period. They often signal a start or the end of a price move.
2. **Low Volume**: These are bars where volume is lower than a certain RVOL or is the lowest volume over a certain lookback period. Low Volume bars often act as weak spots that later get filled.
3. **Churn Bars**: Churn bars represent periods where there is a lot of volume, but little price movement. They often signal a start or the end of a price move.

Bar composition in 1minute | True candlestick colorThe indicator shows the true color of a bar based on the internal composition on 1 minute timeframe and the final outcome. It uses following parameters of 1minute and current timeframe inputs
relative bar close, average volume vs current volume and finally the volume of internal candles.
It follows following steps:
First, it defines the arrays of high, low, close, volume in one minute timeframe
Second, it identifies the negative and positive volume based on the bar closing at one minute timeframe
Third , it adds all the volume and find whether the overall volume is positive or negative for overall bar in higher timeframe (current timeframe)
Fourth, it compare the volume in current timeframe to average of volume in in current timeframe
Fifth, if relative closing, relative volume (current timeframe) and the combined volume (in 1 minute timeframe) gives same outcome then color of the bar is decided whether the bar is bullish, bearish or inconclusive/contnuation.
Through this you get to check price action in 1minute timeframe and the ultimate outcome in current timeframe. this helps in understanding whether the bar is truly bullish or bearish or continuation of the trend
Feel free to connect for any query.

Oscillator Workbench — Chart [LucF]█ OVERVIEW
This indicator uses an on-chart visual framework to help traders with the interpretation of any oscillator's behavior. The advantage of using this tool is that you do not need to know all the ins and outs of a particular oscillator such as RSI, CCI, Stochastic, etc. Your choice of oscillator and settings in this indicator will change its visuals, which allows you to evaluate different configurations in the context of how the workbench models oscillator behavior. My hope is that by using the workbench, you may come up with an oscillator selection and settings that produce visual cues you find useful in your trading.
The workbench works on any symbol and timeframe. It uses the same presentation engine as my Delta Volume Channels indicator; those already familiar with it will feel right at home here.
█ CONCEPTS
Oscillators
An oscillator is any signal that moves up and down a centerline. The centerline value is often zero or 50. Because the range of oscillator values is different than that of the symbol prices we look at on our charts, it is usually impossible to display an oscillator on the chart, so we typically put oscillators in a separate pane where they live in their own space. Each oscillator has its own profile and properties that dictate its behavior and interpretation. Oscillators can be bounded , meaning their values oscillate between fixed values such as 0 to 100 or +1 to -1, or unbounded when their maximum and minimum values are undefined.
Oscillator weight
How do you display an oscillator's value on a chart showing prices when both values are not on the same scale? The method I use here converts the oscillator's value into a percentage that is used to weigh a reference line. The weight of the oscillator is calculated by maintaining its highest and lowest value above and below its centerline since the beginning of the chart's history. The oscillator's relative position in either of those spaces is then converted to a percentage, yielding a positive or negative value depending on whether the oscillator is above or below its centerline. This method works equally well with bounded and unbounded oscillators.
Oscillator Channel
The oscillator channel is the space between two moving averages: the reference line and a weighted version of that line. The reference line is a moving average of a type, source and length which you select. The weighted line uses the same settings, but it averages the oscillator-weighted price source.
The weight applied to the source of the reference line can also include the relative size of the bar's volume in relation to previous bars. The effect of this is that the oscillator's weight on bars with higher total volume will carry greater weight than those with lesser volume.
The oscillator channel can be in one of four states, each having its corresponding color:
• Bull (teal): The weighted line is above the reference line.
• Strong bull (lime): The bull condition is fulfilled and the bar's close is above the reference line and both the reference and the weighted lines are rising.
• Bear (maroon): The weighted line is below the reference line.
• Strong bear (pink): The bear condition is fulfilled and the bar's close is below the reference line and both the reference and the weighted lines are falling.
Divergences
In the context of this indicator, a divergence is any bar where the slope of the reference line does not match that of the weighted line. No directional bias is assigned to divergences when they occur. You can also choose to define divergences as differences in polarity between the oscillator's slope and the polarity of close-to-close values. This indicator's divergences are designed to identify transition levels. They have no polarity; their bullish/bearish bias is determined by the behavior of price relative to the divergence channel after the divergence channel is built.
Divergence Channel
The divergence channel is the space between two levels (by default, the bar's low and high ) saved when divergences occur. When price has breached a channel and a new divergence occurs, a new channel is created. Until that new channel is breached, bars where additional divergences occur will expand the channel's levels if the bar's price points are outside the channel.
Price breaches of the divergence channel will change its state. Divergence channels can be in one of five different states:
• Bull (teal): Price has breached the channel to the upside.
• Strong bull (lime): The bull condition is fulfilled and the oscillator channel is in the strong bull state.
• Bear (maroon): Price has breached the channel to the downside.
• Strong bear (pink): The bear condition is fulfilled and the oscillator channel is in the strong bear state.
• Neutral (gray): The channel has not been breached.
█ HOW TO USE THE INDICATOR
Load the indicator on an active chart (see here if you don't know how).
The default configuration displays:
• The Divergence channel's levels.
• Bar colors using the state of the oscillator channel.
The default settings use:
• RSI as the oscillator, using the close source and a length of 20 bars.
• An Arnaud-Legoux moving average on the close and a length of 20 bars as the reference line.
• The weighted version of the reference line uses only the oscillator's weight, i.e., without the relative volume's weight.
The weighted line is capped to three standard deviations of the reference.
• The divergence channel's levels are determined using the high and low of the bars where divergences occur.
Breaches of the channel require a bar's low to move above the top of the channel, and the bar's high to move below the channel's bottom.
No markers appear on the chart; if you want to create alerts from this script, you will need first to define the conditions that will trigger the markers, then create the alert, which will trigger on those same conditions.
To learn more about how to use this indicator, you must understand the concepts it uses and the information it displays, which requires reading this description. There are no videos to explain it.
█ FEATURES
The script's inputs are divided in five sections: "Oscillator", "Oscillator channel", "Divergence channel", "Bar Coloring" and "Marker/Alert Conditions".
Oscillator
This is where you configure the oscillator you want to study. Thirty oscillators are available to choose from, but you can also use an oscillator from another indicator that is on your chart, if you want. When you select an external indicator's plot as the oscillator, you must also specify the value of its centerline.
Oscillator Channel
Here, you control the visibility and colors of the reference line, its weighted version, and the oscillator channel between them.
You also specify what type of moving average you want to use as a reference line, its source and its length. This acts as the oscillator channel's baseline. The weighted line is also a moving average of the same type and length as the reference line, except that it will be calculated from the weighted version of the source used in the reference line. By default, the weighted line is capped to three standard deviations of the reference line. You can change that value, and also elect to cap using a multiple of ATR instead. The cap provides a mechanism to control how far the weighted line swings from the reference line. This section is also where you can enable the relative volume component of the weight.
Divergence Channel
This is where you control the appearance of the divergence channel and the key price values used in determining the channel's levels and breaching conditions. These choices have an impact on the behavior of the channel. More generous level prices like the default low and high selection will produce more conservative channels, as will the default choice for breach prices.
In this section, you can also enable a mode where an attempt is made to estimate the channel's bias before price breaches the channel. When it is enabled, successive increases/decreases of the channel's top and bottom levels are counted as new divergences occur. When one count is greater than the other, a bull/bear bias is inferred from it. You can also change the detection mode of divergences, and choose to display a mark above or below bars where divergences occur.
Bar Coloring
You specify here:
• The method used to color chart bars, if you choose to do so.
• If you want to hollow out the bodies of bars where volume has not increased since the last bar.
Marker/Alert Conditions
Here, you specify the conditions that will trigger up or down markers. The trigger conditions can include a combination of state transitions of the oscillator and the divergence channels. The triggering conditions can be filtered using a variety of conditions.
Configuring the marker conditions is necessary before creating an alert from this script, as the alert will use the marker conditions to trigger.
Realtime values will repaint, as is usually the case with oscillators, but markers only appear on bar closes, so they will not repaint. Keep in mind, when looking at markers on historical bars, that they are positioned on the bar when it closes — NOT when it opens.
Raw values
The raw values calculated by this script can be inspected using the Data Window, including the oscillator's value and the weights.
█ INTERPRETATION
Except when mentioned otherwise, this section's charts use the indicator's default settings, with different visual components turned on or off.
The aim of the oscillator channel is to provide a visual representation of an oscillator's general behavior. The simplest characteristic of the channel is its bull/bear state, determined by whether the weighted line is above or below the reference line. One can then distinguish between its bull and strong bull states, as transitions from strong bull to bull states will generally happen when trends are losing steam. While one should not infer a reversal from such transitions, they can be a good place to tighten stops. Only time will tell if a reversal will occur. One or more divergences will often occur before reversals. This shows the oscillator channel, with the reference line and the thicker, weighted line:
The nature of the divergence channel 's design makes it particularly adept at identifying consolidation areas if its settings are kept on the conservative side. The divergence channel will also reveal transition areas. A gray divergence channel should usually be considered a no-trade zone. More adventurous traders can use the oscillator channel to orient their trade entries if they accept the risk of trading in a neutral divergence channel, which by definition will not have been breached by price. This show only the divergence channels:
This chart shows divergence channels and their levels, and colors bars on divergences and on the state of the oscillator channel, which is not visible on the chart:
If your charts are already busy with other stuff you want to hold on to, you could consider using only the chart bar coloring component of this indicator. Here we only color bars using the combined state of the oscillator and divergence channel, and we do not color the bodies of bars where volume has not increased. Note that my chart's settings do not color the candle bodies:
At its simplest, one way to use this indicator would be to look for overlaps of the strong bull/bear colors in both the oscillator channel and a divergence channel, as these identify points where price is breaching the divergence channel when the oscillator's state is consistent with the direction of the breach.
Tip
One way to use the Workbench is to combine it with my Delta Volume Channels indicator. If both indicators use the same MA as a reference line, you can display its delta volume channel instead of the oscillator channel.
This chart shows such a setup. The Workbench displays its divergence levels, the weighted reference line using the default RSI oscillator, and colors bars on divergences. The DV Channels indicator only displays its delta volume channel, which uses the same MA as the workbench for its baseline. This way you can ascertain the volume delta situation in contrast with the visuals of the Workbench:
█ LIMITATIONS
• For some of the oscillators, assumptions are made concerning their different parameters when they are more complex than just a source and length.
See the `oscCalc()` function in this indicator's code for all the details, and ask me in a comment if you can't find the information you need.
• When an oscillator using volume is selected and no volume information is available for the chart's symbol, an error will occur.
• The method I use to convert an oscillator's value into a percentage is fragile in the early history of datasets
because of the nascent expression of the oscillator's range during those early bars.
█ NOTES
Working with this workbench
This indicator is called a workbench for a reason; it is designed for traders interested in exploring its behavior with different oscillators and settings, in the hope they can come up with a setup that suits their trading methodology. I cannot tell you which setup is the best because its setup should be compatible with your trading methodology, which may require faster or slower transitions, thus different configurations of the settings affecting the calculations of the divergence channels.
For Pine Script™ Coders
• This script uses the new overload of the fill() function which now makes it possible to do vertical gradients in Pine. I use it for both channels displayed by this script.
• I use the new arguments for plot() 's `display` parameter to control where the script plots some of its values,
namely those I only want to appear in the script's status line and in the Data Window.
• I used my ta library for some of the oscillator calculations and helper functions.
• I also used TradingView's ta library for other oscillator calculations.
• I wrote my script using the revised recommendations in the Style Guide from the Pine v5 User Manual.
