CryptoScalper: NightMODE by BiO-618Hey guys!
It's me with a new version of the script.
Since a lot of people wanted to use it for scalping, I adjusted it for that.
More buy signals, more sell signals, 90% accuracy (at least ;) )
Remember to use the pivots to set Take Profits and Stop Losses, no software is 100% accurate, otherwise the market would trash it.
SELL SIGNALS
Red "S": Sell signal
Yellow "Sell": Strong+ sell signal
Orange "SELL": Strong++ sell signal. Shortable signal.
Red triangledown "SELL!": Strongest+++ sell signal, bearish divergences from MACD . Shortable signal.
BUY SIGNALS
Yellow triangleup "Weakening": Bear trend is getting weak, as the asset is getting oversold.
Green "BUY!": Strong buy, bullish divergence from MACD . Strongest buy signal.
Remember, again, to ALWAYS set your TP and SL beforehand. The key to be profitable is to act before the market acts.
It's better 3% in hand than 1% below your initial balance.
From a manual backtesting, I got a 53% profit on 2 weeks, trust my advice to manage the risk and you will be profitable aswell ;)
Check my other scripts to get more options :)
I also made a 4Hours and 12Hours optimized scripts, you might found that which one works better for your strategy, asset, and timeframe.
Search in scripts for "scalping"

Dany_ema_Scalping_4dany_ema_Scalping_4
A very powerful tool for the trader who performs scalping of 5m, was tested in 500 operations, of which 455 were successful.
consists of making entries to the market in combination of the signal "B" and the blue bars, this is applying price action, cu enta with supports and dynamic resistances, the volume of the RSI price is based on the volume.
The best way to operate in 5m time, and checking the supports and making purchases when you have the B sign and the blue bars.
practice it and see its power.
Torres Dany

Spacer - SRThis script spaces prices between charts while scalping
They can be used as potential support and resistance
Prices are spaced with odd numbers only 1,3,5,7,9
Enjoy the script

PeBAS €$ Scalper 5m ALERT VersionHere is the EurDollar ScalpingScript for Alerts.
Have fun and the sun in your heart!

Gold M5 Scalping (Strategy)This is the New Strategy for my new Indicator for M5 Scalping.
Just to test my result.
Will release my indicator soon
Ghost Scalp Protocol By [@Ash_TheTrader]
# 👻 GHOST SCALP PROTOCOL
### 💀 Stop Getting Trapped. Start Tracking the Banks.
Most retail traders lose because they enter exactly where institutions are exiting. They get caught in **"Stop Hunts"** and **"Fake-Outs."**
The **Ghost Scalp Protocol** is not just an indicator; it is a complete institutional trading system designed for **M1 & M5 Scalpers**. It combines **Smart Money Concepts (SMC)** with a **Physics-Based Momentum Engine ($p=mv$)** to detect high-probability reversals.
---
### ⚛️ THE LOGIC: 3-STAGE CONFIRMATION
This algorithm does not rely on lagging indicators. It uses a 3-step "Protocol" to validate every trade:
**1. THE GHOST TRAP (Liquidity Sweeps)**
* The script automatically draws "Ghost Lines" at key Swing Highs/Lows where retail Stop Losses are hiding.
* It waits for price to **sweep** these levels (Stop Hunt).
* **The Signal:** A Neon **Skull (☠️)** appears *only* if price aggressively rejects the level with high volume. This is the "Turtle Soup" pattern.
**2. THE PHYSICS ENGINE ($p = mv$)**
* Momentum is not just price speed; it is **Mass (Volume) x Velocity (Range)**.
* The dashboard calculates the "Force" of every candle.
* **The Signal:** An **Arrow (⬆/⬇)** appears when momentum surges **5x** above the average. This confirms the banks are pushing the move.
**3. BANK BIAS (Elasticity Filter)**
* Markets move like a rubber band.
* The script calculates a hidden "Fair Value" baseline.
* It creates a **Bias**: It only looks for Shorts in **PREMIUM (Shorting)** zones and Longs in **DISCOUNT (Accumulating)** zones.
---
### 📊 THE SMART DASHBOARD (HUD)
A futuristic, non-intrusive Heads-Up Display keeps you focused on the data that matters:
* **🏦 BANK BIAS:** Tells you if Institutions are likely **Accumulating** or **Shorting**.
* **📈 HTF TREND:** Automatically checks the **1-Hour Trend**. Don't fight the tide.
* **🚀 MOMENTUM:** Real-time Physics calculation.
* **Green Text:** Acceleration (Move is getting stronger).
* **Red Text:** Deceleration (Move is dying).
* **🌍 SESSION:** Shows active Bank Sessions (Tokyo, London, NY).
* **⚠️ OVERLAP ALERT:** Flashes GOLD when London & New York are open simultaneously (Peak Volatility).
---
### 🔥 STRATEGY: HOW TO TRADE
Use this checklist to execute high-probability scalps:
#### 📉 SHORT SETUP (SELL)
1. **Liquidity:** Wait for price to break above a **Red Ghost Line** (Sweep Highs).
2. **Signal:** Wait for the **Pink Skull ☠️** (Trap Detected).
3. **Confluence:**
* Dashboard Bias says: **"SHORTING"**
* HTF Trend says: **"BEARISH 📉"** (Optional but recommended).
4. **Entry:** On the Close of the Skull candle.
5. **Stop Loss:** Just above the wick swing high.
#### 📈 LONG SETUP (BUY)
1. **Liquidity:** Wait for price to break below a **Blue Ghost Line** (Sweep Lows).
2. **Signal:** Wait for the **Blue Skull ☠️** (Trap Detected).
3. **Confluence:**
* Dashboard Bias says: **"ACCUMULATING"**
* HTF Trend says: **"BULLISH 📈"** (Optional but recommended).
4. **Entry:** On the Close of the Skull candle.
5. **Stop Loss:** Just below the wick swing low.
---
### 🏆 RECOMMENDED PAIRS & TIMEFRAMES
* **⚡ Best Timeframes:**
* **1 Minute (M1):** For aggressive "Sniper" entries (High Frequency).
* **5 Minute (M5):** The "Gold Standard" for balanced Scalping.
* **15 Minute (M15):** Safer, higher win-rate Day Trading.
* **💎 Best Assets:**
* **Gold (XAUUSD):** Highly effective on liquidity sweeps.
* **Indices:** US100 (Nasdaq), US30 (Dow Jones).
* **Crypto:** BTCUSD, ETHUSD (High volatility).
* **Forex:** GBPUSD, EURUSD (London/NY Session).
---
### 🛠️ SETTINGS & CUSTOMIZATION
* **Surge Factor:** Default is **5.0x**. Lower this to 3.0 if you want more aggressive Momentum Arrows.
* **Smart Sessions:** Automatically converts to **New York Time** (EST) regardless of your location. No more time zone math.
* **Visuals:** Designed with "Ghost Glow" technology—97% transparent backgrounds that look classy and don't clutter your chart.
---
**"The Ghost Algo sees what you can't."**
*Trade Safe. Trade Smart.*
**~ Ash_TheTrader**

GB · Set upUp & Confirmation (Lower Pane)The GB Set-Up & Confirmation Indicator transforms raw momentum into a clear, color-coded decision framework for intraday scalping.
It’s the heartbeat monitor of 0DTE trading — revealing when momentum quietly shifts and when it explodes into confirmation.
Milliseconds Ahead: Confirm-on-Prior mode mimics predictive confirmation, letting traders catch reversals before the lag candle.
Noise-Adaptive: Near-zero band filtering reduces false breaks from micro volatility.
Visual Precision: Dual markers and labeled confirmations remove hesitation in execution.
Configurable Latency: Sensitivity presets + fine-tune ensure adaptability from SPX 1-min charts to QQQ 5-min momentum waves.
Platform: Designed for lower-pane deployment beneath the main price chart.
Primary Use: Time-sensitive momentum confirmation for 0DTE SPX/SPY/QQQ scalps.
Typical Workflow:
Wait for Early (Set-Up) triangle near the zero band → signals momentum shift.
Enter on the Confirmed triangle (or one candle prior if using “Confirm on Prior”).
Exit when opposite signal fires or wave color fades (momentum exhaustion).
Complementary Indicators: Pairs seamlessly with GB TMA Overlay, GB ORB Shading, or Phoenix Fire Confluence for full-stack entry validation.
Adaptive Sensitivity Presets
- Aggressive: reacts early to momentum pulses (scalp mode).
- Balanced: optimized for intraday consistency.
- Strict: waits for full trend maturity (swing mode).

Options Scalping Banknifty ContributionThis Indicator is Owned by Team Option Scalping.
This Indicator tell us about the contribution of constituents in BANKNIFTY
BANKNIFTY is an index in National Stock Exchange (NSE) which holds banking stocks.
More than 15 stocks contribute in Banknifty Index in different % ( Based on there valuation )
We took top 12 Stocks and there contribution points in table.
We can see Banknifty points at the Top and stocks contribution below that.
And if you sum it up all stocks contribution then it will be equal to Banknifty points.
This keeps on changing on real time. And rows automatically sorts based on Constituents points
Like if SBIN is contributing the most for BANKNIFTY then it will be at top
And If any other stock is contribution the least ( in negative ) then it will be at the bottom of the table.
Color coding is Algo give , if green then stocks has contributed on positive points
If red then stock has contributed on negative points
Indicator has input of placing the table on different position on screen
Other than that no input parameters are there.
List of stocks and there contribution are controlled by us only.

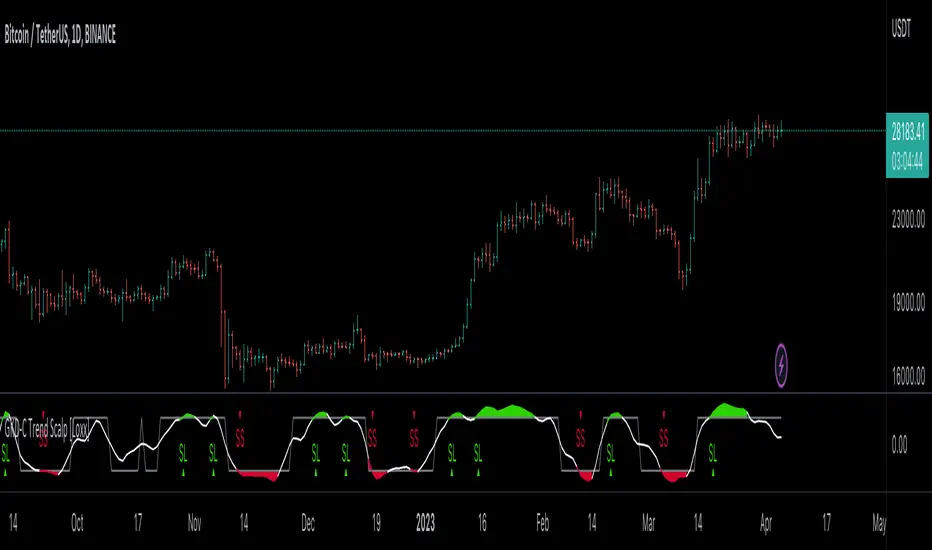
GKD-C Trend Scalp [Loxx]Giga Kaleidoscope GKD-C Trend Scalp is a Confirmation module included in Loxx's "Giga Kaleidoscope Modularized Trading System".
█ Giga Kaleidoscope Modularized Trading System
What is Loxx's "Giga Kaleidoscope Modularized Trading System"?
The Giga Kaleidoscope Modularized Trading System is a trading system built on the philosophy of the NNFX (No Nonsense Forex) algorithmic trading.
What is the NNFX algorithmic trading strategy?
The NNFX (No-Nonsense Forex) trading system is a comprehensive approach to Forex trading that is designed to simplify the process and remove the confusion and complexity that often surrounds trading. The system was developed by a Forex trader who goes by the pseudonym "VP" and has gained a significant following in the Forex community.
The NNFX trading system is based on a set of rules and guidelines that help traders make objective and informed decisions. These rules cover all aspects of trading, including market analysis, trade entry, stop loss placement, and trade management.
Here are the main components of the NNFX trading system:
1. Trading Philosophy: The NNFX trading system is based on the idea that successful trading requires a comprehensive understanding of the market, objective analysis, and strict risk management. The system aims to remove subjective elements from trading and focuses on objective rules and guidelines.
2. Technical Analysis: The NNFX trading system relies heavily on technical analysis and uses a range of indicators to identify high-probability trading opportunities. The system uses a combination of trend-following and mean-reverting strategies to identify trades.
3. Market Structure: The NNFX trading system emphasizes the importance of understanding the market structure, including price action, support and resistance levels, and market cycles. The system uses a range of tools to identify the market structure, including trend lines, channels, and moving averages.
4. Trade Entry: The NNFX trading system has strict rules for trade entry. The system uses a combination of technical indicators to identify high-probability trades, and traders must meet specific criteria to enter a trade.
5. Stop Loss Placement: The NNFX trading system places a significant emphasis on risk management and requires traders to place a stop loss order on every trade. The system uses a combination of technical analysis and market structure to determine the appropriate stop loss level.
6. Trade Management: The NNFX trading system has specific rules for managing open trades. The system aims to minimize risk and maximize profit by using a combination of trailing stops, take profit levels, and position sizing.
Overall, the NNFX trading system is designed to be a straightforward and easy-to-follow approach to Forex trading that can be applied by traders of all skill levels.
Core components of an NNFX algorithmic trading strategy
The NNFX algorithm is built on the principles of trend, momentum, and volatility. There are six core components in the NNFX trading algorithm:
1. Volatility - price volatility; e.g., Average True Range, True Range Double, Close-to-Close, etc.
2. Baseline - a moving average to identify price trend
3. Confirmation 1 - a technical indicator used to identify trends
4. Confirmation 2 - a technical indicator used to identify trends
5. Continuation - a technical indicator used to identify trends
6. Volatility/Volume - a technical indicator used to identify volatility/volume breakouts/breakdown
7. Exit - a technical indicator used to determine when a trend is exhausted
What is Volatility in the NNFX trading system?
In the NNFX (No Nonsense Forex) trading system, ATR (Average True Range) is typically used to measure the volatility of an asset. It is used as a part of the system to help determine the appropriate stop loss and take profit levels for a trade. ATR is calculated by taking the average of the true range values over a specified period.
True range is calculated as the maximum of the following values:
-Current high minus the current low
-Absolute value of the current high minus the previous close
-Absolute value of the current low minus the previous close
ATR is a dynamic indicator that changes with changes in volatility. As volatility increases, the value of ATR increases, and as volatility decreases, the value of ATR decreases. By using ATR in NNFX system, traders can adjust their stop loss and take profit levels according to the volatility of the asset being traded. This helps to ensure that the trade is given enough room to move, while also minimizing potential losses.
Other types of volatility include True Range Double (TRD), Close-to-Close, and Garman-Klass
What is a Baseline indicator?
The baseline is essentially a moving average, and is used to determine the overall direction of the market.
The baseline in the NNFX system is used to filter out trades that are not in line with the long-term trend of the market. The baseline is plotted on the chart along with other indicators, such as the Moving Average (MA), the Relative Strength Index (RSI), and the Average True Range (ATR).
Trades are only taken when the price is in the same direction as the baseline. For example, if the baseline is sloping upwards, only long trades are taken, and if the baseline is sloping downwards, only short trades are taken. This approach helps to ensure that trades are in line with the overall trend of the market, and reduces the risk of entering trades that are likely to fail.
By using a baseline in the NNFX system, traders can have a clear reference point for determining the overall trend of the market, and can make more informed trading decisions. The baseline helps to filter out noise and false signals, and ensures that trades are taken in the direction of the long-term trend.
What is a Confirmation indicator?
Confirmation indicators are technical indicators that are used to confirm the signals generated by primary indicators. Primary indicators are the core indicators used in the NNFX system, such as the Average True Range (ATR), the Moving Average (MA), and the Relative Strength Index (RSI).
The purpose of the confirmation indicators is to reduce false signals and improve the accuracy of the trading system. They are designed to confirm the signals generated by the primary indicators by providing additional information about the strength and direction of the trend.
Some examples of confirmation indicators that may be used in the NNFX system include the Bollinger Bands, the MACD (Moving Average Convergence Divergence), and the MACD Oscillator. These indicators can provide information about the volatility, momentum, and trend strength of the market, and can be used to confirm the signals generated by the primary indicators.
In the NNFX system, confirmation indicators are used in combination with primary indicators and other filters to create a trading system that is robust and reliable. By using multiple indicators to confirm trading signals, the system aims to reduce the risk of false signals and improve the overall profitability of the trades.
What is a Continuation indicator?
In the NNFX (No Nonsense Forex) trading system, a continuation indicator is a technical indicator that is used to confirm a current trend and predict that the trend is likely to continue in the same direction. A continuation indicator is typically used in conjunction with other indicators in the system, such as a baseline indicator, to provide a comprehensive trading strategy.
What is a Volatility/Volume indicator?
Volume indicators, such as the On Balance Volume (OBV), the Chaikin Money Flow (CMF), or the Volume Price Trend (VPT), are used to measure the amount of buying and selling activity in a market. They are based on the trading volume of the market, and can provide information about the strength of the trend. In the NNFX system, volume indicators are used to confirm trading signals generated by the Moving Average and the Relative Strength Index. Volatility indicators include Average Direction Index, Waddah Attar, and Volatility Ratio. In the NNFX trading system, volatility is a proxy for volume and vice versa.
By using volume indicators as confirmation tools, the NNFX trading system aims to reduce the risk of false signals and improve the overall profitability of trades. These indicators can provide additional information about the market that is not captured by the primary indicators, and can help traders to make more informed trading decisions. In addition, volume indicators can be used to identify potential changes in market trends and to confirm the strength of price movements.
What is an Exit indicator?
The exit indicator is used in conjunction with other indicators in the system, such as the Moving Average (MA), the Relative Strength Index (RSI), and the Average True Range (ATR), to provide a comprehensive trading strategy.
The exit indicator in the NNFX system can be any technical indicator that is deemed effective at identifying optimal exit points. Examples of exit indicators that are commonly used include the Parabolic SAR, the Average Directional Index (ADX), and the Chandelier Exit.
The purpose of the exit indicator is to identify when a trend is likely to reverse or when the market conditions have changed, signaling the need to exit a trade. By using an exit indicator, traders can manage their risk and prevent significant losses.
In the NNFX system, the exit indicator is used in conjunction with a stop loss and a take profit order to maximize profits and minimize losses. The stop loss order is used to limit the amount of loss that can be incurred if the trade goes against the trader, while the take profit order is used to lock in profits when the trade is moving in the trader's favor.
Overall, the use of an exit indicator in the NNFX trading system is an important component of a comprehensive trading strategy. It allows traders to manage their risk effectively and improve the profitability of their trades by exiting at the right time.
How does Loxx's GKD (Giga Kaleidoscope Modularized Trading System) implement the NNFX algorithm outlined above?
Loxx's GKD v1.0 system has five types of modules (indicators/strategies). These modules are:
1. GKD-BT - Backtesting module (Volatility, Number 1 in the NNFX algorithm)
2. GKD-B - Baseline module (Baseline and Volatility/Volume, Numbers 1 and 2 in the NNFX algorithm)
3. GKD-C - Confirmation 1/2 and Continuation module (Confirmation 1/2 and Continuation, Numbers 3, 4, and 5 in the NNFX algorithm)
4. GKD-V - Volatility/Volume module (Confirmation 1/2, Number 6 in the NNFX algorithm)
5. GKD-E - Exit module (Exit, Number 7 in the NNFX algorithm)
(additional module types will added in future releases)
Each module interacts with every module by passing data between modules. Data is passed between each module as described below:
GKD-B => GKD-V => GKD-C(1) => GKD-C(2) => GKD-C(Continuation) => GKD-E => GKD-BT
That is, the Baseline indicator passes its data to Volatility/Volume. The Volatility/Volume indicator passes its values to the Confirmation 1 indicator. The Confirmation 1 indicator passes its values to the Confirmation 2 indicator. The Confirmation 2 indicator passes its values to the Continuation indicator. The Continuation indicator passes its values to the Exit indicator, and finally, the Exit indicator passes its values to the Backtest strategy.
This chaining of indicators requires that each module conform to Loxx's GKD protocol, therefore allowing for the testing of every possible combination of technical indicators that make up the six components of the NNFX algorithm.
What does the application of the GKD trading system look like?
Example trading system:
Backtest: Strategy with 1-3 take profits, trailing stop loss, multiple types of PnL volatility, and 2 backtesting styles
Baseline: Hull Moving Average
Volatility/Volume: Hurst Exponent
Confirmation 1: Trend Scalp as shown on the chart above
Confirmation 2: Williams Percent Range
Continuation: Fisher Transform
Exit: Rex Oscillator
Each GKD indicator is denoted with a module identifier of either: GKD-BT, GKD-B, GKD-C, GKD-V, or GKD-E. This allows traders to understand to which module each indicator belongs and where each indicator fits into the GKD protocol chain.
Giga Kaleidoscope Modularized Trading System Signals (based on the NNFX algorithm)
Standard Entry
1. GKD-C Confirmation 1 Signal
2. GKD-B Baseline agrees
3. Price is within a range of 0.2x Volatility and 1.0x Volatility of the Goldie Locks Mean
4. GKD-C Confirmation 2 agrees
5. GKD-V Volatility/Volume agrees
Baseline Entry
1. GKD-B Baseline signal
2. GKD-C Confirmation 1 agrees
3. Price is within a range of 0.2x Volatility and 1.0x Volatility of the Goldie Locks Mean
4. GKD-C Confirmation 2 agrees
5. GKD-V Volatility/Volume agrees
6. GKD-C Confirmation 1 signal was less than 7 candles prior
Continuation Entry
1. Standard Entry, Baseline Entry, or Pullback; entry triggered previously
2. GKD-B Baseline hasn't crossed since entry signal trigger
3. GKD-C Confirmation Continuation Indicator signals
4. GKD-C Confirmation 1 agrees
5. GKD-B Baseline agrees
6. GKD-C Confirmation 2 agrees
1-Candle Rule Standard Entry
1. GKD-C Confirmation 1 signal
2. GKD-B Baseline agrees
3. Price is within a range of 0.2x Volatility and 1.0x Volatility of the Goldie Locks Mean
Next Candle:
1. Price retraced (Long: close < close or Short: close > close )
2. GKD-B Baseline agrees
3. GKD-C Confirmation 1 agrees
4. GKD-C Confirmation 2 agrees
5. GKD-V Volatility/Volume agrees
1-Candle Rule Baseline Entry
1. GKD-B Baseline signal
2. GKD-C Confirmation 1 agrees
3. Price is within a range of 0.2x Volatility and 1.0x Volatility of the Goldie Locks Mean
4. GKD-C Confirmation 1 signal was less than 7 candles prior
Next Candle:
1. Price retraced (Long: close < close or Short: close > close )
2. GKD-B Baseline agrees
3. GKD-C Confirmation 1 agrees
4. GKD-C Confirmation 2 agrees
5. GKD-V Volatility/Volume Agrees
PullBack Entry
1. GKD-B Baseline signal
2. GKD-C Confirmation 1 agrees
3. Price is beyond 1.0x Volatility of Baseline
Next Candle:
1. Price is within a range of 0.2x Volatility and 1.0x Volatility of the Goldie Locks Mean
3. GKD-C Confirmation 1 agrees
4. GKD-C Confirmation 2 agrees
5. GKD-V Volatility/Volume Agrees
█ GKD-C Trend Scalp
What is T3?
The T3 Moving Average (T3MA) is a technical analysis indicator that was developed by Tim Tillson. It is a trend-following indicator that aims to provide a smoother and more accurate representation of price trends than other moving average indicators.
The T3MA is a type of exponential moving average ( EMA ) that is calculated using a series of complex formulas. Unlike a simple or exponential moving average , which use fixed smoothing factors, the T3MA uses a variable smoothing factor that is based on the volatility of the underlying asset. This means that the T3MA is able to adapt to changing market conditions and provide more accurate signals.
The formula for calculating the T3MA is as follows:
T3 = a * EMA1 + (1 - a) * T3
Where:
-T3 is the current value of the T3MA
-EMA1 is the current value of the first EMA
-T3 is the previous value of the T3MA
-a is the smoothing factor, which is based on the volatility of the underlying asset and is calculated using the following formulas:
-c1 = -1 + exp (-sqrt(2) * pi / period)
-c2 = 2 * c1 * c1 + 2 * c1
-c3 = 1 - c1 - c2
-a = c1 * sqrt(period) * (close - T3) + c2 * T3 + c3 * EMA1
In simple terms, the T3MA is calculated by taking a weighted average of two different EMAs, with the weight given to each EMA depending on the volatility of the asset being analyzed. The T3MA is then smoothed using a second smoothing factor, which further reduces noise and improves the accuracy of the indicator.
The T3MA can be used in a variety of ways by traders and analysts. Some common applications include using the T3MA as a trend-following indicator, with buy signals generated when the price of an asset crosses above the T3MA and sell signals generated when the price crosses below. The T3MA can also be used in combination with other indicators and analytical techniques to confirm trading decisions and identify potential trend reversals.
Overall, the T3 Moving Average is a highly sophisticated and complex technical indicator that is designed to provide a more accurate and reliable representation of price trends. While it may be difficult for novice traders to understand and use effectively, experienced traders and analysts may find the T3MA to be a valuable tool in their trading toolbox.
What is Trend Scalp?
Trend Scalp calculates the difference between bull and bear power and then smooths this calculation using the T3 filter. This indicator is good for lower timeframe scalping. For use in regular trading, decrease the levels value, for scalps, keep the levels value high.
Requirements
Inputs
Confirmation 1 and Solo Confirmation: GKD-V Volatility / Volume indicator
Confirmation 2: GKD-C Confirmation indicator
Outputs
Confirmation 2 and Solo Confirmation Complex: GKD-E Exit indicator
Confirmation 1: GKD-C Confirmation indicator
Continuation: GKD-E Exit indicator
Solo Confirmation Simple: GKD-BT Backtest strategy
Additional features will be added in future releases.
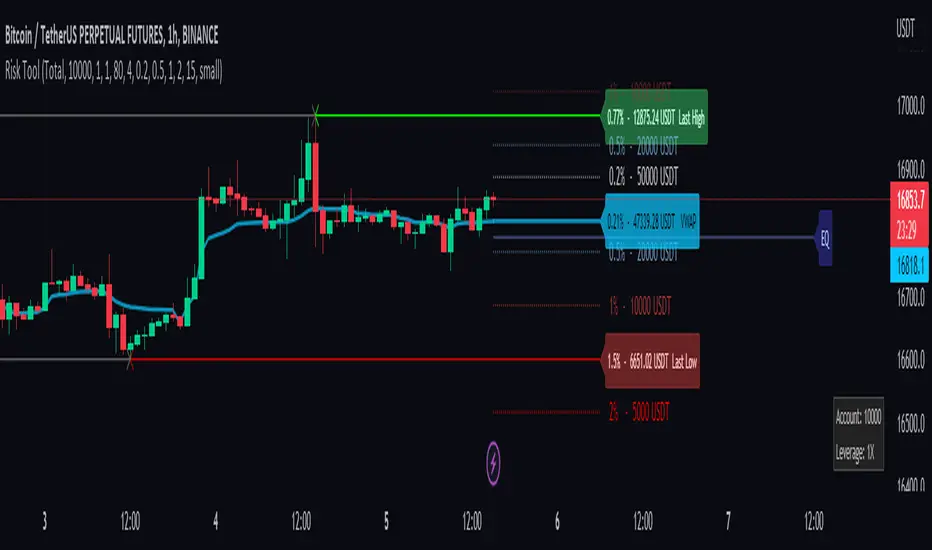
Risk Management ToolThis tool is a good way to get quick position sizing. No need to use your calculator and find that your price asset is already out of your range.
It works best with Cryptocurrencies Exchange way to manage position size calculation.
Really useful when scalping. This tool tracks the last high and low following your custom lookback bars number. It also follows the VWAP level.
You also have 4 custom ranges around the current price with the calculated position size. You set the desired percentage distance from the current price and you get the position size you need.
1. You choose the type of order
2. Account balance
3. Leverage if you use the cost base orders type
4. Amount to risk
and you get real-time risk management.
RF+ Replay for Heikin AshiRF+ Replay for Heikin Ashi
RF+ Replay for Heikin Ashi generates fully customisable Heikin Ashi candlesticks presented on a standard chart, enabling traders to utilise the Tradingview Replay feature with Heikin Ashi candlesticks when analysing and backtesting HA style strategies.
The features of this indicator include:
- Fully customisable Heikin Ashi Candles, including custom colour options for candle bodies, borders and wicks.
- Optional real-time, real-price close dots painted onto each candlestick.
- A optional set of 2 x Range Filters designed to indicate short term trend identification upon color change, ideal for low timeframe scalping.
- A optional set of 3 x fully customisable Moving Averages.
- An option to enable Heikin Ashi calculated data for the Range Filters and Moving Averages, so they present as they would on a Heikin Ashi non-standard chart type, without having to use an actual Heikin Ashi chart. Enabled by default.
- An optional sessions indicator, to highlight your prefered trading session for the purpose of backtesting.
- An optional watermark featuring customisable text and well as symbol and timeframe information, as seen in the screenshot of this indicator.
Instructions for use:
1) Because this indicator generates candlesticks and presents them onto your chart, you will need to hide the existing candlesticks so you do not see two sets of candles. You can do this by going into your Tradingview chart settings and making the candle bodies, borders and wicks fully transparent. You can then save this as a layout template. You can access your Chart Settings by clicking on the cog icon, or by right clicking on the chart itself and selecting 'Chart Settings' from the list.
2) Ensure you have the standard chart type selected - you do not need to select a Heikin Ashi type chart.
3) You will now be able to analyise and even backtest your Heikin Ashi style strategies including the use of the Tradingview Replay feature found at the top of the chart.
Heikin Ashi means 'average bar' in Japanese, which speaks to the fact that Heikin Ashi candles are calculated differently to standard Japanese candlesticks. The general idea of Heikin Ashi candles is to 'smooth' the appearance of price movement, by the use of averages within their calculation. It is important to understand that the Open and Close values of a Heikin Ashi candlestick do not reflect real Open and Close prices. You can use the real price dots feature to clearly see the real time and real price Close of each candle.
The formula for calculating a Heikin Ashi candlestick is as follows:
High = Maximum of High, Open, or Close (whichever is highest)
Low = Minimum of Low, Open, or Close (whichever is lowest)
Open = Open (previous bar) + Close (previous bar) /2
Close = (Open + High + Low + Close) / 4
If you found this useful, be sure to leave a like, comment and subscribe to show your support.
Until next time.

Heikin ashi candlestick patterns for scalping by lalocoutinoThis indicator will show you when a heikin ashi candlestick pattern forms based on volume.
It contains different candlestick patterns to be able to use it in scalping.
Each pattern has a specific name to identify it
It is recommended to use it in 1 minute charts.

candlestick patterns for scalping by lalocoutinoThis indicator will show you when a volume-based candlestick pattern forms.
It contains different candlestick patterns to be able to use it in scalping.
Each pattern has a specific name to identify it
It is recommended to use it in 1 minute charts.

MACD ULTRA with ALERTS - by OVARIDE WORK IN PROGRESS!
Coded by OVARIDE (littlegreenfish)
Made to be used with Dark Theme. Made to be used with Heikin Ashi bars (You can enable Real Price from chart settings). Test and use at your own risk. Not recommended for NEW/ INEXPERIENCED TRADERS using this for short-timeframe scalping. Bot integration is possible for high timeframes using the built-in alerts as a trigger via webhooks
Features
This is a reworked MACD code with added buffs for traders wanting more information from this basic indicator.
What this indicator does -
1. Plots a traditional MACD indicator with full input control from within the settings. All colors and values are editable , as you would expect from the standalone indicator.
2. Adds shape to the chart when MACD crosses over Signal line, while both MACD and Signal lines are below the ZERO line.
3. Adds shape to the chart when MACD crosses over ZERO line.
4. Highlights trend direction. Purple = Up Trend Likely , Yellow = Up Trend may end (use caution) , Red = Strong Down Trend Begins.
5. Ability to set alerts for -
a) When MACD crosses Signal Line.
b) When MACD crosses Zero line.
c) When an Up Trend is likely to begin.
d) When an Up Trend is slowing and may end.
e) When a Strong Down Trend begins.
Considerations -
1. Traders may use this indicator in conjunction with an existing strategy to confirm entries and exits. Traders may also use this indicator as a standalone indicator to assist with entries and exits.
2. Possible Long entries -
a) When MACD crosses Signal line while blow the Zero Line
b) When MACD crosses Zero
c) When Up Trend is Likely to begin and the background is highlighted in purple.
3. Possible stop-loss / exits (Omitted MACD crossing below Signal line and MACD crossing below Zero line)
a) When Up Trend Is slowing and the background is highlighted Yellow
b) When a Strong Down trend begins and the background is highlighted in Red. All open long position trades should be ended here.
4. The trend algorithm is hard-coded. Changing the MACD and Signal values from within the settings WILL NOT change the result of when and how the trend directions are highlighted.
5. Trend highlights are ONLY A GUIDE . You can still take entry positions in non-highlighted, yellow or red regions if your overall technical analysis tells you to.
UPDATE NOTES (IF ANY) WILL BE PUBLISHED BELOW

3C Crossover with TTP & TSLThis is not a set and forget strategy. It needs constant tweaking to maintain a high winrate. Also what works on one pair can be horrible on another.
This strategy works best on the 1 min or 5 min TF but also works well on the 15 min. Haven't done any testing in higher TF's as im only interested in scalping.
If enabled you can retrive data for the filters on any TF.
The strategy do not repaint.
You do not need a 3c subscription to run this strategy as the bot turns on and off the bot itself.
Instructions for the 3commas connector:
1. First, you need to prepare 3commas Long/Short bots that will only listen to custom TV signals.
2. Inputs for the 3commas bot can be found at the end of the user inputs.
3. Once you have entered the required details into the inputs, turn on 3commas comments. They should appear on the chart (looks messy).
4. Now you can add the alert where you should paste the 3commas Webhook URL: 3commas.io
5. For the alert message text insert the placeholder {{strategy.order.comment}} and delete the rest. 6. Once the alert is saved, you can turn off those 3commas comments to have a clearer chart.
7. With a new alert, the bot and trade should launch.
Long or Short trades are determined with a crossing of the fast MA over the slow MA for Long and the opposite for Short. By checking Close position on MA cross the deal will close on a crossover/under of the 2 MA's
You can select from various different MA's and of course lenghts. You can add both EMA filter on any lenght aswell as ATR to determine to go long or short.
Using the MA gap can help you to not enter trades in a low volatile ranging market.
The RSI filter, sets the maximum RSI threshold for a long position and the minimum for a short. By default and what i recomend is that you enter Longs when RSI is above 50 and shorts when RSI are below 50.
-You can set confirmation of the trade direction with RSI , i.e. for Long the RSI must rise a specified number of bars back, vice versa for Short.
Enabling the pullback filter is great to avoid Longing tops and Shorting bottoms.
Stop loss can be set be either a fixed percentage or by using ATR
Take profit can be set by using percentage, ATR or RiskReward ratio(RR). if you use ATR as a stoploss i recomend using RR as the TP.
Yu can choose to trail the TP with either Percentage or ATR
Whats ahead. I really want to incorporate RSI divergencies, but haven't figured out how yet. Any other ideas would be greatly appreciated.
Have a look at my other strategies. They are similar to this but works abit differently.

3C MACD & RSI Scalper no repaintThis is not a set and forget strategy. It needs constant tweaking to maintain a high winrate. Also what works on one pair can be horrible on another.
This strategy works best on the 1 min or 5 min TF but also works well on the 15 min. Haven't done any testing in higher TF's as im only interested in scalping.
If enabled you can retrive data on the MACD and RSI from any timeframe.
The strategy do not repaint.
You can filter on sessions as well as days. Often trading during say only the EU times and not trading during weekends yields better results. This is because weekeds and eg. the Asia Sessions are alot less volatile.
You do not need a 3c subscription to run this strategy as the bot turns on and off the bot itself.
Instructions for the 3commas connector:
1. First, you need to prepare 3commas Long/Short bots that will only listen to custom TV signals.
2. Inputs for the 3commas bot can be found at the end of the user inputs.
3. Once you have entered the required details into the inputs, turn on 3commas comments. They should appear on the chart (looks messy).
4. Now you can add the alert where you should paste the 3commas Webhook URL: 3commas.io
5. For the alert message text insert the placeholder {{strategy.order.comment}} and delete the rest. 6. Once the alert is saved, you can turn off those 3commas comments to have a clearer chart.
7. With a new alert, the bot and trade should launch.
Long or Short trades are determined with a crossing of the fast MA over the slow MA for Long and the opposite for Short. Trades should only happen close to the crossovers.
You can select from various different MA's and of course lenghts. I often find that using HEMA as the fast MA and DEMA as the slow give more trades while also maintaining a high winrate.
Then for Long we use the MACD indicator where we look for high peaks in negative values for Long and vice versa for Shorts. These should be significantly higher than other peaks (or if you will lower peaks for a Long).
The key is to detect high peaks on the histogram, which we will try to achieve by checking if the last 2 values were higher than X bars back. If you want to make it even more specific, then you can turn on the additional checkbox which compares the current value to the average value of X bars back, and if it is greater than, say, 72% the value of the average then it's ok to enter the trade.
The RSI filter, sets the maximum RSI threshold for a long position and the minimum for a short. By default and what i recomend is that you enter Longs when RSI is above 50 and shorts when RSI are below 50.
-You can set confirmation of the trade direction with RSI, i.e. for Long the RSI must rise a specified number of bars back, vice versa for Short.
Enabling the pullback filter is great to avoid Longing tops and Shorting bottoms.
Whats ahead. I really want to incorporate RSI divergencies, but haven't figured out how yet. Any other ideas would be greatly appreciated.
Have a look at my other strategies. They are similar to this but works abit differently.
The 3 strike line and the engulfing candles are not something that has an impact on the script yet, and might never be. But i do like to turn them on for a visual to see if the trade the strategy opened is a good one.

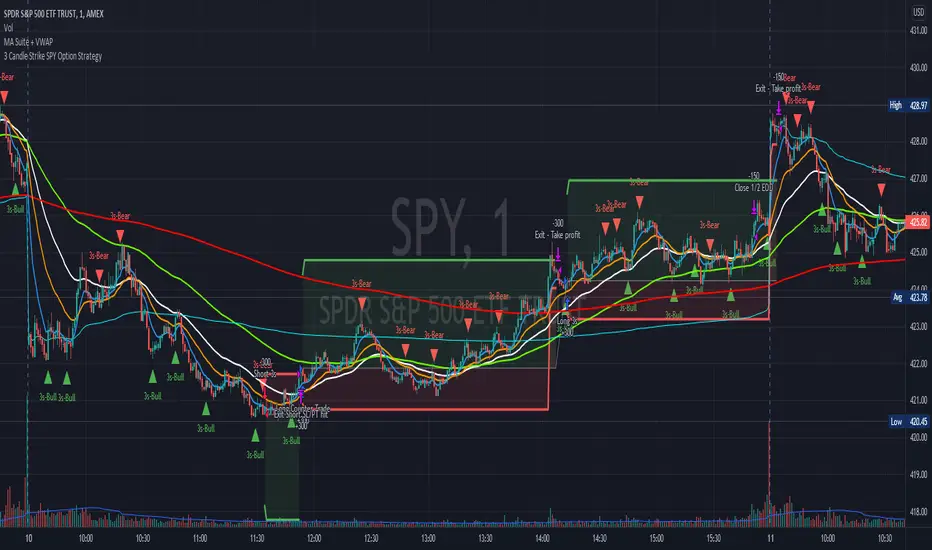
3 Candle Strike SPY Option StrategyImportant notes:
1. This strategy is designed for same day SPY option scalping. All profit shown in back testing report is based on Profit/Loss (P/L) estimates from trading options with approximately 7.5 weeks of data. By default, it is set to 10 option contracts. By default the initial capital is set to $5000.
2. This strategy also takes into account of extended market data, so turn it on for it to work as intended.
3. This strategy is mainly developed for SPY trading on 1 min chart, it probably will not work with other tickers without tweaking all the parameters first.
4. At the time of publish, the market is experiencing high volatility. Keep that in mind as market conditions changes constantly.
How it works:
Basic idea of this strategy is to look for 3 candle reversal pattern within trending market structure. The 3 candle reversal pattern consist of 3 consecutive bullish or bearish candles, followed by an engulfing candle in the opposite direction. This pattern usually signals a reversal of short term trend (a.k.a pullbacks). This strategy uses multiple moving averages to filter long or short entries. For example, if the 21 smoothed moving average is above the 50, only look for long (bullish) entries, and vise versa. There are settings to change these moving average periods to suit your needs. Linear Regression to determine whether the market is trending. The 3 candle pattern is more successful under trending market.
This strategy aims for approximately 1:3 risk to reward ratio. Stop losses are calculated using the closest low or high values for long or short entries, respectively, with an offset using a percentage of the daily ATR value. This allows some price fluctuation without being stopped out prematurely. Price target is calculated by multiplying the difference between the entry price and the stop loss by a factor of 3. When price target is reach, this strategy will set stop loss at the price target and wait for exit conditions to maximize potential profit.
By default, the strategy signals a trade in the opposite direction if the previous one had resulted in a loss. Often times, this opposite trade results in profit.
This strategy automatically signal to close all trades at 3:50 pm EST at the end of the day.
Enjoy~!!! Let's all make $$$
3 Candle Strike StretegyMainly developed for AMEX:SPY trading on 1 min chart. But feel free to try on other tickers.
Basic idea of this strategy is to look for 3 candle reversal pattern within trending market structure. The 3 candle reversal pattern consist of 3 consecutive bullish or bearish candles,
followed by an engulfing candle in the opposite direction. This pattern usually signals a reversal of short term trend. This strategy also uses multiple moving averages to filter long or short
entries. ie. if the 21 smoothed moving average is above the 50, only look for long (bullish) entries, and vise versa. There is option change these moving average periods to suit your needs.
I also choose to use Linear Regression to determine whether the market is ranging or trending. It seems the 3 candle pattern is more successful under trending market. Hence I use it as a filter.
There is also an option to combine this strategy with moving average crossovers. The idea is to look for 3 candle pattern right after a fast moving average crosses over a slow moving average.
By default , 21 and 50 smoothed moving averages are used. This gives additional entry opportunities and also provides better results.
This strategy aims for 1:3 risk to reward ratio. Stop losses are calculated using the closest low or high values for long or short entries, respectively, with an offset using a percentage of
the daily ATR value. This allows some price fluctuation without being stopped out prematurely. Price target is calculated by multiplying the difference between the entry price and the stop loss
by a factor of 3. When price target is reach, this strategy will set stop loss at the price target and wait for exit condition to maximize potential profit.
This strategy will exit an order if an opposing 3 candle pattern is detected, this could happen before stop loss or price target is reached, and may also happen after price target is reached.
*Note that this strategy is designed for same day SPY option scalping. I haven't determined an easy way to calculate the # of contracts to represent the equivalent option values. Plus the option
prices varies greatly depending on which strike and expiry that may suits your trading style. Therefore, please be mindful of the net profit shown. By default, each entry is approximately equal
to buying 10 of same day or 1 day expiry call or puts at strike $1 - $2 OTM. This strategy will close all open trades at 3:45pm EST on Mon, Wed, and Fri.
**Note that this strategy also takes into account of extended market data.
***Note pyramiding is set to 2 by default, so it allows for multiple entries on the way towards price target.
Remember that market conditions are always changing. This strategy was only able to be back-tested using 1 month of data. This strategy may not work the next month. Please keep that in mind.
Also, I take no credit for any of the indicators used as part of this strategy.
Enjoy~

TrendLineScalping-BasicDear Traders,
Here is the thought which came to my mind on the trendline break scalping. sometimes during the trade we do plot trendlines and we do anticipate for the line to break and take a trade. with the same thing in mind I had created this basic script to help you and other to create based on the logic used in the script.
This is just a logic based script and doesn't do any kind of wonders. Hence you may use it as necessary.
Regards....

Scalp - 50/200 EMAWorks on any timeframe but was built originally for scalping. Uses 50EMA and 200EMA to define the trend and touch backs on to the 50 EMA for entry.
200 EMA - White Line
50 EMA - Yellow Line
ATR: Length 14 Smoothing RMA
1. Wait for 50ema to crossover 200 ema – Then wait for candle to touch 50 ema after the cross.
2. Entry: Green candle that closes above 50 ema without getting more than 3 candles closing below(BUY) or above (SELL) 50ema.
3. Stop loss: 2x ATR value below entry candle.
4. Take profit: 1.5x the risk.
Settings allow for # of Entries allowed per trend as well as EMA periods.
Opposite for Sell Entries (Stop Loss: 2x ATR value above entry candle)
Eliza Ellis Improved FractalsA little side project of mine. may enhance further in the future. Used best for scalping. The longer you're in the market the more the news is waiting to eat you so I'd recommend using high volume and getting in and out quickly

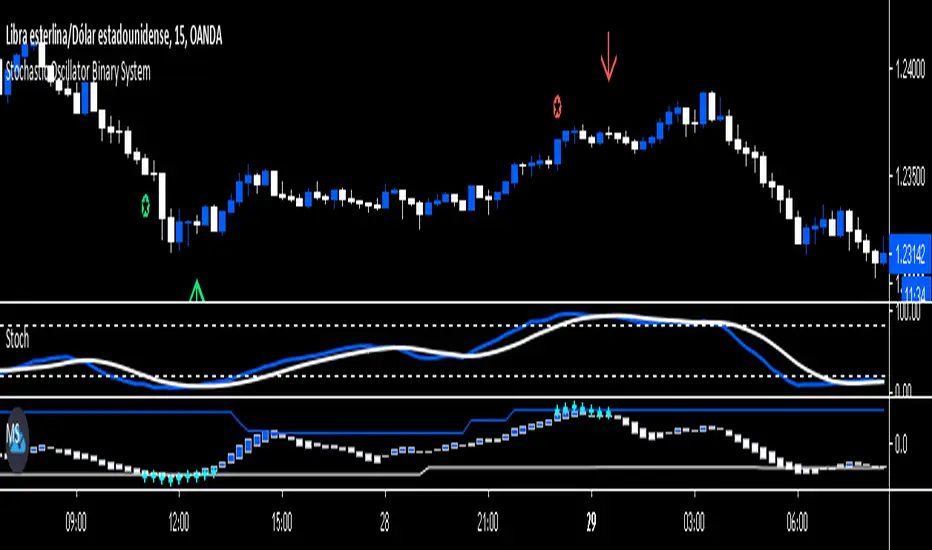
Stochastic Oscillator Binary System by Hashtag_binaryRules
- Time Frame 1 min.
- Expires Time 3 min or 15 min (the best option).
- Markets: Forex (only volatile currency pair), Futures.
- Sessions: London and New York.
Call
- Heiken Ashi Dodger blue;
-Stochastic Oscillator cross upward from oversold Zone (conservative trade, aggressive trade: Stochastic Oscillator cross upward ).
-Matrix three square dodger blue.
Put
- Heiken Ashi white;
- Stochastic Oscillator cross downward from overbougth Zone (conservative trade, aggressive trade: Stochastic Oscillator cross downward ).
- Matrix three square withe.
This Binary System is also good for trade scalping. The same rule for entry with conservative trade:
Exit position options
- For Buy close position when the stochastic line touches 80 levels,
- For Sell close positions when stochastic line touches 20 levels.
- Initial Stop loss on the previous swing.
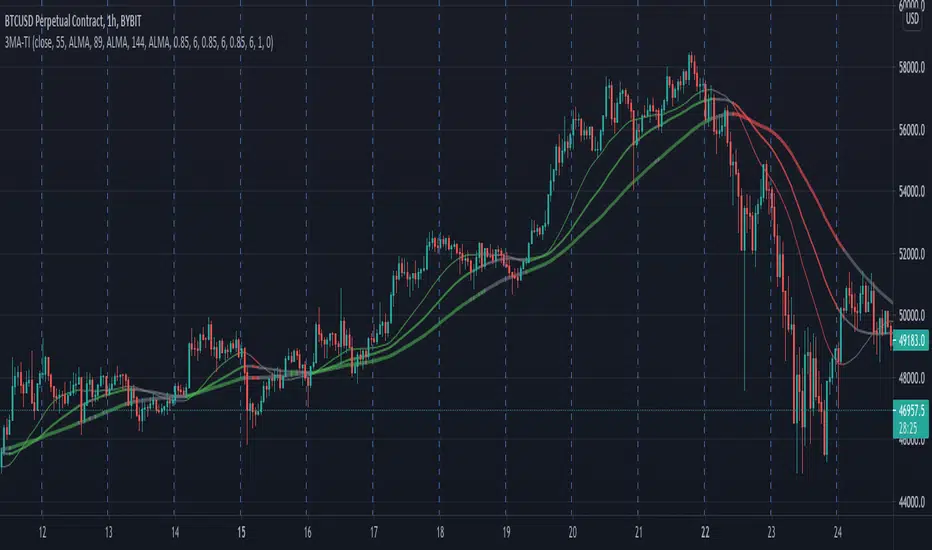
3 MA Trend IndicatorIt is a trend detector indicator, using 3 moving averages.
You can select different MA's and set the periods of them. If all 3 is increasing, the color will be green, if decreasing, the color will be red, gray otherwise.
It can be used for e.g. scalping.