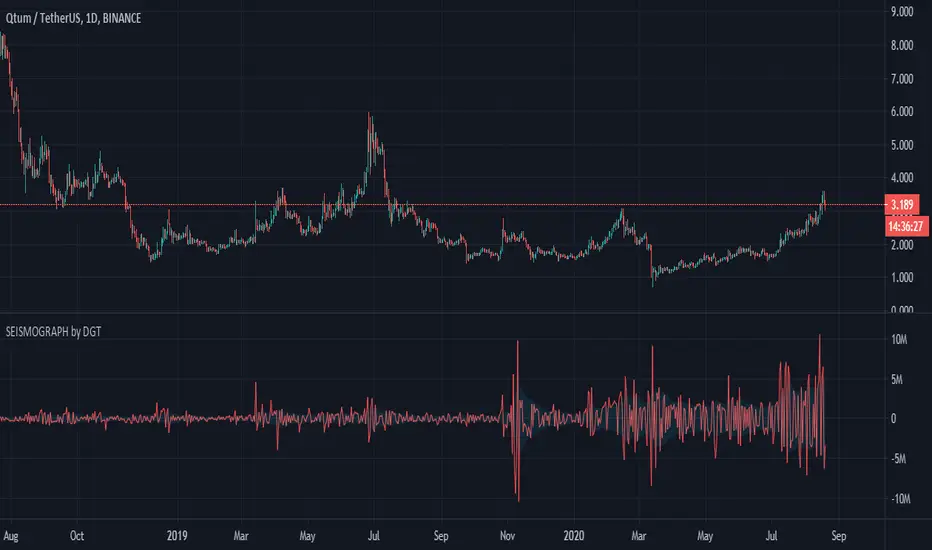
Earthquake Effect by DGTInstitutional investors have a profound impact on financial instruments prices because of the large volume, and their trading activities can greatly impact the price of financial instruments. They sometimes may split trades over time in order to not make a material impact and of course not to decrease liquidity to the point where there may be no one to take the other side of the trade.
Institutional investors (Smart Money) may create an Elephant Effect on the prices of financial instruments, and this study aims to display by emphasizing high volume changes
In the memory of the North Anatolian Earthquake that struck on August 17, 1999, that we remember with pain today, and similarities of plotting outcomes to seismograph plotting I preferred to name this study as Earthquake Effect (SEISMOGRAPH)
Disclaimer:
Trading success is all about following your trading strategy and the indicators should fit within your trading strategy, and not to be traded upon solely
The script is for informational and educational purposes only. Use of the script does not constitute professional and/or financial advice. You alone have the sole responsibility of evaluating the script output and risks associated with the use of the script. In exchange for using the script, you agree not to hold dgtrd TradingView user liable for any possible claim for damages arising from any decision you make based on use of the script
Search in scripts for "smart"
Apex Liquidity & Trend Architect [Smart]Trading charts often suffer from two problems: Noise (too many false signals in chopping markets) and Clutter (too many old lines and zones obscuring price).
ALTA solves both. It is a streamlined, institutional-grade trend system that uses ADX filtering to silence weak signals and Time-Decay logic to automatically clean up old liquidity zones. It respects your screen real estate, showing you only what matters, right now.
1. The "Smart" Engine
Unlike standard trend indicators that repaint or clutter the screen, ALTA introduces three key innovations:
A. Hull Moving Average (HMA) Baseline
We have upgraded the core engine to use the Hull Moving Average. HMA is significantly faster and smoother than standard EMAs or SMAs, reducing lag on entry signals.
Note: You can switch back to WMA or SMA in the settings if you prefer a slower pace.
B. ADX Momentum Filtering
Quality over Quantity: The script monitors the ADX (Average Directional Index). If the trend flips, but the ADX is below 20 (weak trend), the signal is blocked.
This prevents you from getting chopped out during sideways accumulation phases. You only get a "BUY" or "SELL" label when there is actual momentum behind the move.
C. Adaptive Gradient Coloring
The candles do not just turn Green or Red. They change intensity based on trend strength.
Bright/Vivid Candles: Strong Momentum (High ADX).
Dark/Dull Candles: Weak Momentum (Low ADX).
Visual Cue: If the candles are fading into the background, stay out of the market.
2. Self-Cleaning Liquidity Zones
Most support/resistance indicators leave old boxes on the chart forever. ALTA uses a Decay Protocol.
Volume Validation: Supply/Demand zones are only drawn if the pivot point had volume significantly higher than average (configurable).
Mitigation: If price wicks through a zone, it is deleted instantly.
Time Decay (New): If a zone is not hit within a set number of bars (Default: 100), it automatically deletes itself. This keeps your chart focused on fresh levels only.
3. The Minimalist HUD
A simplified dashboard in the corner of your screen provides an instant health check of the market:
ALTA Label: System Status.
Trend: BULL / BEAR / WAIT (Squeeze).
Power: WEAK / SOLID / STRONG (Based on ADX).
4. How to Trade (The Strategy)
The High-Probability Buy
Trend: Ribbon is Green.
Candles: Candles are Bright Green (indicating High ADX Strength).
Signal: A "BUY" label appears (confirmed by ADX filter).
Liquidity: Price is bouncing off a valid Demand Zone.
The High-Probability Sell
Trend: Ribbon is Red.
Candles: Candles are Bright Red (indicating High ADX Strength).
Signal: A "SELL" label appears.
Liquidity: Price is rejecting off a valid Supply Zone.
When to STAY OUT
The Squeeze: If the ribbon turns Grey/White, volatility is compressing. Wait for the breakout.
The Fade: If the candles are dark/translucent, momentum is dying. Take profits or wait for a fresh impulse.
5. Settings & Customization
Basis Type: Switch between HMA (Fast), WMA (Standard), or SMA (Slow).
Signal Quality Filter: Toggle the ADX filter on/off.
Zone Life: How many bars should a Supply/Demand zone survive before decaying?
Tooltips: Every single setting in this script includes a descriptive tooltip. Hover over the "i" icon in the settings menu for detailed explanations of every feature.
Disclaimer
This indicator is for educational purposes only. Past performance (even with smart filtering) does not guarantee future results. Always manage your risk.

FU Candle Detector (Smart Money Concept) En Anglais🧠 Overall concept: “FU Candle” in Smart Money logic
In the context of Smart Money Concepts (SMC) or ICT (Inner Circle Trader), an FU Candle (also known as a “Fakeout Candle” or “Manipulation Candle”) is a candle that:
Creates an imbalance or a break (often above a swing high or below a swing low),
Attracts liquidity by trapping retail traders (liquidity grab),
Then abruptly reverses direction, revealing the hand of “Smart Money” (large institutions).
It therefore often marks:
The point of manipulation before an impulsive movement (reversal),
An area of interest for entering in the institutional direction (after the liquidity grab).
---
⚙️ How the “FU Candle Detector” script works
The script identifies these candlesticks by observing several typical criteria:
1. Detection of the manipulative candle (FU Candle)
Search for a candlestick that breaks a previous swing (significant high or low),
But closes in the opposite direction, often below/above the broken zone,
Thus indicating a fakeout.
Examples:
Bullish FU Candle: breaks a previous low, but closes bullish.
Bearish FU Candle: breaks a previous high, but closes bearish.
---
2. Visualization on the chart
The script generally displays:
🔴 Red markers for bearish FUs (Fake Breakout upwards),
🟢 Green markers for bullish FUs (Fake Breakout downwards),
🟦 Rectangles of areas of interest (often around the FU Candle Open),
📏 Horizontal lines on areas of imbalance (OB/FVG if integrated).
---
3. Possible additions depending on the version
Depending on the version you have received, the script can also:
Detect Fair Value Gaps (FVG) around FU Candles,
Mark Order Blocks (OB) associated with manipulation,
Add alerts when new FU Candles are detected,
Calculate the distance between the manipulation point and the price return,
Filter according to candle size, volume, or market structure (MSB/CHoCH).
---
🎯 Practical use
FU Candles are often used:
As confirmation of an imminent reversal,
To identify institutional entry zones (hidden Order Block),
To anticipate the direction of the next impulse after the liquidity hunt.
Typical entry example:
> Wait for the formation of an FU Candle + price return within the candle body = entry in the opposite direction to the false breakout.
📈 Recommended combinations
This detector is often combined with:
Structure Break Indicator (CHoCH / BOS)
Liquidity Pool Zones
Fair Value Gap Finder
Order Block Detector
This gives you a complete Smart Money Concept system, capable of mapping:
1. Where liquidity has been taken,
2. Where the price is rebalancing,
3. Where Smart Money is repositioning its orders.

MILLION MEN - Smart ZonesMILLION MEN — Smart Zones
What it is
A smart, structure-based Support/Resistance indicator that automatically anchors dynamic Smart Zones from the latest confirmed swing high and low. It identifies two adaptive regions — the Premium Zone near swing highs and the Discount Zone near swing lows — with an optional 50% equilibrium line for balanced price analysis.
How it works (high-level)
Confirmed swings: Uses ta.pivothigh and ta.pivotlow with adaptive or manual lookback.
Smart pairing: When both recent pivots are confirmed, the script anchors a new pair and builds zones based on that range.
Dynamic zones:
Discount Zone: Bottom portion of the range (e.g., 25%).
Premium Zone: Top portion of the range.
Midline: Optional 50% equilibrium; can extend right.
Lifecycle control:
Zones auto-update as new highs/lows appear.
Option to re-anchor when a new swing pair forms.
Option to auto-expire after a set number of bars for clean charts.
Color scheme:
Green = Discount Zone
Fuchsia = Premium Zone
Gray = Midline
How to use
Works well on 5m–1H for intraday, or 4H–1D for swing.
Use the Discount Zone for long bias setups and the Premium Zone for short bias confirmations.
Combine with your preferred momentum, VWAP, or volume tools for confluence.
Adjust Zone Depth % and Auto-expire depending on your timeframe.
Originality & value
Unlike static S/R indicators, Smart Zones evolve with price structure — re-anchoring on new swing formations while maintaining clarity and balance. Its confirmed-pivot logic avoids repainting and produces professional, non-cluttered charts for precision trading.
Limitations & transparency
Pivots confirm with delay equal to pivot length; this prevents repaint.
Results differ by asset and volatility regime.
Non-standard chart types (Heikin-Ashi, Renko, Range) are not supported.
This script provides analytical guidance, not financial advice.
ULTIMATE Smart Trading Pro 🔥
## 🇬🇧 ENGLISH
### 📊 The Most Complete All-in-One Trading Indicator
**ULTIMATE Smart Trading Pro** combines the best technical analysis tools and Smart Money Concepts into a single powerful and intelligent indicator. Designed for serious traders who want a real edge in the markets.
---
### ✨ KEY FEATURES
#### 💰 **SMART MONEY CONCEPTS**
- **Order Blocks**: Automatically detects institutional zones where "smart money" enters positions
- **Break of Structure (BOS)**: Identifies structure breaks to confirm trend changes
- **Liquidity Zones**: Spots equal highs/lows areas where institutions hunt stops
- **Market Structure**: Visually displays bullish (green background) or bearish (red background) structure
#### 📈 **ADVANCED TECHNICAL INDICATORS**
- **RSI with Auto Divergences**: Classic RSI + automatic detection of bullish and bearish divergences
- **MACD with Signals**: Identifies bullish and bearish crossovers in real-time
- **Dynamic Support & Resistance**: Adaptive zones with intelligent scoring based on volume, multiple touches, and ATR
- **Fair Value Gaps (FVG)**: Detects unfilled price gaps (imbalance zones)
#### 📐 **AUTOMATIC TOOLS**
- **Auto Fibonacci**: Automatically calculates Fibonacci retracement levels on the last major trend
- **Pivot Points**: Daily, Weekly, or Monthly pivot points (PP, R1, R2, S1, S2)
- **Pattern Finder**: Automatically detects candlestick patterns (Hammer, Shooting Star, Engulfing, Morning/Evening Star) and chart patterns (Double Top/Bottom)
---
### 🎯 HOW TO USE IT
#### Quick Setup:
1. **Add the indicator** to your chart
2. **Open Settings** and enable/disable modules as needed
3. **Adjust parameters** for your trading style (scalping, swing, day trading)
#### Optimal Trading Setup:
🔥 **ULTRA STRONG Signal** when you have:
- An institutional **Order Block**
- Aligned with a **Support/Resistance** tested 3+ times
- An unfilled **FVG** nearby
- An **RSI divergence** confirming the reversal
- On a key **Fibonacci** level (50%, 61.8%, or 78.6%)
- Favorable market structure (green background for buys, red for sells)
---
### 💡 UNIQUE ADVANTAGES
✅ **Adaptive Intelligence**: Automatically adjusts to market volatility (ATR)
✅ **Volume Filters**: Validates important levels with volume confirmation
✅ **Multi-Timeframe Ready**: Works on all timeframes (1m to 1M)
✅ **Complete Alerts**: Notifications for all important signals
✅ **Clear Interface**: Emojis and colored labels for quick identification
✅ **Intelligent Scoring**: Levels ranked by importance (🔴🔴🔴 = very strong)
✅ **100% Customizable**: Enable only what you need
---
### 🎨 SYMBOL LEGEND
**Smart Money:**
- 🟢 OB = Bullish Order Block
- 🔴 OB = Bearish Order Block
- BOS ↑/↓ = Break of Structure
- 💧 LIQ = Liquidity Zone
**Candlestick Patterns:**
- 🔨 = Hammer (bullish signal)
- ⭐ = Shooting Star (bearish signal)
- 📈 = Bullish Engulfing
- 📉 = Bearish Engulfing
- 🌅 = Morning Star (bullish reversal)
- 🌆 = Evening Star (bearish reversal)
**Indicators:**
- 🚀 MACD ↑ = Bullish crossover
- 📉 MACD ↓ = Bearish crossover
- ⚠️ DIV = Bearish RSI divergence
- ✅ DIV = Bullish RSI divergence
**Support & Resistance:**
- 🟢/🔴 S1, R1 = Support/Resistance
- 🟢🟢🟢/🔴🔴🔴 = VERY strong level (3+ touches)
- (×N) = Number of times touched
---
### ⚙️ RECOMMENDED SETTINGS
**For Scalping (1m - 5m):**
- SR Lookback: 15
- Structure Strength: 3
- RSI: 14
- Volume Filter: ON
**For Day Trading (15m - 1H):**
- SR Lookback: 20
- Structure Strength: 5
- RSI: 14
- All filters: ON
**For Swing Trading (4H - Daily):**
- SR Lookback: 30
- Structure Strength: 7
- Pattern Lookback: 100
- Fibonacci: ON
---
### 🚨 DISCLAIMER
This indicator is a decision support tool. It does not guarantee profits and does not constitute financial advice. Always test on a demo account before real use. Trading involves significant risks.
---
## 📞 SUPPORT & UPDATES
For questions, suggestions, or bug reports, please comment below or contact the author.
**Version:** 1.0
**Last Updated:** October 2025
**Compatible:** TradingView Pine Script v6
---
### 🌟 If you find this indicator useful, please give it a 👍 and share it with other traders!
**Happy Trading! 🚀📈**

Ralph Indicator - ZaraTrust Smart MoneyThe Ralph Indicator – ZaraTrust Smart Money is a powerful yet simple Smart Money Concepts (SMC) based tool designed for traders who want to trade like institutions. It auto-detects high-probability Buy/Sell zones, Support/Resistance levels, and Demand/Supply areas on the chart — giving you clear, visual, and actionable signals without the clutter.
⸻
🔍 Key Features:
✅ Smart Money Structure
• Uses pivot-based logic to identify potential structure points
• Helps you understand market flow (e.g., BOS, CHoCH simplified logic)
✅ Automatic Support & Resistance
• Plots major levels based on significant highs and lows
• Helps catch key reversal or breakout zones
✅ Demand & Supply Zones
• Visually shows areas where price may react strongly
• Based on smart pivot detection from recent swings
✅ Buy/Sell Trade Signals
• Highlights buy when price breaks resistance (possible bullish shift)
• Highlights sell when price breaks support (possible bearish shift)
✅ Clean & Easy UI
• Toggle features on/off from settings panel
• Labels and shapes are plotted clearly on the chart for instant reading
⸻
🛠️ Recommended Use:
• Use on 15min to 4H timeframe for intraday or swing trading
• Combine with price action (e.g., confirmation candles, liquidity grab)
• Works best when paired with institutional logic (OBs, FVG, liquidity)
⸻
⚠️ Disclaimer:
This indicator is a tool, not a signal service.
It does not guarantee 98% accuracy, but it’s designed to highlight smart money zones and high-probability areas. Always do your own risk management and backtest before using on a live account.

Liquidity Levels (Smart Swing Lows)Liquidity Levels — Smart Swing Low Detection
Efficient Liquidity Sweep Visualization for Smart Money Traders
This script automatically identifies and plots liquidity-rich swing lows based on pivot logic, filters them to remove redundant levels, and overlays daily highs/lows for added context — giving Smart Money Concept (SMC) traders a clean, actionable map of liquidity.
It’s designed to be minimal yet powerful: perfect for spotting potential liquidity grabs, mitigation zones, and sweep targets with zero chart clutter.
🔍 What This Script Does:
Detects Smart Swing Lows
Uses fixed pivot detection (left = 3, right = customizable) to identify structurally significant swing lows.
Filters out swing lows that are too close together using a percentage-based spacing threshold to reduce noise.
Mitigation Cleanup Logic
Tracks whether recent price action breaches past swing lows.
If breached, the swing level is automatically removed, keeping only relevant, unmitigated liquidity levels on your chart.
Plots Daily Highs and Lows
Each new trading day, horizontal rays mark the prior day’s high and low — useful for identifying resting liquidity and possible sweep zones.
Labeling and Style Customization
Optional labels for swing lows.
Full control over label size, color, and visibility to match any chart aesthetic.
Timeframe Filtering
Runs exclusively on 5m, 10m, and 15m charts to ensure optimal reliability and signal clarity.
⚙️ Customization Features:
Pivot sensitivity (Right side control)
Minimum distance between swing lows (in %)
Label visibility, size, and color
Line width and colors for both swing levels and daily highs/lows
Mitigation cleanup lookback length
💡 How to Use:
Add the script to a qualifying intraday chart (5–15m).
Use the swing low levels to monitor liquidity-rich zones.
Combine with your personal strategy to identify liquidity grabs, potential reversal zones, or entry points following a sweep.
Let the built-in cleanup logic remove any already-mitigated levels so you can focus on active targets.
🚀 What Makes It Unique:
This isn’t just another pivot plotter — it’s a smart, self-cleaning SMC tool designed for modern liquidity-based trading strategies.
A must-have for traders using concepts like liquidity grabs, mitigation blocks, or sweep-to-reverse trade models.
🔗 Best used in combination with:
✅ First FVG — Opening Range Fair Value Gap Detector: Pinpoint the day’s first imbalance zone for intraday setups.
✅ ICT SMC Liquidity Grabs + OB + Fibonacci OTE Levels: Confluence-based entries powered by liquidity logic, order blocks, and premium/discount zones.
Used together, these scripts form a complete Smart Money toolkit — helping you build high-probability setups with confidence, clarity, and clean charts.

Wyckoff Range Detector [Beta] + Smart Money ElementsThis indicator detects the key phases of the Wyckoff market structure and integrates smart money elements, such as Order Blocks (OB), Fair Value Gaps (FVG), and Breaker Blocks. It also helps identify potential reversal zones (LPS, UTAD, Spring), breakout opportunities, and provides automatic Risk-Reward (R:R) calculations.
Key Features:
Wyckoff Phases Detection:
Automatically detects key phases of Wyckoff's market structure:
B (Range) – The initial range of accumulation.
C (Spring Phase) – Accumulation phase with a potential breakout.
C (UTAD Phase) – Upthrust After Distribution, indicating a potential reversal.
D (LPS Phase) – Last Point of Support, signaling accumulation before a breakout.
E (Breakout) – Phase marking breakout from range.
Re-Accumulation – Possible continuation in the range after a breakout.
Re-Distribution – Possible breakdown of a distribution phase.
Smart Money Elements:
Order Blocks (OB): Identifies Bullish and Bearish OBs to anticipate market entries.
Fair Value Gap (FVG): Highlights imbalance areas where price is likely to return.
Breaker Blocks: Marks areas where the price has previously broken a structure, indicating strong supply/demand zones.
Automatic Risk-Reward Calculation:
Smart RR: Automatically calculates Risk-Reward (R:R) ratios from LPS phases and Order Blocks. It draws lines to indicate target and stop levels with green for the target and red for the stop.
Visual representation of the entry signal with target and stop levels displayed.
Alerts:
Set alerts for phase changes, breakout, re-accumulation, or re-distribution to stay updated on the market’s movements.
Visual Tools:
Labels are used to indicate key zones such as AR, SC, LPS, and Spring Zones.
Draw boxes for the Spring and LPS phases to highlight areas where price action is likely to reverse.
Lines to represent potential breakouts, with customizable risk-reward indicators.
How to Use:
Apply the Indicator on any chart.
Identify Wyckoff phases to understand market trends.
Monitor Smart Money Elements (OB, FVG, Breaker) for entry and exit points.
Use automatic Risk-Reward levels for managing trades.
Set alerts for various Wyckoff phases and smart money signals to stay updated.

RSI+ Crypto Smart Strategy by Ignotus ### **RSI+ Crypto Smart Strategy by Ignotus**
**Description:**
The **RSI+ Crypto Smart Strategy by Ignotus** is an advanced and visually enhanced version of the classic **Relative Strength Index (RSI)**, developed by the **Crypto Smart** community. This indicator is designed to provide traders with a clear and actionable view of market momentum, overbought/oversold conditions, and potential reversal points. With its sleek design, customizable settings, and intuitive visual signals, this tool is perfect for traders who want to align their strategies with the principles of the **Crypto Smart** methodology.
Whether you're a beginner or an experienced trader, this indicator simplifies technical analysis while offering powerful insights into market behavior. It combines traditional RSI calculations with advanced visual enhancements and natural language interpretations, making it easier than ever to interpret market conditions at a glance.
---
### **Key Features:**
1. **Enhanced RSI Visualization:**
- The RSI line dynamically changes color based on its position relative to the 50-level midpoint:
- **Green** for bullish momentum (RSI > 50).
- **Red** for bearish momentum (RSI < 50).
- Overbought (default: 70) and oversold (default: 30) levels are clearly marked with customizable colors and shaded clouds for better visibility.
2. **Customizable Settings:**
- Adjust the RSI period, overbought/oversold thresholds, and background transparency to match your trading style.
- Fine-tune pivot lookback ranges and other parameters to adapt the indicator to different timeframes and assets.
3. **Interactive Information Table:**
- A compact, easy-to-read table provides real-time data on the current RSI value, its direction (▲, ▼, →), and a natural language interpretation of market conditions.
- Choose from three text sizes (small, medium, large) to optimize readability.
4. **Natural Language Interpretations:**
- The indicator includes a detailed explanation of the RSI's current state in plain English:
- Momentum trends (bullish, bearish, or neutral).
- Overbought/oversold warnings with potential reversal alerts.
- Clear guidance on whether the market is trending or ranging.
5. **Visual Buy/Sell Signals:**
- Triangles (▲ for buy, ▼ for sell) highlight potential entry and exit points based on RSI crossovers and divergence patterns.
- Configurable alerts notify you in real-time when key signals are triggered.
6. **Improved Aesthetics:**
- Clean, modern design with customizable colors for lines, clouds, and backgrounds.
- Dynamic shading and transparency options enhance chart clarity without cluttering the workspace.
---
### **How to Use This Indicator:**
- **Overbought/Oversold Zones:** Use the RSI's overbought (above 70) and oversold (below 30) zones to identify potential reversal points. Look for confirmation from price action or other indicators before entering trades.
- **Momentum Analysis:** Monitor the RSI's position relative to the 50-level midpoint to gauge bullish or bearish momentum.
- **Trend Identification:** Combine the RSI's readings with price trends to confirm the strength and direction of the market.
- **Entry/Exit Signals:** Use the visual signals (triangles) to spot potential entry and exit points. These signals are particularly useful for swing traders and scalpers.
---
### **Why Choose RSI+ Crypto Smart Strategy?**
This indicator is more than just an RSI—it's a complete tool designed to streamline your trading process. By focusing on clarity, customization, and actionable insights, the **RSI+ Crypto Smart Strategy** empowers traders to make informed decisions quickly and confidently. Whether you're trading cryptocurrencies, stocks, or forex, this indicator adapts seamlessly to your needs.
---
### **Developed by Crypto Smart:**
The **RSI+ Crypto Smart Strategy by Ignotus** is part of the **Crypto Smart** ecosystem, a community-driven initiative aimed at providing innovative tools and strategies for traders worldwide. Our mission is to simplify technical analysis while maintaining the depth and precision required for successful trading.
If you find this indicator helpful, please leave a review and share it with fellow traders! Your feedback helps us continue developing cutting-edge tools for the trading community.
---
### **Disclaimer:**
This indicator is a technical analysis tool and should not be considered financial advice. Trading involves risk, and past performance is not indicative of future results. Always conduct your own research and consult with a financial advisor before making trading decisions. Use of this indicator is at your own risk.

Trailing Stop Loss Smart [TradingFinder] Market Trend + CVD/EMA🔵 Introduction
Trailing Stop Loss (TSL) is one of the most powerful tools available. A Trailing Stop Loss is a modification of a typical stop order that adjusts dynamically based on market price movement. It can be set at a defined percentage or dollar amount away from the security's current market price, making it a flexible tool for locking in profits while minimizing risk. Unlike standard stop-loss orders, a Trailing Stop follows the market in the direction of the trade, protecting gains without requiring constant manual adjustments.
The Trailing Stop Loss Smart (TFlab Trailing Stop) indicator takes this concept even further by incorporating advanced metrics like Cumulative Volume Delta (CVD), volume dynamics, and Average True Range (ATR). This combination not only enhances risk management but also acts as a trend identifier, providing traders with a powerful tool to capitalize on both short-term and long-term price movements.
This indicator also supports various Order Types, allowing for flexible strategies that include a trailing stop/stop-loss combo to maximize winning trades while minimizing losses. The trailing stop limit is particularly useful for traders who want to set their stop at a precise level relative to the current market price, either by a percentage or a dollar amount. The Trailing Stop Loss Smart indicator can help ensure that traders do not exit too early during trends, while the stop-loss feature kicks in during reversals.
The advantages of using a Trailing Stop Loss are its ability to protect profits and reduce the emotional decision-making process in volatile markets. However, like all trading strategies, it has disadvantages, such as the risk of triggering too early during normal market fluctuations. By understanding how the Trailing Stop Loss Smart indicator integrates features like CVD, ATR, and volume analysis, traders can leverage its full potential while navigating these pros and cons.
With its unique ability to track market movements and trends using Cumulative Volume Delta, volume dynamics, and ATR-based trailing stops, this indicator offers a complete solution for traders looking to secure profits while minimizing downside risk. Whether you're employing a simple trailing stop or a trailing stop/stop-loss combo, this tool provides all the flexibility and precision needed to execute winning trades in various markets, including Forex, Crypto, and Stock.
🔵 How to Use
The Trailing Stop Loss Smart indicator integrates multiple advanced components to provide traders with superior risk management and trend identification.
Here’s how each part of the logic works :
🟣 Cumulative Volume Delta (CVD) Logic
The CVD tracks buying and selling pressure by calculating the difference between upward and downward price movements. When there’s more buying pressure, the CVD is positive, indicating a potential bullish trend. Conversely, more selling pressure results in a negative CVD, pointing to a bearish trend.
CVD Trend Detection : The indicator determines whether the market is in a bullish or bearish phase by comparing the CVD to its moving average. A bullish trend is confirmed when the CVD is above its moving average and the price is closing higher.
A bearish trend occurs when the CVD is below its moving average and the price is closing lower. This trend detection is critical for determining whether the trailing stop should be placed below the price (bullish) or above it (bearish).
🟣 Volume Dynamics
Volume is a key factor in identifying market strength. The Trailing Stop Loss Smart indicator pulls volume data based on the market selected (Forex, Crypto, or Stock) and adjusts the trailing stop based on whether the market is experiencing high volume or low volume.
High Volume : When the current volume exceeds the average volume, the market is in a high-volume state. During these conditions, the trailing stop is placed closer to the price, as high volume often indicates strong trends with less chance of reversals.
Low Volume : In low-volume conditions, the trailing stop gives the market more room to breathe by placing the stop further away from the price. This prevents premature stop-outs in periods of reduced market activity.
🟣 ATR-Based Trailing Stop
The Average True Range (ATR) is used to measure market volatility. The Trailing Stop Loss Smart uses the ATR to dynamically adjust the stop-loss distance.
Bullish Market : When a bullish trend is detected, the trailing stop is placed below the lowest price of the recent bars (determined by the Bar Back parameter), and adjusted by the ATR Multiplier. This allows for tighter protection during strong bullish trends.
Bearish Market : When the market is bearish, the trailing stop is placed above the highest price of recent bars, also adjusted by the ATR Multiplier. This ensures that short positions are safeguarded against sudden reversals.
🟣 Dynamic Stop-Loss Updates
The trailing stop is updated every few bars (according to the Refiner parameter), ensuring it remains relevant to the most recent price action and volume changes. This dynamic feature ensures the stop-loss adapts to both trending and volatile market conditions, without requiring manual intervention.
High Volume with Trends : In periods of high volume and a confirmed trend, the stop-loss is positioned tightly to lock in profits while minimizing the risk of reversal.
Low Volume with Trends : In low-volume conditions, the stop-loss is placed further from the price, allowing the market to move freely without triggering premature exits.
🟣 Visual Representation
The indicator visually represents the trailing stop on the chart, with green lines indicating bullish trends and red lines for bearish trends. This visual aid helps traders quickly assess the state of the market and the position of their trailing stop in real-time.
🔵 Settings
The Trailing Stop Loss Smart indicator offers several customizable settings to suit various trading strategies. Understanding these inputs is key to optimizing the tool for your specific trading style.
🟣 General Settings
Cumulative Mode : This controls how the CVD is calculated.
You can choose between :
EMA : Exponential Moving Average smoothing.
Periodic : Sums the delta over a fixed period.
CVD Period : Defines the look-back period for CVD calculation. A longer period smooths the data, making it less sensitive to short-term fluctuations.
Ultra Data : This Boolean input aggregates volume across multiple exchanges for a more comprehensive view of market activity.
Market Ultra Data : Select between Forex, Crypto, and Stock to ensure the indicator pulls accurate volume data for your market.
🟣 Logical Settings
Moving Average CVD Period : Defines the period for the moving average of the CVD. A longer period smooths the trend, reducing noise.
Moving Average Volume Period : Sets the period for the moving average used to distinguish between high and low volume conditions.
Level Finder Bar Back : Determines how many bars to look back when identifying the highest or lowest price for trailing stop placement.
Levels update per candles : Sets how often (in bars) the trailing stop should be updated to remain in sync with market movements.
ATR On : Toggles the use of ATR to adjust the trailing stop based on volatility.
ATR Multiplie r: Defines how far the stop is placed from the price based on the ATR. A larger multiplier increases the stop distance, reducing the likelihood of getting stopped out during market fluctuations.
ATR Multiplier Adjusts the distance of the trailing stop based on the ATR. A higher multiplier places the stop further from the price, providing more breathing room in volatile markets.
🔵 Conclusion
The Trailing Stop Loss Smart indicator is a comprehensive tool for traders looking to manage risk while identifying market trends. By incorporating Cumulative Volume Delta (CVD) to detect buying and selling pressure, volume dynamics to gauge market activity, and ATR to adjust for volatility, this indicator ensures that stop-loss levels are both adaptive and protective.
Whether you’re trading in Forex, Crypto, or Stock markets, the Trailing Stop Loss Smart allows you to capitalize on trends while dynamically adjusting to changing market conditions. Its ability to distinguish between high-volume and low-volume periods ensures that you’re not stopped out prematurely during periods of consolidation or market hesitation.
By providing real-time visual feedback, dynamic adjustments, and trend identification, this indicator serves as a vital tool for traders aiming to maximize profits while minimizing risk. Its versatility and adaptability make it an essential part of any trader’s toolkit, helping you stay ahead in fast-moving markets while safeguarding your positions.

Elev8+ Impulse LevelsElev8+ Impulse Levels | Smart Support & Resistance
Ever notice price rejecting “empty” areas on the chart—like it remembered something that isn’t obvious?
That “something” is often Institutional Impulse : footprints left behind by large, aggressive moves that get defended again days or weeks later .
Elev8+ Impulse Levels automatically detects these moments and projects the most important prices forward so you can see the structure most traders miss.
— — —
🧠 How It Works (The Logic)
This is not a typical support/resistance tool. It does not hunt swing highs/lows.
It looks for Market Intent —the “Perfect Storm” when two conditions align:
Volume Spike — buying/selling pressure significantly exceeds average volume (multiplier-based).
Volatility Expansion — the candle body is unusually large relative to recent ATR.
When both occur, the script marks the event and treats the impulse close as a key “line in the sand” that can influence future reactions.
— — —
🎯 How to Use These Levels
The script includes a Smart Line behavior that changes level styling based on how price interacts with it—so you can quickly separate two core setups:
1) The Defense (Bounce)
Visual: 🟢 Solid line (Fresh / Untouched)
What it means: Price has not yet traded through or “invalidated” the level.
What to look for: First return to the level → rejection / bounce behavior.
Why it matters: Large players often defend prior entries; first tests can react sharply.
2) The Flip (Break & Retest)
Visual: ◌ Dotted line (Broken / Re-priced)
What it means: A candle has closed through the level.
What to look for: Price returns to the dotted level from the other side (“kiss”) → continuation.
Why it matters: Broken support can act as resistance (and vice versa), similar to a breaker concept.
— — —
✨ Key Features
Smart Visualization — levels automatically transition from solid → dotted when broken to reduce chart noise.
Impulse Candle Highlighting — see the exact candle that created the level (origin clarity).
Fully Customizable Sensitivity — tune volume + size thresholds for Crypto, Forex, Futures, or Stocks.
— — —
🚀 The Elev8+ Workflow
Think of Impulse Levels as your map : it shows where reactions are most likely.
For entry timing, pair it with Elev8+ Pro Reversal to confirm the moment price reacts at these high-value zones.
— — —
Disclaimer: Trading involves risk. This tool is for educational/technical analysis purposes only and does not guarantee future results.

AlgoZ Smart Divergence [Trend Filtered]AlgoZ Smart Divergence is a precision entry tool designed to catch market reversals by analyzing Volume Divergence combined with Multi-Timeframe Trend Filtering. Unlike standard divergence indicators that signal on every minor price fluctuation, this script uses a strict set of filters to only present high-probability trade setups that align with the broader market trend.
This is the Free Edition of the AlgoZ Suite, focused on providing clean, non-repainting Buy and Sell signals based on institutional volume flow.
How It Works The script operates on a 3-step validation process:
Volume Divergence:
It detects anomalies where volume spikes relative to price action (e.g., Price makes a Lower Low, but Volume hits a Higher High).
HTF Trend Painting:
It analyzes a Higher Timeframe (Default: 3 Hours) to determine the macro trend. If the 3H trend is Bullish, the candles turn Green. If Bearish, they turn Red.
Color Match Filtering:
The script includes a smart filter that blocks signals that go against the trend. You will only see BUY signals when the candles are Green (Uptrend) and SELL signals when the candles are Red (Downtrend).
Key Features
Volume Divergence Engine:
Identifies hidden accumulation and distribution zones.
HTF Trend Coloring:
Automatically paints your chart based on Higher Timeframe breakouts (Default: 3-Hour Trend).
Smart Signal Filtering:
Toggles are available to "Only Show Signals Matching Candle Color," ensuring you never trade against the momentum.
EMA Trend Filter:
Includes a built-in 10-period EMA filter to further refine entries.
Volatility Filters:
Optional RSI and ADX filters are included to avoid trading during low-volatility "chop."
How to Use
For Longs (Buys):
Wait for the candles to turn Green (indicating the 3-Hour trend is up) and look for a BUY label. The price must also be above the 10 EMA (if enabled).
For Shorts (Sells):
Wait for the candles to turn Red (indicating the 3-Hour trend is down) and look for a SELL label.
Risk Management:
This script is designed to catch reversals. Always place your Stop Loss below the recent swing low (for buys) or above the swing high (for sells).
Settings
Higher Timeframe:
Default is set to 3 Hours (180 minutes). You can adjust this to 1 Day or 4 Hours depending on your trading style.
EMA Length:
Default is 10.
Color Match Filter:
On by default.

FX OSINT - Institutional Midnight Intelligence For ForexFX OSINT — Institutional Midnight Intelligence For Forex
See Your FX Charts Like an Intelligence Briefing, Not a Guess
If you’ve ever stared at EURUSD or GBPJPY and thought:
Where is the real liquidity?
Is this move sponsored by smart money or just noise?
Am I buying into premium or discount?
…then FX OSINT is designed for you.
FX OSINT (Forex Open Source Intelligence) treats the FX market the way an analyst treats an investigation:
Collect open‑source signals from price, time, and volatility.
Map out liquidity, structure, and sessions in a repeatable way.
Present them in a clean, non‑cluttered dashboard so you can read context quickly.
No rainbow spaghetti. No 12 indicators stacked on top of each other. Just structured information, midnight visuals, and a clear read on what the market is doing right now.
Why FX OSINT Exists
Many FX traders run into the same problems:
Overloaded charts – multiple indicators fighting for space, none talking to each other.
Signals with no context – arrows that ignore structure, sessions, and liquidity.
Tools not tuned for FX – generic indicators that don’t care what pair you are on.
FX OSINT brings this together into one FX‑focused framework that:
Understands structure : BOS/CHOCH, swings, and trend across multiple timeframes.
Respects liquidity : sweeps, order blocks, and FVGs with controlled visibility.
Reads volatility & ADR : how far today’s range has developed.
Knows the clock : London, New York, and key killzones.
Scores confluence : a 0–100 engine that summarizes how much is lining up.
FX OSINT is built for traders who want structured, institutional‑style logic with a disciplined, midnight‑themed UI —not flashing buy/sell buttons.
1. Midnight Dashboard — Top‑Right Intelligence Panel
This panel acts as your compact “situation room”:
CONFLUENCE — 0–100 score blending trend alignment, volatility regime, sessions, liquidity events, order blocks, FVGs, and ADR context.
REGIME — Low / Building / Normal / Expansion / Extreme, driven by ATR relationships, so you know if you’re in chop, trend, or expansion.
HTF / MTF / LTF TREND — Higher‑, medium‑, and current‑timeframe bias in one place, so you see if you are trading with or against the larger flow.
ADR USED — How much of today’s typical range has already been consumed in percentage terms.
PIP VALUE — Approximate pip size per pair, including JPY‑style pairs.
Everything is bold, legible, and color‑coded, but the layout stays minimal so you can:
Look once → understand the context.
2. Structure, BOS, CHOCH — Smart‑Money‑Style Skeleton
FX OSINT tracks swing highs and lows, then shows how structure evolves:
Trend logic based on evolving swings, not just a moving average cross.
BOS (Break of Structure) when price expands in the direction of trend.
CHOCH (Change of Character) when behavior flips and the market structure changes.
Labels are selective, not spammy . You don’t get a tag on every minor wiggle—only when structure meaningfully shifts, so it’s easier to answer:
"Are we continuing the current leg, or did something actually change here?"
3. Liquidity Sweeps, Order Blocks & FVGs — The OSINT Layer
FX OSINT treats liquidity as a key information layer:
Liquidity sweeps — Detects when price spikes through recent highs/lows and then snaps back, flagging potential stop runs.
Order blocks — The last opposite candle before a displacement move, drawn as controlled boxes with limited lifespan to avoid clutter.
Fair Value Gaps (FVGs) — Three‑candle imbalances rendered as precise zones with a cap on how many can exist at once.
Under the hood, boxes are managed so your chart does not become a wall of old zones:
// Draw Order Blocks with overlap prevention
if isBullishOB and showOrderBlocks
if array.size(obBoxes) >= maxBoxes
oldBox = array.shift(obBoxes)
box.delete(oldBox)
newBox = box.new(bar_index , low , bar_index + obvLength, high ,
border_color = bullColor, bgcolor = bullColorTransp,
border_width = 2, extend = extend.none)
array.push(obBoxes, newBox)
Box limits keep the number of zones under control.
Borders and transparency are tuned so you still see price clearly.
You end up with a curated liquidity map , rather than a chart buried under every level price has ever touched.
4. Volatility, ADR & Sessions — Time and Range Intelligence
FX OSINT runs a Volatility Regime Analyzer and an ADR engine in the background:
Volatility regime — Five states (Low → Extreme) derived from fast vs. slow ATR.
ADR bands — Daily high/mid/low projected from the current daily open.
ADR used % — How far today’s move has traveled relative to its typical range.
On the time side:
Asia, London, New York sessions are softly highlighted with a single active background to avoid overlapping colors.
Killzones (e.g., London and New York opens) can be emphasized when you want to focus on where significant moves often begin.
Together, this helps you answer:
"What time is it in the trading day?"
"How stretched are we?"
"Is expansion just starting, or are we late to the move?"
5. ICT‑Style Add‑Ons — BOS/CHOCH, Premium/Discount, and Confluence
For modern FX / ICT‑inspired workflows, FX OSINT includes:
BOS / CHOCH labels — Clear structural shifts based on swings.
Premium / Discount zones — 25%, 50%, 75% levels of the daily range, so you know if you are buying discount in an uptrend or selling premium in a downtrend.
Confluence score — A single number summarizing how many conditions line up in the current context.
Instead of replacing your plan, FX OSINT compresses your checklist into the chart:
Structure
Liquidity
Session / Time
Volatility / ADR
Higher‑timeframe alignment
When these agree, the dashboard reflects it. When they don’t, it stays neutral and lets you see the conflict.
How To Use FX OSINT
FX OSINT is not a signal bot. It is an information engine that organizes context so you can apply your own plan.
A typical workflow might look like:
Start on higher timeframes (e.g., H4/D1) to form directional bias from structure, volatility regime, and ADR context.
Move to intraday timeframes (e.g., M15/H1) around your chosen sessions (London and/or New York).
Look for confluence :
HTF / MTF / LTF trends aligned.
Price in discount for longs or premium for shorts.
Recent liquidity sweep into a meaningful OB or FVG.
Confluence score at or above a level you consider significant.
Then refine entries using BOS/CHOCH on lower timeframes according to your own risk and execution rules.
FX OSINT aims to make sure you do not enter a trade without seeing:
Where you are in the day (ADR and sessions).
Where you are in the volatility cycle (regime).
Who currently appears in control (structure and trend).
Which liquidity was just targeted (sweeps and zones).
Design Choices and Scope
FX OSINT was designed around a few clear constraints:
FX‑focused — Logic and filters tuned for FX majors, minors, exotics, and metals. It is intended for FX markets, not for every possible asset class.
Open‑source — The full Pine Script code is available so you can read it, learn from it, and adapt it to your own workflow if needed.
Clear themes — Two main visual styles (e.g., dark institutional “midnight” and a lighter accent variant) with a focus on readability, not visual noise.
Chart‑friendly — Panels use fixed areas, session highlights avoid overlapping, and boxes are capped/pruned so the chart remains usable.
FX OSINT is for only Forex pairs, not anything else!
Hope you enjoyed and remember your Open Source Intelligence Matters 😉!
-officialjackofalltrades

SMC Pre-Trade Checklist (Mozzys)Here is a **clean, professional description** you can use when publishing your TradingView script.
It clearly explains what the indicator does and why traders use it—perfect for the public library.
---
# **📌 Script Description (for Publishing)**
**SMC Pre-Trade Checklist (Compact Edition)**
This indicator provides a **smart, compact on-chart checklist** designed for traders who use **Smart Money Concepts (SMC)**.
Instead of guessing or rushing entries, the checklist helps you confirm the essential SMC conditions *before* taking a trade.
The checklist displays as a **small 3-column panel** in the corner of your chart, making it easy to scan without covering price action.
All items are controlled through indicator settings, where you can tick each condition as you validate it in your analysis.
---
## **🔥 What This Tool Helps You Do**
This script helps you stay disciplined by verifying the core components of an SMC setup:
### **1. Higher-Timeframe (HTF) Bias**
* Market direction clarity
* Premium vs. discount zones
* HTF POIs and liquidity targets
### **2. Liquidity Conditions**
* Liquidity sweeps
* Liquidity-based take-profit targets
### **3. Market Structure**
* BOS/CHOCH confirmation
* Displacement
* Clean pullback into POI
### **4. Entry Validation**
* Quality POI
* LTF confirmation
* Logical SL/TP and RR
### **5. Risk Management**
* Correct position sizing
* Avoiding high-impact news
* Spread/volatility conditions
### **6. Trader Discipline**
* Trade matches your model
* No revenge or emotional trading
---
## **🎯 Why Traders Love This**
Most losses come from **breaking rules**, not market randomness.
This checklist forces consistency, clarity, and patience—especially in fast environments like FX, indices, and crypto.
* Prevents emotional entries
* Reduces impulsive trades
* Keeps you aligned with your SMC plan
* Works with any strategy or SMC style
* Clean, minimal, non-intrusive layout
---
## **📌 Features**
* Compact 3-column layout
* Customizable from the indicator settings
* Works on all timeframes and assets
* Zero chart clutter
* Perfect for rule-based traders
---
## **🚀 Who This Indicator Is For**
* SMC traders
* ICT-style traders
* Liquidity-based traders
* Anyone who wants more discipline & consistency
* Backtesters who want structured trade evaluation
--

Bassi MACD Pro + ADX Filter + Smart Histogram TP + RSIA professional-grade MACD indicator that dramatically reduces false signals by combining four powerful filters:
Key Features
Classic MACD (12,26,9) with clean, high-visibility histogram coloring
ADX + DI filter – only takes trades when ADX > user-defined threshold (default 25) ensuring you trade only in strong trending markets
Smart Histogram Take-Profit logic – automatically detects the exact moment bullish/bearish momentum starts to weaken after a strong move and marks a precise TP level (one TP per trade – no repainting, no multiple signals)
Zero-line crossover confirmation + histogram direction filter – eliminates many whipsaw signals common in regular MACD
Separate RSI pane with overbought/oversold levels and visual markers (for additional confluence – does not interfere with main logic)
Visual Signals
Green “MACD BUY” label + lime triangle = confirmed long entry in strong trend
Red “MACD SELL” label + red triangle = confirmed short entry in strong trend
Small lime/red “TP” triangles = Smart Histogram Take-Profit triggered (perfect exit timing based on momentum fade)
Alert Conditions Included
MACD BUY
MACD SELL
TP Long Hit
TP Short Hit
Combined “Any Signal” alert
Why this version outperforms standard MACD
Most MACD crossovers fail in ranging markets. This script solves that by:
Requiring strong trend (ADX filter)
Confirming histogram is actually growing in the new direction
Waiting for the true zero-line cross with momentum
Giving you an intelligent, non-fixed % take-profit based on real histogram exhaustion
Excellent for swing trading, day trading, crypto, forex, and stocks on any timeframe (works especially well on 1H–4H–Daily).
Clean, fast, no repainting, fully alert-ready.
Add to chart → set your alerts → trade only the highest-probability MACD signals.

Sima-Smart Money Concepts + RSI CandlestickThis indicator displays the RSI in a candlestick format and marks its support and resistance levels, as well as oversold and overbought zones based on Smart Money concepts.
In fact, this indicator is a combination of a candlestick-style RSI and a Smart Money indicator.

Sima-Smart Money Concepts + RSI Candlestick [LuxAlgo]This indicator displays the RSI in a candlestick format and marks its support and resistance levels, as well as oversold and overbought zones based on Smart Money concepts.
In fact, this indicator is a combination of a candlestick-style RSI and a Smart Money indicator.

ICT Fair Value Gap (FVG) Detector │ Auto-Mitigated │ 2025Accurate ICT / Smart Money Concepts Fair Value Gap (FVG) detector
Features:
• Detects both Bullish (-FVG) and Bearish (+FVG) using strict 3-candle rule
• Boxes automatically extend right until price mitigates them
• Boxes auto-delete when price closes inside the gap (true mitigation)
• No repainting – 100% reliable
• Clean, lightweight, and works on all markets & timeframes
• Fully customizable colors and transparency
How to use:
– Bullish FVG (green) = potential support / buy zone in uptrend
– Bearish FVG (red) = potential resistance / sell zone in downtrend
Exactly matches The Inner Circle Trader (ICT) methodology used by thousands of SMC traders in 2024–2025.
Enjoy and trade safe!

MAHI Indicator v9.5 - Smart Momentum HUD + IntradayMAHI Indicator v9.5 — Smart Momentum HUD (Multi-Framework + Intraday Engine)
A Complete Momentum, Trend, and Setup Framework for Swing, Position & Intraday Traders
MAHI v9.5 is the most advanced version yet — a highly optimized, visual, multi-framework trading system that blends momentum, trend alignment, adaptive setup detection, and now Auto-Intraday Mode for short-term traders.
This indicator acts like a Heads-Up Display (HUD) on your chart: it shows trend strength, squeeze zones, dynamic support/resistance, EMAs, setup validation, and early reversal signals in one clean interface — without clutter.
✔ Core Features
📌 1. Smart Momentum Ribbon
A dynamic EMA-based momentum band that visually shifts as trend strength changes.
Helps identify strong vs. weak momentum zones
Adapts to volatility & trend slope
Works on all timeframes (1m to 1M)
📌 2. EMA 9 → 21 Flip System
A precision trend-switching signal:
EMA 9 → 21 BULL = early bullish momentum
EMA 9 → 21 BEAR = early bearish momentum
More reliable than stand-alone MA crossovers
📌 3. Bullish Setup Engine (Standard + Weak)
Automatically identifies when price is entering a reversal-ready state based on:
Position relative to the ribbon
Candle structure
Momentum compression
Slope + exhaustion conditions
Includes:
Bull Setup (Standard) — Higher probability setup
Bull Setup (Weak) — Early or less developed setup
Setup Invalidated — Confirms that the pattern failed
This prevents false confidence & keeps traders disciplined.
📌 4. Strong Buy / Strong Sell Signals
Only appear when multiple confirmations align:
Ribbon bias
EMA slope
Momentum compression
Trend alignment
Filtered to remove noise — especially in lower timeframes.
📌 5. Multi-Timeframe Trend HUD
Top-right panel summarizing:
Overall Trend (Bullish, Bearish, Neutral)
RSI Condition
Daily vs Weekly Alignment
Trading Mode Suggestions (Buy / Sell / LEAPS / Neutral)
This gives instant context.
📌 6. Auto Intraday Engine (NEW in v9.5)
Automatically switches internal logic when you move into intraday timeframes (1m–30m):
Intraday Enhancements:
Adaptive setup detection
Faster momentum sensitivity
EMAs tuned for scalp/swing precision
Tighter invalidation logic
Reduced false positives
Optional strict filtering
Perfect for scalping, day trading & micro-trends
Works instantly — no settings needed.
Just change the chart timeframe and MAHI adjusts.
📌 7. Dynamic High-Timeframe Support (W & M)
Auto-layers weekly & monthly levels:
Helps identify strong bounce zones
Extremely useful for swing & LEAPS traders
📌 8. Weekly Volume Shelf Projection
Lightweight VWAP-style level based on weekly volume aggregation.
Shows probable bottoming areas during pullbacks.
✔ Who This Indicator Is For
Perfect for:
Day traders
Swing traders
Momentum riders
LEAPS & long-term investors
Beginner traders needing a structured system
MAHI adapts to your timeframe and trading style.
✔ Why MAHI Works
MAHI isn’t a single-signal indicator — it’s a framework.
It combines:
Trend
Momentum
Volatility
Setup pattern detection
Validation & invalidation
Multi-timeframe alignment
Dynamic zones
Intraday optimization
This eliminates guesswork and helps traders avoid the emotional traps that cause most losses.
You don’t just get a signal — you get context.
✔ How to Use It
Follow the ribbon bias
Use EMA 9→21 flips as trend confirmation
Look for Bull Setup tags during pullbacks
Avoid trades when you see Setup Invalidated
Respect weekly/monthly HTF support levels
On intraday charts — rely on auto-optimized mode
For swing entries, combine setups with HTF trend HUD
MAHI gives the map. You choose the path.
✔ Final Notes
This version is heavily optimized for performance, clarity, and high-probability signals.
MAHI does not repaint, and works on all assets including:
Stocks
Crypto
ETFs
Forex
Futures

MTF FVG 智能終極版 (Smart Clean)指標名稱:MTF FVG 智能終極版 (Smart Clean)
簡潔介紹
這是一款專為專業交易者設計的 多週期失衡區 (FVG) 監控系統,核心特色如下:
五維度監控:
在任何圖表上同時顯示 月、周、日、4H、2H 五種級別的支撐壓力缺口。
智慧重疊清理 (獨家):
當價格重疊時,自動刪除舊框框,只保留最新的 1~3 個(可設定);若無重疊則完整保留歷史痕跡。確保圖表乾淨且資訊不遺漏。
完美視覺體驗:
大週期無限延伸,小週期固定長度。
文字自動靠右並智慧留白,確保不遮擋右側價格座標。
深色邊框 + 淺色填充 + 中線虛線,層次分明。
Indicator Name: MTF FVG Smart Clean Ultimate Edition
Brief Introduction
This is a multi-timeframe Free Gaps (FVG) monitoring system designed for professional traders. Its core features include:
Five-Dimensional Monitoring: Simultaneously displays support, resistance, and gaps at five timeframes (monthly, weekly, daily, 4H, and 2H) on any chart.
Intelligent Overlap Cleanup (Exclusive): When prices overlap, automatically deletes old boxes, retaining only the latest 1-3 (configurable); if there is no overlap, it retains all historical data. Ensures a clean chart and complete information.
Perfect Visual Experience: Larger timeframes extend infinitely, while smaller timeframes have fixed lengths.
Text automatically aligns to the right with intelligent white space to ensure it doesn't obscure the price coordinates on the right.
Dark borders + light fill + dashed center line create clear visual hierarchy.
VWAP + Volume Spikes See Where Smart Money ExhaustsVolume tells the truth. VWAP tells the bias. This script shows both — live.
If you trade intraday momentum, reversals, or liquidity sweeps, this indicator is built for you.
It shows where volume spikes hit extreme levels, anchored around VWAP and its dynamic bands, so you can instantly spot capitulation or hidden absorption.
🎯 What This Indicator Does
✅ Plots VWAP — session-anchored, updates automatically
✅ Adds dynamic VWAP bands — standard deviation envelopes showing volatility context
✅ Highlights volume spikes — colored candles + background for abnormal prints
✅ Includes alerts — “Volume Spike”, “VWAP Cross”, or a combined alert with direction
✅ Clean visual design — instantly readable in fast markets
It’s your visual orderflow radar — whether you’re trading gold, indices, or small caps.
🔍 Why It Works
Institutions build and unwind positions around VWAP.
Retail often chases volume… this script shows you when that volume becomes too extreme.
A spike above VWAP near resistance? → Likely distribution.
A spike below VWAP near support? → Likely capitulation.
Combine volume exhaustion + VWAP context, and you’ll see market turning points form before most indicators react.
⚙️ Inputs You Can Tune
Bands lookback: adjusts how reactive the VWAP bands are
Band width (σ): set how tight or wide your deviation envelope is
Volume baseline length: controls how “abnormal” a spike must be
Spike threshold: multiplier vs. average volume
Toggle color-coding, bands, and labels
Default settings work well across 1m–15m intraday charts and 1h–4h swing frames.
💡 How Traders Use It
1️⃣ Fade Parabolics:
When a green spike candle pierces upper VWAP band on high volume → smart money unloading.
Look for rejection and short into VWAP.
2️⃣ Catch Capitulations:
When a red spike candle dumps below lower VWAP band → panic selling.
Watch for stabilization and long back to VWAP.
3️⃣ VWAP Rotation Plays:
Alerts for price crossing VWAP help you spot shift in intraday control.
Above VWAP = buyers in charge.
Below VWAP = sellers in charge.
🧠 Best Practices
Pair it with Volume Profile or Delta/Flow tools to confirm exhaustion.
Don’t chase — wait for spike confirmation + reversal candle.
Use it on liquid tickers (NASDAQ, SPY, GOLD, BTC, etc.).
Great for Dux-style small-cap shorts or index pullbacks.
🔔 Alerts Ready
Choose from:
Volume Spike (single-bar explosion)
VWAP Cross Up/Down (trend shift confirmation)
One Combined Alert (any signal, includes ticker, price, and volume)
Set once — get real-time push notifications, Telegram, or webhook signals.
📊 My Favorite Setups
US100 / NASDAQ: fade rallies above VWAP + spike
Gold / Silver: trade reversals from VWAP bands
Small caps: short back-side after volume climax
ES, DAX, Oil: scalp VWAP rotation with confluence
❤️ Support This Work
I release free and premium scripts weekly — combining smart money concepts, VWAP tools, and volume analytics.
👉 Follow me on TradingView for more indicators and setups.
👉 Comment “🔥” if you want me to post the multi-timeframe VWAP + Volume Pressure version next.
👉 Share this with your team — it helps the community grow.

RMBS Smart Detector - Multi-Factor Momentum System v2# RMBS Smart Detector - Multi-Factor Momentum System
## Overview
RMBS (Smart Detector - Multi-Factor Momentum System) is a proprietary scoring method developed by Ario, combining normalized RSI and Bollinger band positioning into a single composite metric.
---
## Core Methodology
### Buy/Sell Logic
Marker (green or red )appear when **all four filters** pass:
**1. RMBS Score (Momentum Strength)**
From the formula Bellow
Combined Range: -10 (extreme bearish) to +10 (extreme bullish)
Signal Thresholds:
• BUY: Score > +3.0
• SELL: Score < -3.0
2. EMA Trend Filter
BUY: EMA(21) > EMA(55) → Uptrend confirmed
SELL: EMA(21) < EMA(55) → Downtrend confirmed
3. ADX Strength Filter
Minimum ADX: 25 (adjustable 20-30)
ADX > 25: Trending market → Signal allowed
ADX < 25: Range-bound → Signal blocked
4. Alternating Logic
Prevents signal spam by requiring alternation:
✓ BUY → SELL → BUY (allowed)
✗ BUY → BUY → BUY (blocked)
________________________________________
Mathematical Foundation
RMBS Formula: scoring method developed by Ario
RMBS = (RSI – 50) / 10 + ((BB_pos – 50) / 10)
where:
• RSI = Relative Strength Index (close, L)
• BB_pos = (Close – (SMA – 2 σ)) / ((SMA + 2 σ) – (SMA – 2 σ)) × 100
• σ = standard deviation of close over lookback L
• SMA = simple moving average of close over lookback L
• L = rmbs_length (period setting)
This produces a normalized composite score around zero:
• Positive → bullish momentum and upper band dominance
• Negative → bearish momentum and lower band pressure
• Near 0 → neutral or transitional zone
Input Parameters
ADX Threshold (default: 25)
• Lower (20-23): More signals, less filtering
• Higher (28-30): Fewer signals, stronger trends
• Recommended: 25 for balanced filtering
Signal Thresholds
• BUY: +3.0 (adjustable)
• SELL: -3.0 (adjustable)
Visual Options
• Marker colors
• Background highlights
• Alert settings
________________________________________
Usage Guidelines
How to Interpret
• 🟢 Green Marker: All conditions met for Bull condition
• 🔴 Red Marker: All conditions met for Bear condition
• No Marker: Waiting for confirmation
________________________________________
Important Disclaimers
⚠️ Educational Purpose Only
• This tool demonstrates multi-factor technical analysis concepts
• Not financial advice or trade recommendations
• No guarantee of profitability
⚠️ Known Limitations
• Less effective in ranging/choppy markets
• Requires proper risk management (stop-loss, position sizing)
• Should be combined with fundamental analysis
⚠️ Risk Warning
Trading involves substantial risk of loss. Past performance does not indicate future results. Always conduct your own research and consult professionals before trading.
________________________________________
Open Source
Full Pine Script code available for educational study and modification. Feedback and improvement suggestions welcome.
“All logic is presented for research and educational visualization.”

CVD Pro – Smart Overlay + Signals (with Persist Mode)What this Indicator Does
CVD Pro visualizes Cumulative Volume Delta (CVD) data directly on your main price chart — helping you detect real buying vs. selling pressure in real time.
Unlike most CVD scripts that run in a separate subwindow, this one overlays price-mapped CVD curves on the candles themselves for better confluence with market structure and FVG zones.
The script dynamically scales normalized CVD values to the price range and uses adaptive smoothing and deviation bands to highlight shifts in trader behavior.
It also includes automatic bullish/bearish crossover signals, displayed as on-chart labels.
⚙️ Main Features
✅ Price-mapped CVD Overlay
CVD is normalized (Z-score) and projected onto the price chart for easy visual correlation with price structure.
✅ Multi-Timeframe Presets
Three sensitivity presets optimized for different chart environments:
Strict (4H) → Best for macro trends and high-timeframe structure.
Balanced (1H / 30m) → Great for active swing setups.
Sensitive (15m) → Captures short-term intraday reversals.
✅ Dynamic Bands & Smoothing
Deviation bands visualize statistical extremes in delta pressure — helping to identify exhaustion and divergence points.
✅ Smart Buy/Sell Signal Logic
Automatic label triggers when the CVD Overlay crosses its smoothed baseline:
🟢 BULL LONG → Rising CVD above the mean (buyers in control).
🔴 BEAR SHORT → Falling CVD below the mean (sellers in control).
✅ Persist Mode
Toggle to keep the last signal visible until a new one forms — ideal for traders who prefer clean chart annotations without noise.
✅ Clean, Minimal Overlay
Everything happens directly on your chart — no extra windows, no clutter. Designed for use with Smart Money Concepts, Fair Value Gaps (FVGs), or volume imbalance setups.
🧩 Use Case
CVD Pro is designed for traders who:
Use Smart Money Concepts (SMC) or ICT-style trading
Watch for FVG reactions, breaker blocks, and liquidity sweeps
Need to confirm order flow direction or momentum strength
Trade intraday or swing setups with precision entries and clear bias confirmation
⚡ Recommended Settings
4H / 1H: Use Strict mode for major structure and confirmation.
1H / 30m: Balanced mode for clear mid-term trend alignment.
15m: Sensitive mode to catch scalps and lower-TF shifts.
🧠 Pro Tips
Combine with RSI or Market Structure Breaks (MSS) for additional confluence.
A strong CVD divergence near a key FVG or 0.5–0.705 Fibonacci zone often signals reversal.
Persistent CVD crossover + price structure break = high-probability entry.
🧩 Credits
Created by Patrick S. ("Nova Labs")
Concept inspired by professional order-flow analytics and adaptive Z-Score normalization.
Would you like me to write a shorter “public summary” paragraph (for the short description at the top of TradingView, the one-liner users see before expanding)?
It’s usually a 2–3 sentence hook like:
“Overlay-based CVD indicator that merges volume delta with price structure. Detect true buying/selling pressure using adaptive normalization, deviation bands, and clean bullish/bearish crossover signals.”
