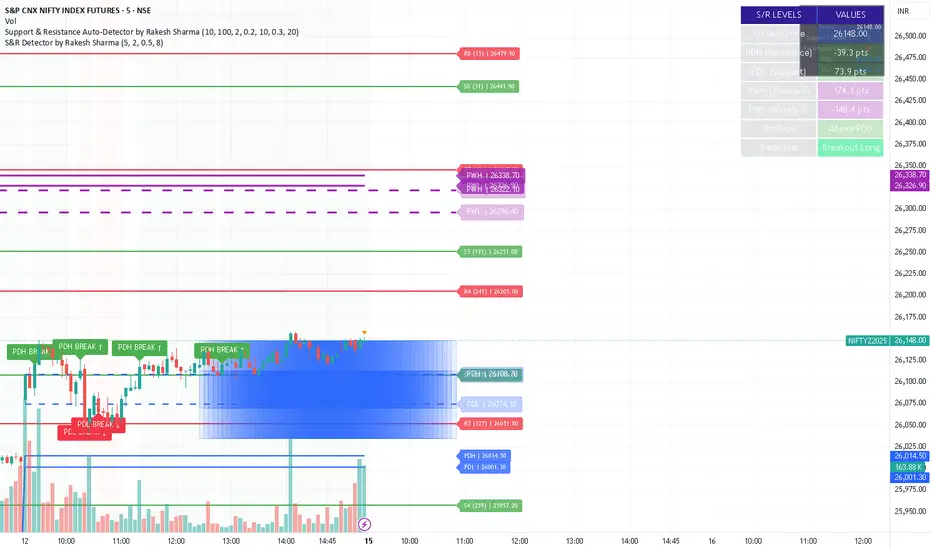
S&R Detector by Rakesh Sharma📊 Support & Resistance Auto-Detector
Automatically identifies key Support and Resistance levels with strength ratings
✨ Key Features:
🎯 Intelligent S/R Detection
Automatically finds Support and Resistance levels based on swing highs/lows
Shows strength rating (Very Strong, Strong, Medium, Weak)
Displays number of touches at each level
📅 Key Time-Based Levels
Previous Day High/Low (PDH/PDL) - Blue lines
Previous Week High/Low (PWH/PWL) - Purple lines
Optional Round Numbers for psychological levels
⚙️ Fully Customizable
Adjust sensitivity (5-20 pivot length)
Filter by minimum touches (1-10)
Control maximum levels displayed (3-20)
Optional S/R zones (shaded areas)
📊 Live Dashboard
Shows nearest Support/Resistance
Distance to key levels
Total S/R levels detected
🔔 Smart Alerts
PDH/PDL breakout signals
Visual markers on chart
Perfect for: Intraday traders, Swing traders, Price action analysis
Search in scripts for "smart"
S&R Detector by Rakesh SharmaSupport & Resistance Auto-Detector
Automatically identifies key Support and Resistance levels with strength ratings
✨ Key Features:
🎯 Intelligent S/R Detection
Automatically finds Support and Resistance levels based on swing highs/lows
Shows strength rating (Very Strong, Strong, Medium, Weak)
Displays number of touches at each level
📅 Key Time-Based Levels
Previous Day High/Low (PDH/PDL) - Blue lines
Previous Week High/Low (PWH/PWL) - Purple lines
Optional Round Numbers for psychological levels
⚙️ Fully Customizable
Adjust sensitivity (5-20 pivot length)
Filter by minimum touches (1-10)
Control maximum levels displayed (3-20)
Optional S/R zones (shaded areas)
📊 Live Dashboard
Shows nearest Support/Resistance
Distance to key levels
Total S/R levels detected
🔔 Smart Alerts
PDH/PDL breakout signals
Visual markers on chart
Perfect for: Intraday traders, Swing traders, Price action analysis
S&R Detector by Rakesh Sharma📊 Support & Resistance Auto-Detector
Automatically identifies key Support and Resistance levels with strength ratings
✨ Key Features:
🎯 Intelligent S/R Detection
Automatically finds Support and Resistance levels based on swing highs/lows
Shows strength rating (Very Strong, Strong, Medium, Weak)
Displays number of touches at each level
📅 Key Time-Based Levels
Previous Day High/Low (PDH/PDL) - Blue lines
Previous Week High/Low (PWH/PWL) - Purple lines
Optional Round Numbers for psychological levels
⚙️ Fully Customizable
Adjust sensitivity (5-20 pivot length)
Filter by minimum touches (1-10)
Control maximum levels displayed (3-20)
Optional S/R zones (shaded areas)
📊 Live Dashboard
Shows nearest Support/Resistance
Distance to key levels
Total S/R levels detected
🔔 Smart Alerts
PDH/PDL breakout signals
Visual markers on chart
Perfect for: Intraday traders, Swing traders, Price action analysis

Ultimate Adaptive RSIUltimate Adaptive RSI
RSI That Adapts to Any Market
This isn't your grandpa's RSI. It dynamically adjusts its sensitivity based on market conditions—smoother in trends, responsive in ranges.
Traditional RSI fails in strong trends and changing volatility. UA-RSI fixes both by adapting its sensitivity in real-time, giving you reliable signals whether the market is trending, ranging, or transitioning between regimes.
How It Adapts:
Smart Pre-Smoothing: Uses Efficiency Ratio to detect trend strength and automatically lengthens/shortens its smoothing window.
Dominant Cycle Detection: Matches its internal period to the market's actual rhythm.
Dynamic Bands: RMS-based overbought/oversold levels that expand/contract with volatility.
Smoothing Stack: ALMA pre-smoothing → Ultimate Smoother → Jurik filter creates the cleanest RSI you've ever seen.
Trade Signals:
Buy: RSI crosses above lower band or midline + price confirms
Sell: RSI crosses below upper band or midline + price confirms
Bands expand in high volatility → wait for deeper extremes
Bands contract in low volatility → take earlier signals
Signal line for crossover entries
Adaptive smoothing = fewer false signals in trends
Day trading: Use 1.0 band multiplier
Swing trading: Use 1.2-1.5 multiplier
Ranging markets: Lower multiplier to 0.8
Trending markets: Raise multiplier to 1.5+
Bands widen in volatility = wait for deeper extremes
Bands tighten in calm markets = take earlier signals
Never trade RSI alone - always wait for price confirmation

S&R Detector by Rakesh SharmaSupport & Resistance Auto-Detector
Automatically identifies key Support and Resistance levels with strength ratings
✨ Key Features:
🎯 Intelligent S/R Detection
Automatically finds Support and Resistance levels based on swing highs/lows
Shows strength rating (Very Strong, Strong, Medium, Weak)
Displays number of touches at each level
📅 Key Time-Based Levels
Previous Day High/Low (PDH/PDL) - Blue lines
Previous Week High/Low (PWH/PWL) - Purple lines
Optional Round Numbers for psychological levels
⚙️ Fully Customizable
Adjust sensitivity (5-20 pivot length)
Filter by minimum touches (1-10)
Control maximum levels displayed (3-20)
Optional S/R zones (shaded areas)
📊 Live Dashboard
Shows nearest Support/Resistance
Distance to key levels
Total S/R levels detected
🔔 Smart Alerts
PDH/PDL breakout signals
Visual markers on chart
Perfect for: Intraday traders, Swing traders, Price action analysis

DeltaPulseDeltaPulse: Professional Cumulative Volume Delta Indicator
DeltaPulse is a free cumulative volume delta (CVD) indicator engineered for modern traders who demand precision, adaptability, and visual clarity. Unlike traditional CVD tools that often suffer from scaling issues, excessive noise, or poor responsiveness across timeframes, DeltaPulse delivers a streamlined, professional-grade solution that "just works" – providing actionable insights into buying and selling pressure with minimal setup.
This indicator accumulates the net difference between buying and selling volume (inferred from candle direction), normalizes it intelligently for consistent readability, and applies advanced smoothing to filter out market noise while preserving momentum signals. The result is a clean, momentum-colored line in a dedicated pane, enhanced by subtle visual cues that highlight key market dynamics.
Whether you're a day trader scalping intraday moves, a swing trader analyzing weekly trends, or an institutional analyst reviewing futures contracts, DeltaPulse adapts seamlessly to your workflow. It's designed to be your go-to tool for confirming trends, spotting divergences, and identifying order flow imbalances – all without the bloat of overcomplicated features.
Key Features
Intelligent Normalization for Universal Compatibility
Automatically adjusts scaling based on chart timeframe and symbol volume profile.
Intraday (1-5 min): Uses a 100-period volume average for responsive, lively signals.
Intraday (15+ min): 50-period average for balanced sensitivity.
Daily/Weekly+: 20-period average for clean, long-term perspective.
Ensures the indicator remains visually meaningful and non-flat on any asset – from low-volume penny stocks to high-liquidity indices like ES or NQ.
Advanced Smoothing Options
Six moving averages to match your trading style:
EMA - Quick reactions to recent delta shifts
SMA - Simple Moving Average - Stable, noise-resistant baseline
WMA - Weighted Moving Average - Emphasizes recent data with linear weighting
HMA - Hull Moving Average - Ultra-smooth yet lag-free – ideal for momentum trading
RMA - Running Moving Average (Wilder's) - Trend-following with minimal whipsaws
VWMA - Volume-Weighted Moving Average - Highlights high-volume delta moves
Lower values increase reactivity; higher values enhance smoothness.
Flexible Reset Mechanisms
Session Reset: Clears CVD at the first regular trading bar each day – perfect for intraday analysis.
Weekly Reset: Resets at the start of each new week – suited for swing and position trading.
No manual intervention required; the indicator handles resets reliably across all timeframes.
Background Shading:
Light green tint above zero; light red below.
Extreme highlights when smoothed CVD exceeds 90% of its 80-bar high/low – flags potential exhaustion or absorption zones.
How It Works
DeltaPulse calculates a simple yet effective volume delta on each bar:
Bullish Bar (close ≥ open): Adds full volume as positive delta.
Bearish Bar (close < open): Subtracts full volume as negative delta.
This raw delta accumulates into a running total (CVD), resetting based on your chosen mode. The total is then:
Normalized against a timeframe-adaptive volume average to ensure consistent scaling.
Smoothed using your selected MA type for noise reduction and trend clarity.
Plotted with momentum-based coloring and visual enhancements.
The output is a single, intuitive line that reveals the underlying battle between buyers and sellers – far more reliably than raw volume bars or basic oscillators.
Trading Applications
DeltaPulse shines in revealing order flow dynamics that price action alone often conceals. Here are proven ways to integrate it:
Trend Confirmation & Momentum Trading
Bullish Setup: Rising green line above zero confirms buyer control – enter longs on pullbacks to support.
Bearish Setup: Falling red line below zero signals seller dominance – short on rallies to resistance.
Zero Line Crosses as Reversal Signals
A crossover from negative to positive territory often marks a sentiment shift – use for entry triggers.
Combine with volume spikes or key levels for high-probability setups.
Enhancement: VWMA mode amplifies signals on high-volume breakouts.
Absorption & Exhaustion Zones
Watch for extreme background highlights: A spike to highs followed by reversal suggests large players absorbing supply.
Ideal for fade trades near overextended levels (e.g., after news events).
Avoid low-volume or illiquid symbols, as delta inference relies on reliable candle data.
Timeframe-Agnostic: Solves the common CVD pitfall of being "dead" on intraday charts or erratic on daily ones through smart, automatic normalization.
Lag-Free Responsiveness: The default HMA smoothing strikes a rare balance – smoother than EMA, faster than SMA – without the computational overhead of exotic filters.
Zero Clutter: No histograms, no extraneous plots, no overwhelming alerts. Just pure, distilled order flow intelligence.

Clean Volume (SUV)The Problem with Raw Volume
Traditional volume bars tell you how much traded, but not whether that amount is unusual. This creates noise that misleads traders:
Stock A averages 1M shares with wild daily swings (500K-2M is normal). Today's 2M volume looks like a spike—but it's just a routine high day.
Stock B averages 1M shares with rock-steady volume (950K-1.05M typical). Today's 2M volume is genuinely extraordinary—institutions are clearly active.
Both show identical 200% relative volume. But Stock B's reading is far more significant. Raw volume and simple relative volume (RVol) can't distinguish between these situations, leading to:
- False signals on naturally volatile stocks
- Missed signals on stable stocks where smaller deviations matter
- Inconsistent comparisons across different securities
---
A Solution: Standardized Unexpected Volume (SUV)
SUV applies statistical normalization to volume, measuring how many standard deviations today's volume is from the mean. This z-score approach accounts for each stock's individual volume stability, not just its average.
SUV = (Today's Volume - Average Volume) / Standard Deviation of Volume
Using the examples above:
- Stock A (high volatility): SUV = 2.0 — elevated but not unusual for this stock
- Stock B (low volatility): SUV = 10.0 — extremely unusual, demands attention
SUV automatically calibrates to each security's behaviour, making volume readings comparable across any stock, ETF, or timeframe.
---
What SUV Is Good For
✅ Identifying genuine volume anomalies — separates signal from noise
✅ Comparing volume across different securities — apples-to-apples z-scores
✅ Spotting institutional activity — large players create statistically significant footprints
✅ Confirming breakouts — high SUV validates price moves
✅ Detecting exhaustion — extreme SUV after extended moves may signal climax
✅ Finding "dry" setups — negative SUV reveals quiet accumulation periods
---
Where SUV Has Limitations
⚠️ Earnings/news events — SUV will spike dramatically (by design), but the statistical reading may be less meaningful when fundamentals change
⚠️ Low-float stocks — extreme volume volatility can produce erratic SUV readings
⚠️ First 20 bars — needs lookback period to establish baseline; early readings are less reliable
⚠️ Doesn't predict direction — SUV measures volume intensity, not whether price will rise or fall
---
How to Read This Indicator
Bar Height
Displays actual volume (like a traditional volume chart) so you can still see absolute levels.
Bar Color (SUV Intensity)
Color intensity reflects the SUV z-score. Brighter = more unusual.
Up Days (Green Gradient):
| Color | SUV Range | Meaning |
|--------------|-----------|------------------------------------------|
| Bright Green | ≥ 3.0 | EXTREME — Highly unusual buying activity |
| Green | ≥ 2.0 | VERY HIGH — Significant accumulation |
| Light Green | ≥ 1.5 | HIGH — Above-average interest |
| Pale Green | ≥ 1.0 | ELEVATED — Moderately active |
| Muted Green | 0 to 1.0 | NORMAL — Typical volume |
| Dark Grey | < 0 | DRY — Below-average, quiet |
Down Days (Red Gradient):
| Color | SUV Range | Meaning |
|------------|-----------|-----------------------------------------|
| Bright Red | ≥ 3.0 | EXTREME — Panic selling or capitulation |
| Red | ≥ 2.0 | VERY HIGH — Heavy distribution |
| Light Red | ≥ 1.5 | HIGH — Active selling |
| Pale Red | ≥ 1.0 | ELEVATED — Moderate selling |
| Muted Red | 0 to 1.0 | NORMAL — Routine down day |
| Dark Grey | < 0 | DRY — Light profit-taking |
Coiled State (Tan/Beige):
When detected, bars turn muted tan regardless of direction. This indicates:
- Volume compression (SUV below threshold for consecutive days)
- Volatility contraction (ATR below average)
- Price tightness (small recent moves)
Coiled states may precede significant breakouts.
Special Markers
"P" Label (Blue) — Pocket Pivot detected. Morales & Kacher's signal fires when:
- Price closes higher than previous close
- Price closes above the open (green candle)
- Volume exceeds the highest down-day volume of the last 10 bars
Pocket Pivots may indicate institutional buying before a traditional breakout.
"C" Label (Orange) — Coiled state confirmed. The stock is consolidating with compressed volume and tight price action. Watch for expansion.
Dashboard
The configurable dashboard displays real-time metrics. Default items:
- Vol — Current bar volume
- SUV — Z-score value
- Class — Classification (EXTREME/VERY HIGH/HIGH/ELEVATED/NORMAL/DRY/COILED)
- Proj RVol — Projected end-of-day relative volume (intraday only)
Additional optional items: Direction, Coil Status, Relative ATR, Pocket Pivot, Average Volume.
---
Practical Usage Tips
1. SUV ≥ 2 on breakouts — Validates the move has institutional participation
2. Watch for SUV < 0 bases — Quiet accumulation zones where smart money builds positions
3. Coil → Expansion — After consecutive coiled days, the first SUV ≥ 1.5 bar often signals direction
4. Pocket Pivots in bases — Early accumulation signals before price breaks out
5. Extreme SUV (≥3) after extended moves — May indicate climax/exhaustion rather than continuation
---
Settings Overview
| Group | Key Settings |
|-----------------|-----------------------------------------------------|
| SUV Settings | Lookback period (default 20) |
| Coil Detection | Enable/disable, sensitivity thresholds |
| Pocket Pivot | Enable/disable, lookback period |
| Display | Dashboard style (Ribbon/Table), position, text size |
| Dashboard Items | Toggle which metrics appear |
| Colors | Fully customizable gradient colors |
---
Credits
SUV concept adapted from academic literature on standardized unexpected volume in market microstructure research. Pocket Pivot methodology based on Gil Morales and Chris Kacher's work. Coil detection inspired by volatility contraction patterns.
---
This indicator does not provide financial advice. Always combine volume analysis with price action, market context, and proper risk management. No animals were harmed during the coding and testing of this indicator.

MACD-V Multi-Timeframe Confluence DashboardThis indicator identifies high-probability trade entries by analyzing momentum alignment across multiple timeframes using the MACD-V (Volatility Normalized MACD) formula. It features a fully customizable signal engine that allows traders to specify exactly which timeframes must agree before a trade signal is generated.
Optimized Defaults
By default, the indicator is tuned to the 5-minute, 15-minute, and 1-hour timeframes. We have found this specific combination performs best for identifying robust trends while filtering out noise. However, the strategy is fully flexible—users can easily adjust these settings to fit scalping (1m/5m) or swing trading (4H/Daily) styles.
Indicator Features
Dynamic Confluence: A Buy or Sell signal (displayed as a large + on the chart) is generated only when all selected timeframes are in agreement. This ensures you are trading with the dominant trend across multiple time scales.
Alternating Signal Filter: To prevent repetitive alerts during strong trends, the script uses a smart filter: a new Buy signal will only trigger if the last confirmed signal was a Sell (and vice versa).
Live Dashboard: An on-screen table displays the real-time status of every timeframe (Trend, Curl, and MACD Value). Timeframes currently active in your strategy are highlighted in yellow.
Local Entry Arrows (Optional): The script includes smaller red/green arrows that indicate simple MACD line crosses on the current chart's timeframe. These can be useful for precise timing but can be noisy in choppy markets. These are turned off by default to keep the chart clean, but can be enabled in the "Visuals" settings if you require granular entry signals.
How to Use
Check the Dashboard: Look for the yellow-highlighted rows in the table to see which timeframes are currently driving your signals.
Wait for the Cross (+): A green + indicates bullish momentum is aligned across all your chosen timeframes.
Refine (Optional): Turn on "Show Local Arrows" if you want to see the specific moment the MACD crosses on your current timeframe to fine-tune your entry.

Scout Regiment - Signal📊 中文版
指标简介
Buy/Sell Signal 多维度交易信号指标
这是一个结合了EMA趋势过滤、CCI动量指标和RSI背景环境的多维度交易信号系统。通过三重过滤机制,帮助交易者在合适的市场环境中捕捉高质量的买卖信号。
核心特点
✅ 趋势过滤:使用233周期EMA确保顺势交易
✅ 动量确认:CCI(33)穿越信号作为入场触发
✅ 背景过滤:RSI(13)环境判断,避免同一背景重复信号
✅ 智能去重:每个RSI背景周期内只标记首次信号
✅ 清晰标识:三角形标记配合颜色区分买卖方向
使用说明
信号逻辑:
做多信号 (Buy):
收盘价 > EMA233(确认上升趋势)
CCI33向上穿越20(动量转强)
情况1:在RSI红色背景中首次出现
情况2:在RSI绿色背景中出现
做空信号 (Sell):
收盘价 < EMA233(确认下降趋势)
CCI33向下穿越80(动量转弱)
情况1:在RSI绿色背景中首次出现
情况2:在RSI红色背景中出现
参数设置
EMA过滤长度:默认233,用于判断主趋势方向
CCI长度:默认33,控制动量指标灵敏度
RSI长度:默认13,用于背景环境判断
重要提示
⚠️ 信号出现后不要立即下单!请务必检查:
CCI中期是否出现"浪子回头"形态
OBV成交量状态是否配合
RSI是否成功穿越50中线
结合其他技术分析工具综合判断
💡 建议配合使用:
支撑阻力位分析
成交量指标(如OBV)
更大周期的趋势确认
📈 English Version
Indicator Overview
Buy/Sell Signal - Multi-Dimensional Trading Signal System
This is a comprehensive trading signal system that combines EMA trend filtering, CCI momentum indicator, and RSI background environment. Through a triple-layer filtering mechanism, it helps traders capture high-quality buy and sell signals in appropriate market conditions.
Key Features
✅ Trend Filter: 233-period EMA ensures trend-following trades
✅ Momentum Confirmation: CCI(33) crossover signals as entry triggers
✅ Background Filter: RSI(13) environment detection to avoid duplicate signals
✅ Smart Deduplication: Only first signal per RSI background cycle
✅ Clear Visualization: Triangle markers with color-coded direction
How to Use
Signal Logic:
Buy Signal:
Close > EMA233 (confirms uptrend)
CCI33 crosses above 20 (momentum strengthens)
Case 1: First occurrence in RSI red background
Case 2: Occurs in RSI green background
Sell Signal:
Close < EMA233 (confirms downtrend)
CCI33 crosses below 80 (momentum weakens)
Case 1: First occurrence in RSI green background
Case 2: Occurs in RSI red background
Parameter Settings
EMA Filter Length: Default 233, for main trend direction
CCI Length: Default 33, controls momentum sensitivity
RSI Length: Default 13, for background environment detection
Important Notes
⚠️ DO NOT enter trades immediately after signal appears! Always check:
Whether CCI shows a "reversal" pattern in medium-term
OBV volume status confirmation
Whether RSI successfully crosses the 50 midline
Combine with other technical analysis tools
💡 Recommended to Use With:
Support/Resistance analysis
Volume indicators (such as OBV)
Higher timeframe trend confirmation
Risk Disclaimer
This indicator is for reference only and does not constitute investment advice. Trading involves risk. Please conduct thorough analysis and use proper risk management before making any trading decisions.
适合交易者类型 / Suitable For:
波段交易者 / Swing Traders
日内交易者 / Day Traders
趋势跟踪者 / Trend Followers
适用市场 / Applicable Markets:
股票 / Stocks
外汇 / Forex
加密货币 / Crypto
期货 / Futures

ForzAguanno - Premium / Discount (Range Glissant)Premium / Discount Zones – Dynamic Range (Fibo-based)
This indicator highlights Premium, Discount, and Equilibrium zones using a dynamic Fibonacci range calculated from recent price action.
It is designed to help traders contextualize price and avoid taking trades in unfavorable locations (e.g. buying too high or selling too low).
- How it works
The indicator automatically:
- Detects the highest high (HH) and lowest low (LL) over a rolling range
- Builds a Fibonacci-style structure between LL → HH
- Defines three key areas:
Discount Zone (lower part of the range)
Equilibrium Zone (around the 50% level)
Premium Zone (upper part of the range)
Two additional extreme levels are used:
0.075 → deep discount
0.925 → deep premium
These levels help isolate areas where price is statistically stretched.
- Visual elements
- Horizontal levels:
- Green → Discount
- Purple → Equilibrium
- Red → Premium
- Text labels are placed inside each zone for instant readability.
Zones are extended into the future for cleaner visualization.
- How to use it
This tool is best used as a context filter, not a standalone signal generator.
Typical use cases:
Look for longs in Discount
Look for shorts in Premium
Use Equilibrium as a neutral / decision zone
Combine with structure, momentum, or entry models
It works particularly well with:
Market structure concepts
Smart money / range-based trading
Session-based strategies
⚠️ Important notes
This indicator does not predict direction
It provides context, not signals
Always combine with proper risk management
Final thoughts
The goal of this indicator is simplicity and clarity:
Know where price is located inside its range before taking a trade.
If you find it useful, feel free to share feedback.

NeoChartLabs McGinley DynamicOne of our Favorite Indicators - the McGinley Dynamic
The MGD is adaptive, it speeds up for crypto and slows down for stocks, this version turns green when bullish and red when bearish - this is a fast indicator so the colors are more reliable on higher time frames.
The McGinley Dynamic is a smart, adaptive moving average technical indicator created by John R. McGinley, designed to overcome the lag and whipsaw issues of traditional moving averages (MAs) by automatically adjusting to varying market speeds, resulting in a smoother, more responsive line that tracks price action better, acting as a reliable trend-following tool or baseline in financial charts.
Shout out to LOXX for the original script, updated to v6.

Momentum Candle V3 by Sekolah TradingMomentum Candle v3 by Sekolah Trading
Description:
Momentum Candle v3 is a technical indicator designed to identify market momentum signals based on price movement within a single candle. The indicator measures the size of the candle's body and wick to determine if the market is showing strong bullish or bearish momentum.
Key Features:
Candle Size: Measures price movement within a single candle to assess market momentum.
Short Wick: Focuses on wick length, with short wicks indicating that the closing price is more significant than the opening price.
Bullish/Bearish Momentum: Provides bullish signals when the closing price is higher than the open, and bearish signals when the closing price is lower than the open.
Customizable Minimum Body: Users can adjust the minimum body size for XAUUSD and USDJPY pairs according to their trading preferences.
Timeframe: Works on M5 and M15 timeframes for XAUUSD and USDJPY currency pairs.
How to Use:
Bullish Signal: The indicator signals bullish momentum when the candle body is sufficiently large and the wick is short, with the closing price higher than the open.
Bearish Signal: The indicator signals bearish momentum when the candle body is sufficiently large and the wick is short, with the closing price lower than the open.
Pip Parameters: Adjust the pip values for XAUUSD and USDJPY according to market conditions or your trading preferences.
Note: This indicator is a tool for technical analysis and does not guarantee specific trading results. It is recommended to use it alongside other strategies and analyses for better accuracy.
Realistic Backtest Results:
To ensure transparency and honesty in the backtest, here are some key factors to consider:
Position Size: The backtest uses a realistic position size of about 5-10% of the account equity per trade.
Commission & Slippage: A commission of 0.1% per trade and slippage of 1 pip were used in the backtest simulation to reflect real market conditions.
Number of Trades: The backtest sample includes more than 100 trades for a representative result.
Example of Backtest Results:
Profitability: The backtest results on XAUUSD and USDJPY show consistent performance with this strategy on the M5 and M15 timeframes.
Commission and Slippage: Adjusting for commission and slippage showed better accuracy under more realistic market scenarios.
How to Use the Indicator:
Signals from this indicator can be used to confirm market momentum in trending conditions. However, it is highly recommended to combine this indicator with other technical analysis tools to minimize the risk of false signals.
Important Notes:
Honesty & Transparency: This indicator is designed to provide signals based on technical analysis and does not guarantee specific trading results.
No Over-Claims: The backtest results displayed represent realistic scenarios and are not intended to promise certain profits.
Original Content: The code for this indicator is original and does not violate any copyrights.
Tagging:
Smart Tags: Momentum, Candle, XAUUSD, USDJPY, Bullish, Bearish, M5, M15, Technical Indicator, Market Momentum.

CODEX OB + BBMA V1CODEX OB + BBMA is a multi-purpose Smart Money Concepts (SMC) indicator that automatically detects and visualizes key institutional trading elements such as Order Blocks, Fair Value Gaps, Rejection Blocks, Break of Structure, Pivots, High Volume Bars, and several qualitative SMC signals.
In addition to SMC tools, this indicator also incorporates multi-timeframe BBMA logic, allowing traders to view higher-timeframe momentum, trend direction, and volatility envelopes directly from the current chart. This makes it easier to align SMC setups—like OB, FVG, and BOS—with BBMA structure such as MA touches, re-entry zones, extreme candles, and volatility expansions.
This combination helps traders identify institutional footprints, multi-timeframe confluence, and displacement-based setups with high clarity.

CODEX OB V1CODEX OB V1 is a multi-purpose Smart Money Concepts (SMC) indicator that automatically detects and visualizes key institutional trading elements such as Order Blocks, Fair Value Gaps, Rejection Blocks, Break of Structure, Pivots, High Volume Bars, and several qualitative SMC signals.
This tool helps traders identify institutional footprints and displacement-based setups with high clarity.

Bar Number IndicatorBar Number Indicator
This Pine Script indicator is designed to help intraday traders by automatically numbering candlesticks within a user-defined trading session. This is particularly useful for strategies that rely on specific bar counts (e.g., tracking the 1st, 18th, or 81st bar of the day).
Key Features:
Session-Based Counting: Automatically resets the count at the start of each new session (default 09:30 - 16:00).
Timezone Flexibility: Includes a dropdown to select your specific trading timezone (e.g., America/New_York), ensuring accurate session start times regardless of your local time or the exchange's default setting.
Smart Display Modes: Choose to show "All" numbers, or filter for "Odd" / "Even" numbers to keep your chart clean.
Custom Positioning: Easily place the numbers Above or Below the candlesticks.
Minimalist Design: Numbers are displayed as floating text without distracting background bubbles.
Zaka Pro: Clear Structure (HH/LL) + MSS ZonesCertainly! Here is a description of the Pine Script indicator you provided, focusing on its main functions and trading strategy, written in English.
---
## Zaka Pro: Clear Structure (HH/LL) + MSS Zones
This is a technical analysis indicator developed in Pine Script (`//@version=5`) designed to automatically identify and plot key price action structural elements based on the **Zig Zag** method, while incorporating a simplified **Market Structure Shift (MSS)** concept, often used in Smart Money Concepts (SMC) or Wyckoff trading.
### Key Features:
1. **Pivot-Based Structure Identification:**
* The indicator uses the standard **`ta.pivothigh`** and **`ta.pivotlow`** functions, determined by the user-defined `Pivot Length` (`prd`). This forms the foundation of the price "swing" structure.
2. **Structural Labeling (HH/LL/LH/HL):**
* It automatically labels the resulting swing points to clearly show the prevailing trend:
* **HH (Higher High):** Continuation of an uptrend.
* **LL (Lower Low):** Continuation of a downtrend.
* **LH (Lower High):** A potential reversal or weakening of an uptrend.
* **HL (Higher Low):** A potential reversal or weakening of a downtrend.
3. **Zig Zag Plotting:**
* The indicator connects the identified pivot points with a **gray line** to visually represent the market swings.
4. **Market Structure Shift (MSS) Strategy:**
* The core strategy detects a potential **trend reversal** when the price breaks the most recent structural pivot:
* **Buy MSS Trigger:** Detected when the price breaks **above the last High** (`last_high`) while the market was in a confirmed **downtrend** (forming Lower Lows).
* **Sell MSS Trigger:** Detected when the price breaks **below the last Low** (`last_low`) while the market was in a confirmed **uptrend** (forming Higher Highs).
5. **Order Block / Entry Zone Plotting:**
* Upon detection of a confirmed MSS (reversal), the indicator plots a colored **Box** representing a potential re-entry zone:
* **BUY ZONE (Green Box):** Plotted after a Buy MSS (breakout to the upside). The zone is defined by the **High and Low of the two candles preceding the last swing Low** (`ob_low_top`, `ob_low_btm`). This acts as a simplified "Order Block" for potential long entries.
* **SELL ZONE (Red Box):** Plotted after a Sell MSS (breakout to the downside). The zone is defined by the **High and Low of the two candles preceding the last swing High** (`ob_high_top`, `ob_high_btm`). This acts as a simplified "Order Block" for potential short entries.
6. **Alerts:**
* Custom alerts are included to notify the user immediately when a Buy or Sell MSS (Market Structure Shift) is detected.
In summary, the indicator is a visual tool that simplifies price action analysis by drawing structure and highlights potential reversal points (MSS) by painting corresponding re-entry zones (Order Blocks) on the chart.

Crypto Leverage Index(OI Norm. + FR)Crypto Leverage Index (OI Z-Score + Funding Rate Signals)
(A tool for detecting speculative extremes and leverage load in crypto derivatives markets.)
Hello, fellow traders around the globe!
In today's crypto futures market, often perceived as a 'playground for large players' (whales/smart money), catching extreme leverage behavior is crucial for survival. I wanted to come up with an indicator to quickly identify such market extremes by focusing on the two most potent indicators of leveraged action: Open Interest (OI) and Funding Rate (FR). The goal is to ride on the shoulders of the market movers by anticipating their next liquidity-driven actions. hope this helps.
❗ IMPORTANT NOTE: This indicator works exclusively on Perpetual Futures or Swap Charts that provide Open Interest (OI) data.
⚪ Overview
This indicator provides a standardized view of speculative activity by calculating the Open Interest (OI) Z-Score . This score reveals when the current level of open leverage is abnormally high (premium) or low (discount) relative to its historical mean and volatility. The index is also augmented with Extreme Funding Rate Signals , which plot simple White Dots on the chart when derivative positioning (long or short bias) reaches an unsustainable, overheated level. The combination of OI volume and positioning bias offers a good method to identify potential market reversal zones driven by leverage liquidation risks (short/long squeezes).
⚪ Score Components
Open Interest Z-Score (Leverage Load)
The primary component standardizes the Open Interest value over a defined lookback `Period` (default 50). This calculation reveals the statistical deviation of current leverage from the norm.
OI Z-Score = (OI - Mean(OI)) / StDev(OI)
Funding Rate (Positioning Bias)
Calculates the approximate funding rate using a TWAP (Time-Weighted Average Price) of the Perpetual Futures Premium, combined with the standard 0.01% Interest Rate.
⚪ Extreme Condition Detection
OI Z-Score Extremes
* Premium Zone (Red Fill) : OI Z-Score is above the user-defined `Threshold` (default 2.0). Indicates high/overstretched leverage.
* Discount Zone (Green Fill) : OI Z-Score is below the user-defined negative threshold (default -2.0). Indicates low/unwinded leverage.
Funding Rate Extreme Signals (White Dots)
These appear as small White Dots ( · ) plotted at fixed levels within the indicator pane. The position indicates the bias:
* Top Dot (Excessive Longs) : Triggered when Funding Rate is greater than Abnormal Funding Rate Threshold (e.g. 0.03%). Indicates excessive Long positioning/greed and potential for a short-term reversal (Long Squeeze risk). The dot is plotted at the positive `FR Signal Plot Level`.
* Bottom Dot (Excessive Shorts) : Triggered when Funding Rate is lower than -Abnormal Funding Rate Threshold(e.g. -0.03%). Indicates excessive Short positioning/fear and potential for a short-term reversal (Short Squeeze risk). The dot is plotted at the negative `FR Signal Plot Level`.
⚪ Leverage Case Scenarios (Price, OI Dynamics & Context)
The OI Z-Score reflects the premium/discount state of *leverage* (Open Interest) , not the price. The price may not be in a premium or discount area simply because the OI is. OI only indicates the volume of outstanding futures positions. You must observe price action and candlestick patterns alongside the OI movements to determine the true contextual hint. Understanding the relationship between price and Open Interest (OI) change is key to interpreting market movements. The cases listed below represent the most common and thinkable patterns, but do not exhaust all possible market behaviors.
1. Long Build-Up (Price ▲, OI ▲): New long positions enter, confirming the rising trend.
2. Short Build-Up (Price ▼, OI ▲): New short positions enter, confirming the falling trend. Due to the inherently long-biased nature of the crypto market, this scenario is less frequently observed than Long Build-Up.
3. Long Covering/liquidation (Price ▼, OI ▼): Existing longs are closed/liquidated. This activity usually results from Panic Selling or forced long liquidation.
4. Short Covering (Price ▲, OI ▼): Existing shorts are forced to close (Short Squeeze).
5. Long Trap (Price ▲, OI ▲ or ▼): Price rises, but OI suggests new positioning that might be trapping longs. Bearish candle pattern can be often shown with the sweep.
6. Short Trap (Price ▼, OI ▲ or ▼): Warning Sign - Price falls, but OI suggests new positioning that might be trapping shorts.
⚪ Key Input Parameters
OI Z-Score
* Period (Default: 50)
Determines how many recent bars are used to calculate the rolling mean and volatility (standard deviation) of the Open Interest data.
* Z-Score Threshold (Default: 2.0)
The critical level that the OI Z-Score must cross to be considered 'extreme' (overstretched leverage).
Funding Rate
* Abnormal FR Threshold (Default: 0.03)
The absolute percentage value (e.g., 0.03%) that the Funding Rate must exceed or fall below to trigger an extreme signal dot.
* FR Signal Plot Level (Default: 4.0)
Sets the fixed vertical position (Y-level) on the Z-Score chart where the Funding Rate signal dots will appear. (e.g., 4.0 plots the dot at the Z-Score +-4.0 level).
Disclaimer
This script is for educational and informational purposes only and does not constitute financial advice or investment recommendations. Trading cryptocurrencies involves significant risk and you are solely responsible for your own investment decisions, based on your financial situation, objectives, and risk tolerance. The author assumes no liability for losses arising from the use of this indicator.

5MA+TrendMagic + Disparity + Volume Spikes5MA + TrendMagic + Disparity Scalping + Volume Spikes is an all-in-one trend and momentum indicator designed for fast entries, trend confirmation, and volatility detection.
Main Features
Multiple EMAs (9/21/50/100/200) for trend structure
TrendMagic for dynamic trend direction and stop levels
Ultra Fast Disparity Scalper (EMA disparity + RSI + RVI momentum)
Volume Spike Detection with smart filters (valid highs/lows, candle types, color match, session filter)
Gold Volatility Signals using ATR, Bollinger Bands, HV/RV spread
Clear BUY/SELL markers, overheat filters, and full alert support
This tool helps identify early reversals, confirm major trends, and highlight strong volume-driven turning points.

FOMC Federal Fund Rate Tracker [MHA Finverse]The FOMC Rate Tracker is a comprehensive indicator that visualizes Federal Reserve interest rate decisions and tracks market behavior during FOMC meeting periods. This tool helps traders analyze historical rate changes and anticipate market movements around Federal Open Market Committee announcements.
Key Features:
• Visual FOMC Periods - Automatically highlights each FOMC meeting period with colored boxes spanning from announcement to the next meeting
• Complete Rate Data - Displays actual rates, forecasts, previous rates, and rate differences for every meeting from 2021-2026
• Multiple Color Modes - Choose between cycle colors for visual distinction or rate difference colors (green for hikes, red for cuts, gray for holds)
• Smart Filtering - Filter periods by rate hikes only, cuts only, no change, or surprise moves to focus on specific market conditions
• Performance Metrics - Track average returns during rate hikes, cuts, and holds to identify historical patterns
• Volatility Analysis - Measure and compare price volatility across different FOMC periods
• Statistical Dashboard - View total hikes, cuts, holds, surprises, and longest hold streaks at a glance
• Built-in Alerts - Get notified 1 day before FOMC meetings, on meeting day, or when rates change
How It Works:
The indicator divides your chart into distinct periods between FOMC meetings, with each period showing a labeled box containing the meeting date, actual rate, forecast, previous rate, and rate difference. Future meetings are marked as "UPCOMING" to help you prepare for scheduled announcements.
Use Cases:
- Analyze how markets typically react to rate hikes vs. cuts
- Identify volatility patterns around FOMC announcements
- Backtest strategies based on monetary policy cycles
- Plan trades around upcoming Federal Reserve meetings
- Study the impact of surprise rate decisions on price action
Customization Options:
- Adjustable box transparency and outlines
- Customizable label sizes and colors
- Toggle individual dashboards on/off
- Filter specific types of rate decisions
- Configure alert preferences
This indicator is ideal for traders who incorporate fundamental analysis and monetary policy into their trading decisions. The historical data provides context for understanding market reactions to Federal Reserve actions.

15 min Trailstop15m High/Low Liquidity Lines (1m) — Indicator Description
15m High/Low Liquidity Lines (1m) is a precision liquidity-mapping tool designed for intraday traders who understand the importance of higher-timeframe liquidity levels while executing on the 1-minute chart.
This indicator automatically detects confirmed 15-minute swing highs and swing lows using pivot logic. When a new 15m high or low forms:
✔ Liquidity Line Generation
A horizontal line is drawn exactly at the price level of the pivot.
The line is anchored to the exact 1-minute candle that produced the 15m high/low, ensuring perfect visual alignment.
The line extends only up to the current bar — not across the whole chart.
Optional text labels (“15m High”, “15m Low”) can be shown at the start of each line.
✔ Auto-Cleanup (Smart Liquidity Sweep Detection)
If price trades through the level, the corresponding line and label are:
Instantly deleted
Marking the level as taken/swept
Allowing the chart to stay clean and focused on active liquidity only
This mimics institutional liquidity logic: once the high or low is violated, the target is considered filled and removed.
✔ Alerts
The indicator includes built-in alerts that fire when:
A new 15m high is confirmed
A new 15m low is confirmed
This allows the trader to react immediately when fresh liquidity levels appear.
✔ Customization Options
You can fully tailor the visual representation:
Turn highs and/or lows on or off
Choose line style (solid, dashed, dotted)
Customize line color and thickness
Customize the label style, size, and transparency
Who Is This For?
This indicator is ideal for:
ICT-style traders
Liquidity-based scalpers
1-minute ES/NQ traders
Anyone who uses HTF liquidity levels to frame trades on the LTF
It provides a clean, automated method to track active 15-minute liquidity levels directly on the 1-minute chart with zero clutter and perfect alignment.

RSI Swing Indicator (Win-Rate + Forecast Line + Range Row)What the script does:
It’s essentially an enhanced RSI tool that doesn’t just show the raw RSI line. Instead, it adds forecasting, trade statistics, and range detection so you can see how reliable RSI signals have been historically and what they might mean going forward.
The main components
RSI Calculation
- Uses your chosen source (close, hl2, etc.) and length (default 7).
- Plots the RSI line (orange).
Forecasting
- Projects RSI into the future using slope extrapolation.
- Plots a forecast line (blue) and shows whether RSI is likely to become overbought, oversold, or stay neutral.
Trade Statistics
- Tracks how many long and short trades would have been profitable based on RSI bias.
- Calculates Win‑Rate (percentage of profitable trades) and Average Return (average gain/loss per trade).
- This gives you a statistical edge: are longs or shorts historically working better?
Bias & Conflict Detection
- Defines current bias (Bullish, Bearish, Neutral).
- Flags Conflict when the forecast disagrees with the current bias (e.g., RSI bullish now but forecast bearish).
- Helps you avoid trading against weakening momentum.
Range Detection
- Checks if RSI slope is flat and values are between mid‑bounds (40–60).
- Calculates Range Probability (how often range conditions occur).
- Adds a Range row to the table so you know when the market is likely sideways instead of trending.
Table Display
- Summarizes everything in a neat table: Forecast, Win‑Rates, Avg Returns, Prob Bias, Conflict, Range Prob, and Range status.
- Color‑coded so you can instantly see what’s favorable (green), risky (red), or neutral (yellow/orange).
How to use it
- Trend trading: Look for Profitable Bias with forecast alignment.
- Range trading: When both win‑rates are weak and Range row says Range Likely, fade extremes (buy low RSI, sell high RSI).
- Risk management: Avoid trades when Conflict is flagged.
- Forecasting: Use the projected RSI to anticipate overbought/oversold zones before they happen.
In short:
The script is like a “smart RSI dashboard”. It takes the basic RSI, adds forecasting, tracks how well past trades worked, and tells you whether the market is trending or ranging. This way, you’re not just reacting to RSI — you’re trading with context, probabilities, and forward‑looking signals.

HTF Candle Overlay – Multi-Timeframe Visualization ToolThis indicator overlays true Higher Timeframe (HTF) candlesticks directly onto any lower timeframe chart, allowing you to see the larger market structure while trading on precise execution timeframes such as 1-minute, 3-minute, or 5-minute.
Instead of constantly switching chart timeframes, you can now see both higher and lower timeframe price action at the same time. Each HTF candle is drawn as a large transparent candlestick with full upper and lower wicks, perfectly aligned in both time and price.
This makes it easy to identify:
- Trend direction from the higher timeframe
- Key support and resistance zones inside each HTF candle
- Liquidity sweeps and rejections across timeframes
- Optimal entries on lower timeframes with higher-timeframe confirmation
Key Features
- Displays true Higher Timeframe candles on any lower timeframe
- Clear transparent candle bodies for unobstructed price visibility
- Full upper and lower wicks
- Non-repainting confirmed candles
- Optional live display of the currently forming HTF candle
- Accurate time-based alignment
- Lightweight and optimized for performance
Who This Indicator Is For
- Scalpers who want higher-timeframe bias
- Day traders using multi-timeframe confirmation
- Smart Money / ICT traders monitoring HTF structure
- Anyone who wants clean multi-timeframe clarity without chart switching
How To Use
- Apply the indicator to any chart.
- Select your preferred Higher Timeframe (HTF) in the settings.
- Use your lower timeframe for entries while respecting HTF structure and direction.
- This tool helps you trade with the bigger picture in view while executing with precision on lower timeframes.

Trinity Ultimate 10 MA Ribbons)I got tired of trying to find a multi MA ribbon that could also color change and allow different types, if it exists then I could not find it... So here it is...
The **Trinity Ultimate 10 MA Ribbon** is a highly customizable, professional-grade moving average ribbon that combines extreme flexibility with beautiful visual feedback. Designed for traders who want full control without sacrificing clarity, it allows you to build a ribbon using up to ten completely independent moving averages — each with its own length, type, color, thickness, and visibility setting — while automatically coloring both the lines and the fills according to bullish or bearish conditions.
### Key Features
- Ten fully independent moving averages that can be mixed and matched exactly as you want.
- Each MA has its own selectable type: EMA (default), SMA, WMA, HMA, RMA, VWMA, or ALMA — perfect for combining fast EMAs with a slow HMA or a classic 200-period SMA.
- Every single MA line automatically changes color in real time: bright green when price is above the MA (bullish) and red when price is below the MA (bearish), making trend strength instantly visible across all timeframes.
- Smart, reactive ribbon fills that appear only between consecutive enabled MAs. Turn any MA on or off and the fills instantly adjust — no gaps, no broken bands, no manual rework.
- Nine layered fills with individually adjustable transparency (default is gradually increasing transparency from the fastest to the slowest MA), creating a smooth, depth-like ribbon effect that looks stunning on any chart background.
- Fill color itself is dynamic: green for bullish candles (close > open) and red for bearish candles, or you can customize both colors to any shade you prefer.
- Full control over every visual element: base colors, line thickness (1–10), lengths, and show/hide toggles for each of the ten MAs.
- Clean and lightweight code that compiles instantly in Pine Script v5 and works on all markets and timeframes without lag.
In short, this is the most flexible and visually informative moving-average ribbon available on TradingView today. Whether you want a classic 9-EMA ribbon, a Guppy-style multiple-timeframe setup, a hybrid EMA/HMA mix, or just three or four key levels, the indicator adapts perfectly while always telling you at a glance where the bulls and bears are in control.
