Trend Classifier [ChartPrime]Trend Classifier
This is a multi-level trend classification tool that detects bullish, bearish, and ranging conditions using an adaptive smoothing method. It highlights trend strength through color-coded candles and layered bands, making it easy to interpret market momentum visually.
⯁ KEY FEATURES
Classifies trend strength using 3 bullish and 3 bearish levels relative to an adaptive trend line.
Neutral (range) zones are marked when price stays between key bands, often signaling low volatility or consolidation.
Automatically filters band visibility based on current trend direction:
In uptrends, only levels below the price are displayed.
In downtrends, only levels above the price are shown.
Color-coded candles:
Aqua candles for bullish conditions.
Red candles for bearish conditions.
Orange candles during neutral or ranging conditions.
Includes a trend direction change marker (diamond), plotted when a shift in trend is detected.
Plots a central smoothed trend line to anchor the trend bands dynamically.
Displays a trend strength dashboard in the top-right corner with real-time bull and bear scores (0 to 3).
Labels with arrows (▲/▼) show current trend direction and strength on the chart.
⯁ HOW TO USE
Use bull and bear levels (1–3) to assess the momentum of the current trend.
When bull = 0 and bear = 0 , market is considered ranging or consolidating – consider fading or waiting for breakout confirmation.
Trend bands can be used as dynamic support/resistance during trending phases.
Monitor the trend change diamonds to spot potential early reversals.
Combine with volume or oscillator tools for confirmation of strength shifts.
⯁ CONCLUSION
Trend Classifier helps traders stay aligned with the dominant trend while visually breaking down market momentum into levels. Its clean color-coded design and strength dashboard make it ideal for both trend following and range trading strategies.
Search in scripts for "trend"

Trend Catcher SwiftEdgeTrend Catcher SwiftEdge
Overview
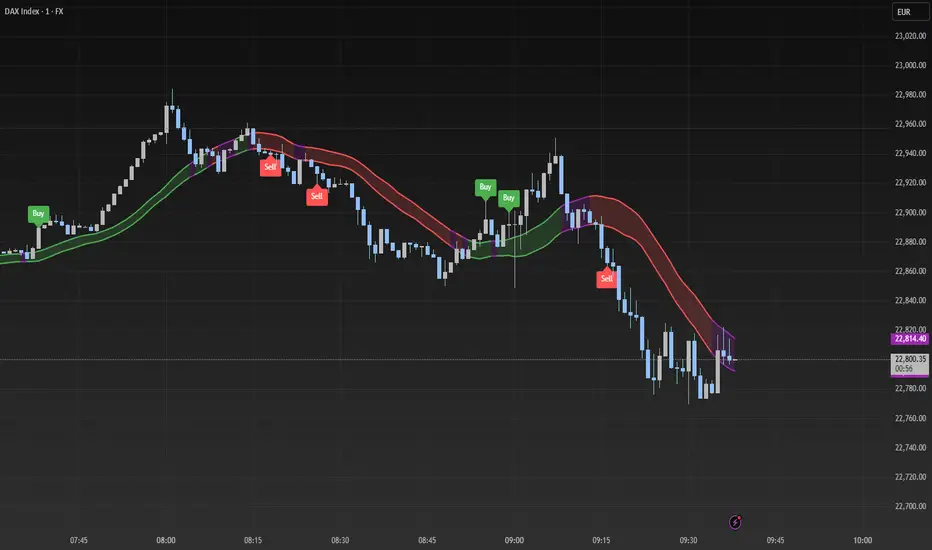
The Trend Catcher SwiftEdge is a simple yet effective tool designed to help traders identify potential trend directions using two Simple Moving Averages (SMAs). It plots two SMAs based on the high and low prices of the chart, visually highlights trend conditions, and provides buy/sell labels to assist with trade entries. This indicator is best used as part of a broader trading strategy and should not be relied upon as a standalone signal generator.
How It Works
Two SMAs: The indicator calculates two SMAs: one based on the lowest price (Low) and one based on the highest price (High) over a user-defined period (default: 20).
Dynamic Colors:
Green: When the price is above both SMAs (indicating a potential uptrend).
Red: When the price is below both SMAs (indicating a potential downtrend).
Purple: When the price is between the SMAs (indicating consolidation).
The SMAs and the background between them change color dynamically to reflect the current trend condition.
Buy/Sell Labels:
A "Buy" label appears when an entire candlestick (including its low) crosses above both SMAs, marking the start of a potential uptrend.
A "Sell" label appears when an entire candlestick (including its high) crosses below both SMAs, marking the start of a potential downtrend.
To reduce noise, only one label is shown per trend direction. The indicator resets when the price enters the consolidation zone (purple), allowing for a new signal when the next trend begins.
Settings
SMA Length: Adjust the period of the SMAs (default: 20). A longer period smooths the SMAs and focuses on larger trends, while a shorter period makes the indicator more sensitive to price changes.
How to Use
Add the indicator to your chart.
Look for "Buy" labels to consider potential long entries during uptrends (green zone).
Look for "Sell" labels to consider potential short entries during downtrends (red zone).
Use the purple consolidation zone to prepare for potential breakouts.
Always combine this indicator with other forms of analysis (e.g., support/resistance, volume, or other indicators) to confirm signals.
Important Notes
This indicator is a tool to assist with identifying trend directions and potential entry points. It does not guarantee profits and should be used as part of a comprehensive trading strategy.
False signals can occur, especially in choppy or ranging markets. Consider using additional filters or confirmations to improve reliability.
Backtest the indicator on your chosen market and timeframe to understand its behavior before using it in live trading.
Feedback
If you have suggestions or feedback, feel free to leave a comment. Happy trading!
Trend Detector [victhoreb]Trend Detector is a streamlined indicator that uses the Pearson correlation coefficient between the average price and time to determine market trends. It measures how closely price movement follows the progression of time over a user-defined period, providing a clear gauge of trend direction on a scale from -1 to 1.
How It Works:
The indicator calculates the correlation between price and time. A positive correlation means that as time advances, the price generally rises—signaling an uptrend. Conversely, a negative correlation indicates that the price tends to fall over time, highlighting a downtrend.
With its simple yet effective approach, Trend Detector offers traders an immediate visual and quantitative insight into prevailing market trends.

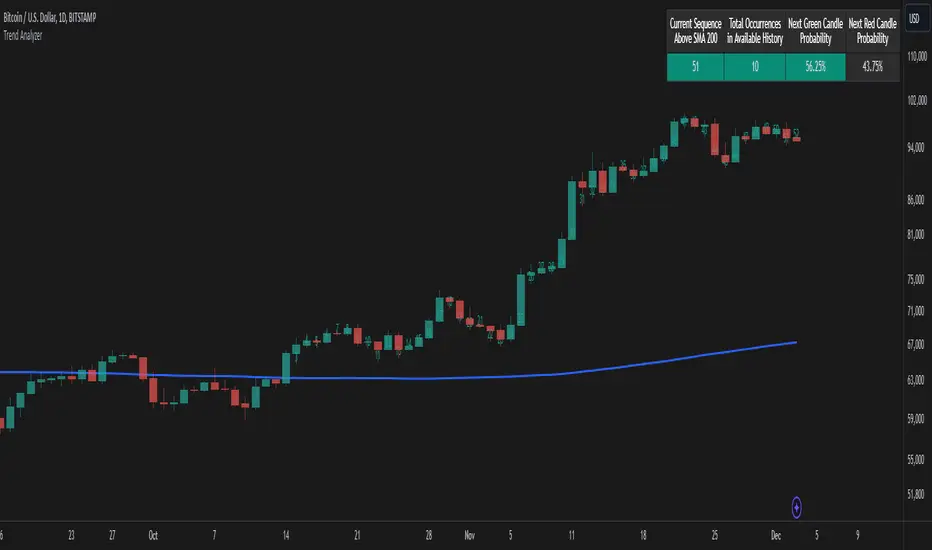
Trend AnalyzerThe Trend Analyzer is designed to help traders identify and analyze market trends. Here's a simple explanation of its logic:
Main Features
Customizable Moving Average: The indicator plots a moving average on the chart. Users can choose from various types (SMA, EMA, WMA, VWMA, HMA, SMMA, TMA) and set the period. This flexibility allows traders to adapt the indicator to different trading styles and timeframes.
Trend Detection: It determines whether the current price is above or below the moving average, providing a clear visual representation of the current trend direction.
Sequence Counter: The indicator counts consecutive candles above or below the moving average. This feature helps traders identify trend strength and persistence, which can be crucial for timing entries and exits.
Statistical Analysis: It calculates probabilities for the next candle's direction based on historical data. This unique feature gives traders a statistical edge in predicting short-term price movements.
Visual Candle Counter: An optional feature that displays the number of consecutive candles above or below the moving average directly on the chart, enhancing visual analysis.
How It Works
The indicator continuously tracks the position of price relative to the chosen moving average.
It maintains a count of how many candles in a row have been above or below the moving average.
For each sequence length, it records historical data on how often the trend continued or reversed in the past.
This historical data is used to calculate probabilities for the next candle's direction, providing a statistical insight into potential price movements.
The indicator displays this information directly on the chart, allowing for quick and easy interpretation.
Practical Applications
Trend Confirmation: Use the indicator to confirm the strength and direction of current trends.
Entry and Exit Signals: The sequence counter and probability calculations can help in timing trades more effectively.
Risk Management: Understanding the statistical likelihood of trend continuation can aid in setting appropriate stop-loss and take-profit levels.
Market Analysis: The indicator provides valuable insights into market behavior and can be used for both short-term and long-term analysis.
While the Trend Analyzer provides valuable insights based on historical data and statistical analysis, it's important to remember that past performance does not guarantee future results. The financial markets are complex and influenced by numerous factors. This indicator should be used as part of a comprehensive trading strategy and not as a sole decision-making tool. Always practice proper risk management and consider seeking advice from financial professionals before making investment decisions.
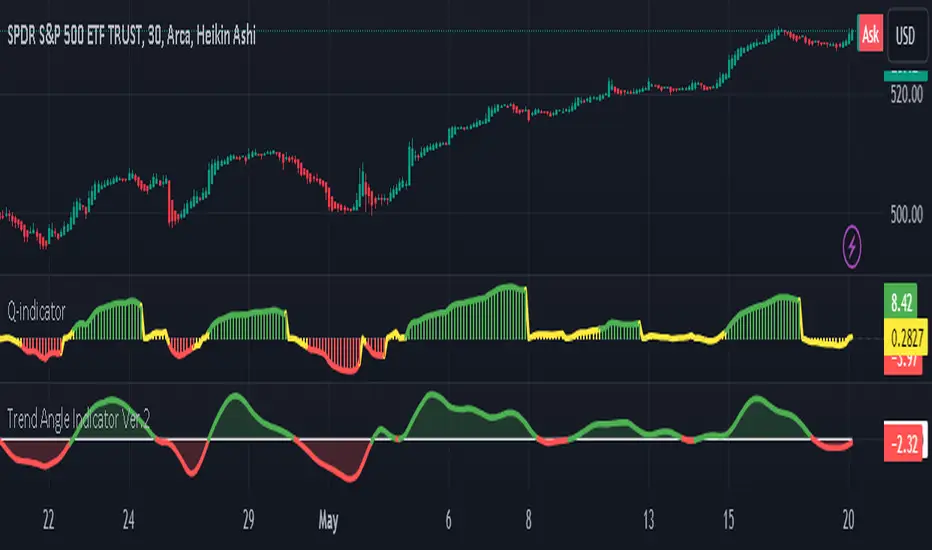
Trend Angle IndicatorTrend Angle Indicator
Description
The Trend Angle Indicator is designed to measure the strength of a trend by calculating the angle of the trend.
Specifically, it computes the angle of a Simple Moving Average (SMA) over a specified length and then applies
an Exponential Moving Average (EMA) to the angle for smoothing.
This approach provides a clear indication of the trend's direction and intensity.
It also includes customizable alerts for significant changes in the trend angle and zero-line crossings,
making it a robust tool for traders seeking to gauge market momentum.
Key Features
- **Trend Angle Calculation**: Measures the trend's angle, providing insights into trend direction and strength.
- **SMA and EMA**: Uses SMA for the base calculation and EMA for smoothening the angle values.
- **Visual Trend Indication**: Visually indicates uptrends and downtrends with customizable colors - red and green.
- **Alerts**: Configurable alerts for significant changes in trend angle and zero-line crossings.
Calculation Methodology
1. **Simple Moving Average (SMA):**
- The script calculates the SMA of the close price over a user-defined `input_length`.
2. **Angle Calculation:**
- The height of the trend is calculated by subtracting the SMA value from the SMA value `input_length` bars ago. A higher angle value indicates a stronger trend.
- The angle in degrees is obtained using the arctangent function: \
3. **Exponential Moving Average (EMA):**
- Applies an EMA to the calculated angle to smooth out the values based on a user-defined `input_ma_length`.
4. **Trend Detection:**
The color of the angle plot and filled area provide a quick visual representation of the current trend direction
- The trend angle changes are monitored and visualized with color-coded plots.
- Uptrend: Angle >= 0 uses `upColor` (green).
- Downtrend: Angle < 0 uses `downColor` (red).
#### Using the Indicator
1. **Adding the Indicator:**
- Add the indicator to your TradingView chart by selecting it from the Pine Script library or by pasting the script into the Pine Script editor.
2. **Inputs:**
- **Length**: Defines the period for the SMA calculation.
- **MA Length**: Sets the period for the EMA smoothing.
- **Angle Change Threshold (degrees)**: Defines the threshold for significant angle change alerts.
- **Color Candles**: Optionally colorizes the price candles based on the angle's trend direction.
3. **Customizing Plots:**
- **Angle Plot**: Displays the EMA of the trend angle. The color changes based on whether the trend is up or down.
- **Zero Line**: A horizontal line at zero to easily visualize crossings that signify a change in trend direction.
- **Fill Color**: Fills the area above/below the zero line with colors representing the direction of the trend.
4. **Setting Alerts:**
- **Cross Above Zero**: Triggers an alert when the trend angle crosses above zero, indicating a potential start of an uptrend.
- **Cross Below Zero**: Triggers an alert when the trend angle crosses below zero, indicating a potential start of a downtrend.
- **Significant Angle Change**: Alerts when the angle change exceeds the user-defined threshold, highlighting significant trend changes.
#### Example Usage
To use and customize the Trend Angle Indicator on your chart:
1. **Add to Chart**: Apply the indicator from the TradingView library or by pasting the script into the Pine Script editor.
2. **Configure Inputs**:
- Adjust the `Length` to set the period for the SMA.
- Set the `MA Length` for the EMA smoothing.
- Define the `Angle Change Threshold` for receiving alerts on significant changes.
3. **Display Customization**:
- Enable `Color Candles` to have the price candles reflect the trend direction.
4. **Set Alerts**:
- Use the alert conditions provided to get notified about critical events like zero line crossings or significant angle changes.
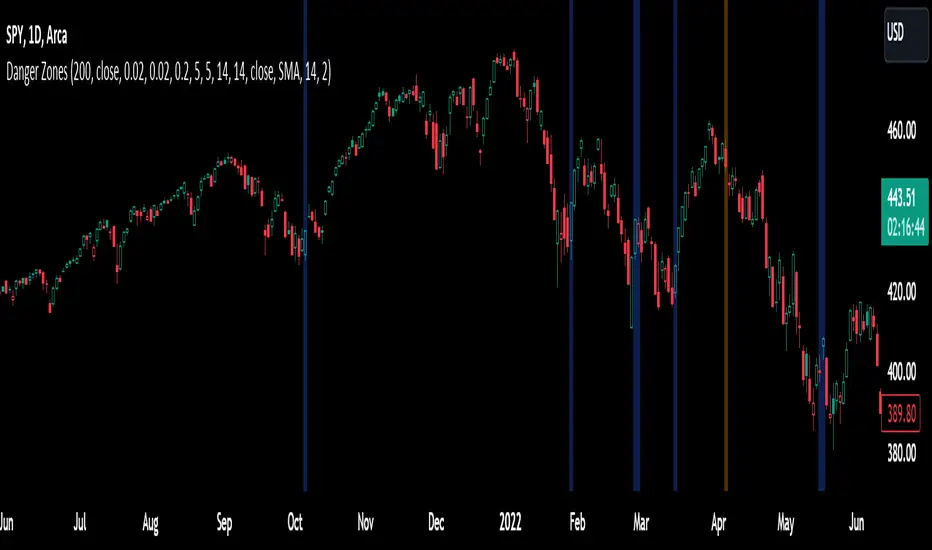
Trend Reversal PredictorTrend Reversal Predictor - An Indicator for Identifying Potential Trend Reversals
This indicator is designed to help traders identify potential trend reversals in the financial markets. It combines multiple criteria including trend identification, volume analysis, average net price movement, and RSI (Relative Strength Index) crossing its moving average to highlight potential danger zones where a trend reversal may occur.
How it Works:
1. Trend Identification: The script uses the Hull Moving Average (HMA) and Parabolic SAR to determine the prevailing trend. The HMA is a smoothing indicator that reduces lag and provides a clear representation of the trend direction.
2. Danger Zone Identification: The script analyzes volume-related metrics and average net price movement to identify potential danger zones where trend reversals might occur. It calculates the rate of change of buying and selling volume and compares it to their respective averages. Additionally, it considers the average net price movement over a specified period.
3. RSI Integration: The script incorporates the RSI, a momentum oscillator, to evaluate overbought and oversold conditions. It calculates the RSI based on user-defined length and source inputs. It also calculates the RSI's moving average using different types of moving averages (SMA, EMA, etc.) specified by the user.
4. Trend Ending Prediction: By combining the conditions of trend identification, volume analysis, average net price movement, and RSI crossing its moving average, the script identifies potential trend reversal points or danger zones. These danger zones are highlighted on the chart using different colors to represent potential uptrend and downtrend reversals.
How to Use:
2. Danger Zone Highlighting: The script highlights potential danger zones on the chart using orange color for uptrend danger zones and blue color for downtrend danger zones. These danger zones suggest areas where a trend reversal may occur.
3. Additional Analysis: Traders can further analyze the danger zones based on their trading strategy and risk management. Consider other technical indicators, price action, and fundamental factors to make informed trading decisions.
Please note that this script provides potential signals for trend reversals but does not guarantee their occurrence. It is important to use this indicator in conjunction with other technical analysis tools and risk management techniques to make well-informed trading decisions.
By understanding the underlying concepts and using the provided visual cues, traders can leverage the Trend Reversal Predictor to potentially identify potential trend reversals in the markets.
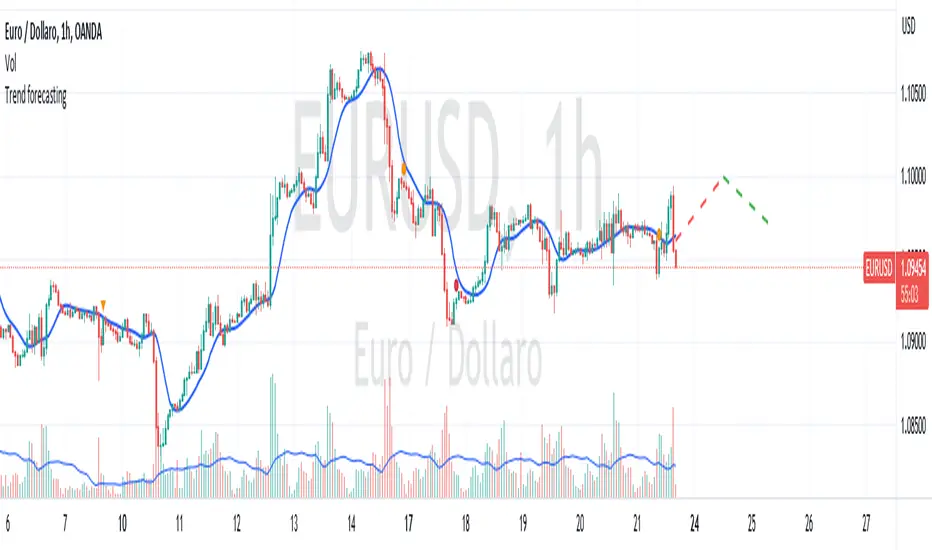
Trend forecasting by c00l75----------- ITALIANO -----------
Questo codice è uno script di previsione del trend creato solo a scopo didattico. Utilizza una media mobile esponenziale (EMA) e una media mobile di Hull (HMA) per calcolare il trend attuale e prevedere il trend futuro. Il codice utilizza anche una regressione lineare per calcolare il trend attuale e un fattore di smorzamento per regolare l’effetto della regressione lineare sulla previsione del trend. Infine il codice disegna due linee tratteggiate per mostrare la previsione del trend per i periodi futuri specificati dall’utente. Se ti piace l'idea mettimi un boost e lascia un commento!
----------- ENGLISH -----------
This code is a trend forecasting script created for educational purposes only. It uses an exponential moving average (EMA) and a Hull moving average (HMA) to calculate the current trend and forecast the future trend. The code also uses a linear regression to calculate the current trend and a damping factor to adjust the effect of the linear regression on the trend prediction. Finally, the code draws two dashed lines to show the trend prediction for future periods specified by the user. If you like the idea please put a boost and leave a comment!
Trend Follow SystemTrend following algorithm:
We take 1- 5 Fibonacci Ema values. 21, 34, 55, 89, 144
2- We normalize the changes of these values over time between 1-100.
3- We take the ema value of 1 length so that it does not follow a horizontal course after the normalization process.
4- In order not to experience too much change, we take the value of sma with a length of 5.
5-We think that when all values are 100, the trend is up, when all values are 0, the trend is down, otherwise the trend is horizontal.

Trend From Volume And Price (TFVAP)Indicator that indicates buying and selling times based on price and volume and who is imposed of the two (VAP).
It uses the trends of the Dow theory (primary: 365 days/1 year, secondary: 90 days/3 months and tertiary: 21 days/3 weeks) and the identification of Elliot waves, both impulse and correction, based on the Fibonacci retracements (23.61% , 38.2%, etc.).
- Purple line is the evolution in percentage of the price in the primary trend
- Blue line is the evolution in percentage of the volume in the primary trend
- White line is the evolution in percentage of the (volume % - price %) in the primary trend, if white line > 0
- Green triangleup is time of start to buy
- Green square is time of stop to buy
- Red triangledown is time of sell
To understand it better:
If the purple line goes up it indicates that the price is rising, if it goes down, that the price is down.
If the blue line is greater than 0 it indicates that there are more purchases than sales, if the blue line is less than 0 it indicates that there are more sales than purchases.
If the white line is greater than 0 there is a high volume of purchases or low sales for the price that there is, it is likely that the price will rise.
If the white line is less than 0 there is a low volume of purchases or high sales for the price that there is, it is likely that the price will go down.
PD: Ignore the chart drawings, the indicator script is only represented at the bottom

Trend Confirmation Indicator - Triple OBVDear all, you might wonder is there a confirmation indicator that has a high hit rate, is dependable, and could rely on the information it gives you when making a decision?
Here I present an indicator I developed specifically for cryptocurrency, in the minds of eliminating fakeouts and traps.
Trend is always invalid then there is a lack of volume, so by tracking the momentum of price direction & volume, we can have a ballpark about where the market is moving to.
On balance volume
obvshort = ema3
obvmedium = ema9
obvlong = ema26
This is a lagging indicator, which means it's not good at predicting reversal.
This is also the reason why
long signal = obvshort > obvmedium and obvshort > obvlong
shortsignal = obvshort < obvmedium and obvshort < obvlong
both without obvmedium >< obvlong
This indicator will not lie to you.
At last
Save Hong Kong, the revolution of our time.

Trend CheckerAn indicator that tell if market is trending or ranging, when the indicator is greater than 0.5 then market is trending, when the indicator is equal to 1 market is overbought/oversold.
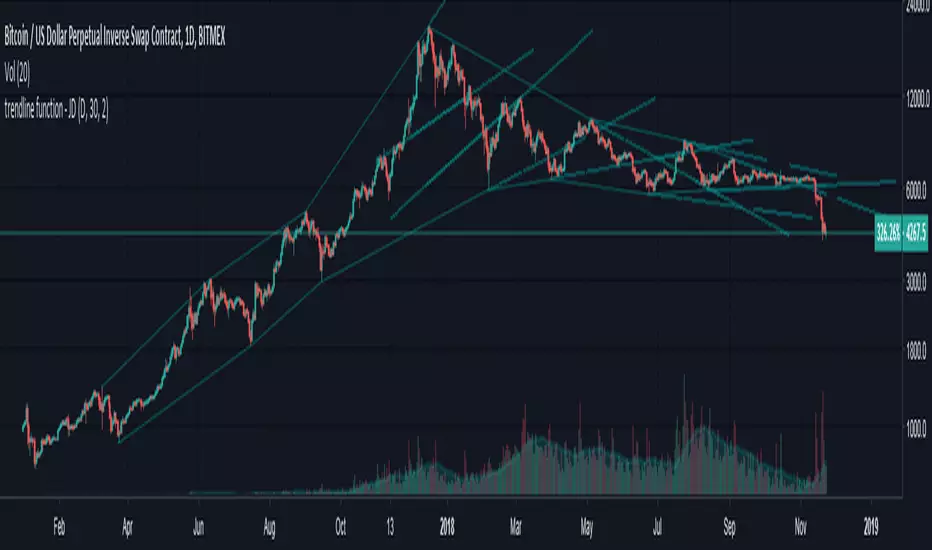
trendline function - JD!EXPERIMENTAL!
As TV doesn't provide a function to draw lines between points, I wrote a function to do this in one my own indicators.
The function itself however can be applied/modified for different use cases, eg. drawing trendlines.
In this (proof of concept) example I used it to draw lines based on past high/low pivot points.
The inputs required:
* an INPUT FUNCTION (in this form, its designed to work with functions that have occasional values and na-values between them, it then connects the non-zero values to form a line)
* a BOOL (to indicate if you want to draw only the rising or falling lines)
* a DELAY (in this case this is the lookback period for the pivot-points function, this is to compensate the calculation of the past and realtime points)
The function returns:
* the function to draw the extension from the BASE-LINE to the current time (here this is the connection of the last pivot-point to the current point to bridge the gap of the lookback period, this is NOT REALTIME!)
* the function to draw the extension for the current time (here this is the continuation of the line until a new pivot-point is valid, this is DRAWN IN REALTIME!!)
* the color of the lines (in this case the lines are only colored (lime or fuchsia) if they either go up or down, else they are invisible, this is to clean up the invalid lines)
these output functions can then simply be plotted using the 'plot' function.
JD.
Trend Detection IndexTrend Detection Index indicator script.
This indicator was originally developed by M.H. Pee (Stocks & Commodities V. 19:10 (54-61): Trend Detection Index).
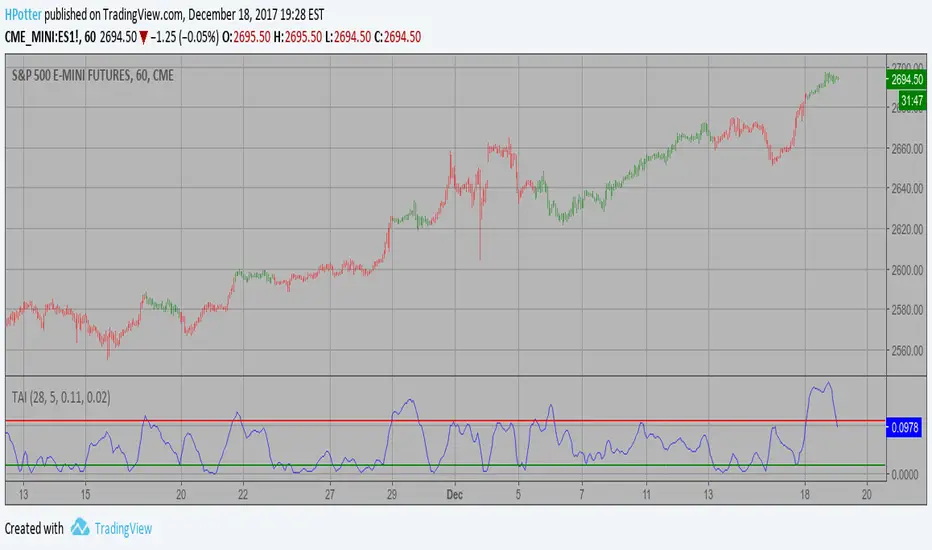
Trend Analysis Index Strategy In essence, it is simply the standard deviation of the last x bars of a
y-bar moving average. Thus, the TAI is a simple trend indicator when prices
trend with authority, the slope of the moving average increases, and when
prices meander in a trendless range, the slope of the moving average decreases.
WARNING:
- This script to change bars colors.
Trend FilterThe indicator paints the bar colours based on the average open and average close for past N days.
if average close is above average open, the bars are coloured green, otherwise they are coloured red
It can be used as a general trend filter on weekly, daily bars. even on intraday timeframes, this would work well and give a sense of the current trend direction.
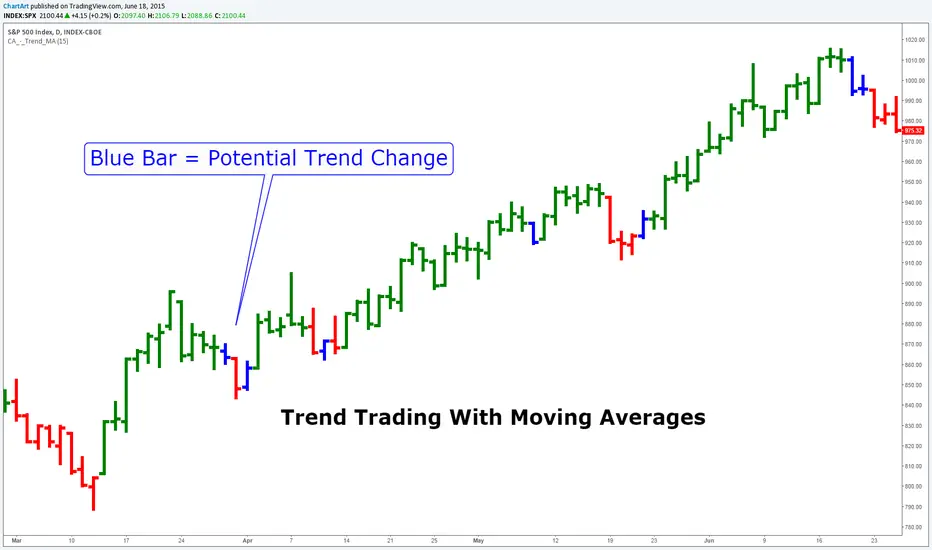
Trend Trading With Moving Averages (by ChartArt)This indicator is measuring if three different moving average calculations (EMA,WMA,SMA) with the same period length are aligned in an uptrend. If this is the case then the bar is colored in green. If only one or two of the three moving averages signals an uptrend then the bar is colored in blue. This can mean that the trend is changing.
Save another $999 bucks with this free indicator.
This is the ChartArt optimized version. Original idea: Steve Primo's Robbery Indicator (PET-D).
coded by UCSgears:
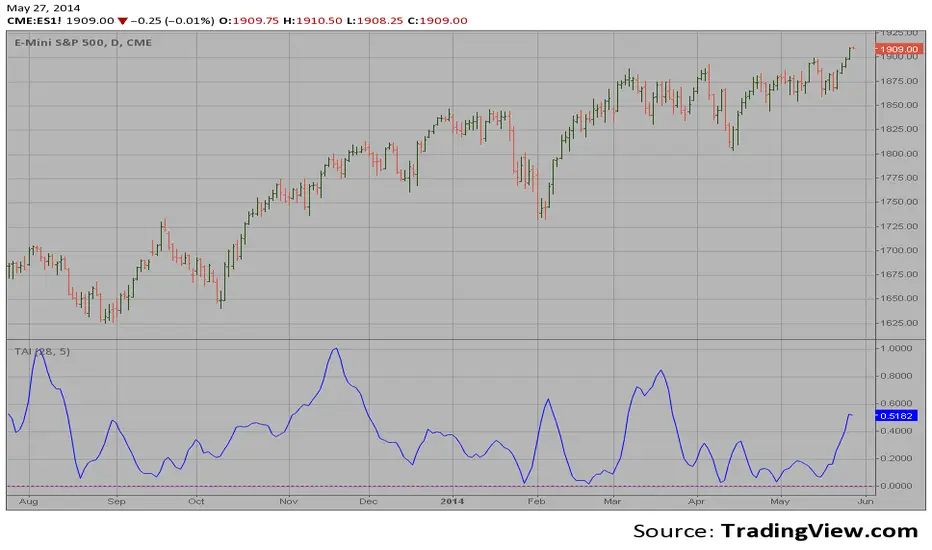
Trend Analysis Index In essence, it is simply the standard deviation of the last x bars of a
y-bar moving average. Thus, the TAI is a simple trend indicator when prices
trend with authority, the slope of the moving average increases, and when
prices meander in a trendless range, the slope of the moving average decreases.
Trend MACD [JopAlgo]Trend MACD — momentum made obvious (4-state histogram)
What it does (one line):
A clean MACD histogram using EMA(fast) − EMA(slow) with a signal line. The columns change color to show trend side and momentum change at a glance.
Green = above 0 and rising → positive trend, momentum building
White (upside) = above 0 but fading → still positive, momentum cooling
White (downside) = below 0 but improving → still negative, momentum recovering
Red = below 0 and falling → negative trend, momentum building down
Zero line = the bull/bear divider. Distance from zero = thrust. Color change = momentum shift.
What you’ll see
Dashed zero line for the trend divider
Column histogram with the 4-state color logic above
No clutter—just momentum and regime, clean
Read it in 3 seconds: Which side of 0? Are bars getting bigger or smaller? Did the color flip?
How to use it (simple playbook)
Direction filter
Look for longs while histogram is ≥ 0.
Look for shorts while histogram is ≤ 0.
Timing
Green sequence (above 0, growing): join pullbacks at real levels.
White above 0: positive but cooling—buy pullbacks only at levels, don’t chase.
White below 0: negative but improving—prepare for reclaim trades at levels.
Red sequence: trend down—sell pops at levels.
Location first (always)
Use Volume Profile v3.2 (VAH/VAL/POC/LVNs) and Anchored VWAP (session/weekly/event).
No level, no trade.
Quality check (optional, strong)
CVDv1 : execute when Alignment OK and no Absorption against your side.
RVOL (if you track it): prefer breakouts with RVOL above cutoff.
Entries, exits, risk (keep it tight)
Continuation long: price retests VAL / AVWAP / MA cluster in an up regime (≥ 0). Histogram stays ≥ 0 and turns green again → enter.
Stop: under structure. Targets: POC/HVNs or next swing.
Break + retest: breakout through a level while histogram flips from white→green above 0 (or white→red below 0 for shorts). Enter on the retest that holds.
Trim / avoid: when bars shrink toward 0 (white) into your target / HVN—momentum is cooling. Don’t chase fresh highs with white bars.
Settings that matter (how to tune)
Fast Length (default 25)
Shorter = quicker turns (more noise). Longer = steadier, slower.
Slow Length (default 200)
Big backbone. For intraday you might use 21/55 or 12/26; for swing the default 25/200 or 20/100 is solid.
Signal Smoothing (default 9)
Higher = smoother, fewer flips. Lower = more reactive.
Source
close is fine; if you use hlc3, expect slightly smoother behavior.
Suggested presets
Scalp (1–5m): 12 / 26 / 9
Intraday (15m–1H): 21 / 55 / 9
Swing (2H–4H): 25 / 100 or 25 / 200 / 9
Daily backdrop: 20 / 100 or 50 / 200 / 9 (execute on lower TF)
Pattern cheat sheet
Green staircase above 0 → trend leg; buy pullbacks to VP/AVWAP.
White above 0 → positive but tiring; avoid chasing; wait for retest.
Flip through 0 with expansion → regime change; use the first retest at a level.
Red staircase below 0 → trend down; sell pops at VP edges.
Diverging price vs shrinking bars → momentum thinning; tighten risk.
Best combos (kept simple)
Volume Profile v3.2: entries at VAH/VAL/LVNs, targets at POC/HVNs.
Anchored VWAP: reclaim/reject with matching histogram side is high-quality timing.
CVDv1: take MACD-aligned setups with flow (ALIGN OK, no Absorption).
RVOL: confirmation that the push has participation.
Common mistakes this helps you avoid
Longs with red momentum or shorts with green momentum.
Chasing new highs on white (cooling) bars.
Trading mid-range when histogram keeps whipsawing around 0 (do less; wait for level).
Disclaimer:
This indicator is an educational tool, not financial advice. Markets are risky; you can lose money. Always test your settings, trade at defined levels, and use risk management. Data/feeds vary across venues; outcomes may differ. No guarantees or warranties are provided.

Trend-Strong Candle - 3 EMAs with Filters# Trend-Strong Candle - Professional Trading Indicator
## 📊 What It Does
Identifies high-probability entries by combining triple EMA trend analysis with strong candle detection. Only signals when all conditions align for maximum accuracy.
## 🎯 Core Features
- Triple EMA System: Fast (20) / Medium (50) / Slow (200) for trend confirmation
- Strong Candle Filter: ATR-based sizing ensures genuine momentum
- Advanced Filters: EMA close validation + trend stability checks
- Live Alerts: Instant notifications for real-time signals
- Session Filter: Trade only during active EU/US market hours
## ⚡ Quick Setup
Scalping (1-5min): Default settings + enable session filter
Day Trading (15-60min): Default settings work perfectly
Swing Trading (4H+): Increase ATR multiplier to 0.8-1.0
## 📈 Trading Rules
Long Signals: Green triangle below candle
- Strong bullish candle during confirmed uptrend
- All EMAs properly aligned (Fast > Medium > Slow)
Short Signals: Red triangle above candle
- Strong bearish candle during confirmed downtrend
- All EMAs properly aligned (Fast < Medium < Slow)
## ⚠️ Critical Success Factors
1. Always Verify the Trend Yourself
The indicator helps identify signals, but YOU must confirm the larger trend context. Check higher timeframes and overall market structure before entering.
2. Understand the "Big Players"
Strong candles in trend direction usually come from institutional money (banks, funds, algorithms). These create the momentum that retail traders can follow. The indicator catches these institutional moves.
3. Distance to Next Value Level
NEVER enter if price is too close to major resistance/support levels:
- Check distance to round numbers (1.1000, 1.1050, etc.)
- Ensure at least 20-30 pips room to next key level
- You need space for profit - tight levels = limited upside
4. Risk Management
- Stop Loss: 1-2 ATR from entry
- Take Profit: 2-3 ATR target (minimum 1:2 R/R)
- Position Size: Risk max 1-2% per trade
## 💡 Pro Tips
- Best Sessions: London open (8-12 UTC) and NY open (13-17 UTC)
- Avoid: Major news, low liquidity periods, choppy markets
- Multiple Timeframes: Confirm signals on higher timeframe
- Value Levels: Always check daily/weekly support/resistance before entering
## 🎯 Success Formula
Trend Confirmation + Strong Institutional Candle + Distance to Value Levels = High Probability Trade
*
Remember: The indicator finds the signals, but successful trading requires your analysis of trend context and value level positioning. Trade smart, not just frequent.

Trend Continuation Filter - 🚀 Trend Continuation Filter — Multi-Factor Overlay
This overlay plots bullish / bearish continuation labels & arrows only when the market has enough confluence behind the move. Think of it as your “trend gatekeeper” — cutting out weak setups and highlighting only those with real momentum + structure.
🔍 Built-in Filters
✔ Ichimoku Cloud → trend bias + Tenkan/Kijun confirmation
✔ MACD (12/26/9) → acceleration via histogram slope
✔ RSI / MFI (14) → momentum quality (≥60 bullish / ≤40 bearish)
✔ ADX (14) → strength check (≥20 and rising)
➕ EMA Alignment (9/21/55/233) (optional)
➕ ATR Slope (14) (optional)
🎯 How it works
✅ Prints a Bull Continuation label/arrow when ≥4 filters align to the upside
✅ Prints a Bear Continuation label/arrow when ≥4 filters align to the downside
⚙️ minChecks input lets you adjust the strictness:
• Normal Days → set to 4 (more frequent, flexible)
• Trend Days → raise to 5–6 (fewer, high-conviction setups)
📈 Best Practices
⏰ Focus on London & New York sessions for clean expectancy
🧩 Pair with a HUD/Dashboard panel to see exactly which filters are active

Trend Display Table (with Change Alerts)📌 Indicator: Trend Display Table (with Change Alerts)
This indicator helps identify trend direction based on a 15-minute 20 SMA compared against a 10 EMA applied to that SMA.
Trend Logic:
Bullish → 20 SMA crosses above 10 EMA (on SMA values)
Bearish → 20 SMA crosses below 10 EMA (on SMA values)
Neutral → No crossover (trend continues from previous state)
Display:
A compact trend table appears on the chart (top-right), showing the current trend with customizable colors, font size, and background.
Alerts:
Alerts are triggered only when the trend changes (from Bullish → Bearish or Bearish → Bullish).
This prevents repeated alerts on every bar.
✅ Useful for:
Confirming higher timeframe trend bias
Filtering trades in choppy markets
Getting notified instantly when the trend flips

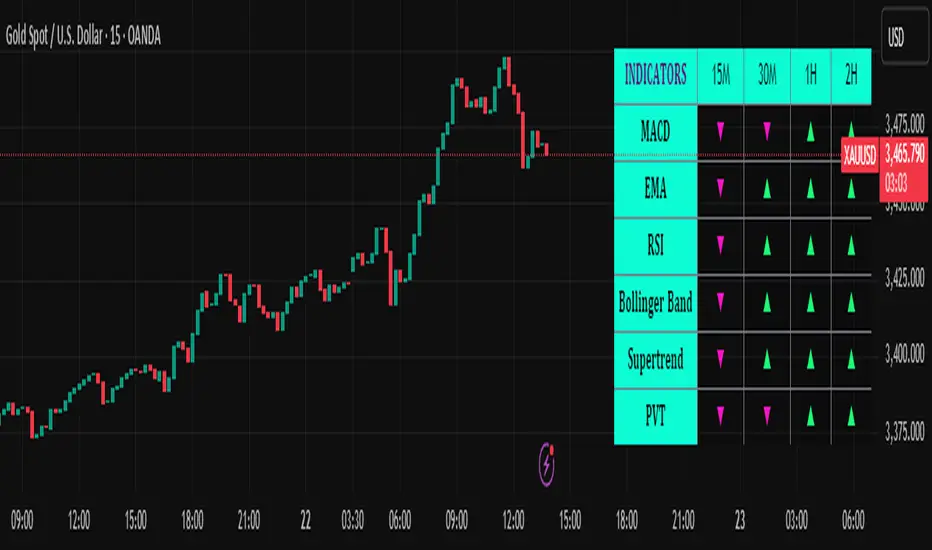
Trend Matrix Multi-Timeframe Dashboard(TechnoBlooms)Trend Matrix Multi-Timeframe Dashboard is a Minimalist Multi-Timeframe Trend Analyzer with Smart Indicator Integration. Trend Matrix MTF Dashboard is a clean, efficient, and visually intuitive trend analyzer built for traders who value simplicity without compromising on technical depth.
This dashboard empowers you to track trend direction across multiple timeframes using a curated set of powerful technical indicators—all from one compact visual panel. The design philosophy is simple: eliminate clutter, highlight trend clarity, and accelerate your decision-making process.
Key Features
✅ Minimalist Design with Maximum Insight
A compact dashboard view designed for clean charts and focused trading
Optimized layout shows everything you need—nothing you don’t
✅ Multi-Timeframe Access at a Glance
Instantly read the trend direction of selected indicators on multiple timeframes (e.g., 15m, 1h, 4h, 1D)
Customize the timeframe stack to fit scalping, intraday, swing, or positional strategies
✅ Robust Technical Indicators Built In
Each one is hand-picked for trend reliability:
MACD – Momentum and crossover confirmation
RSI – Overbought/oversold and directional shift
EMA – Dynamic support/resistance and trend bias
Bollinger Bands – Volatility structure and trend containment
PVT – Volume-Weighted Trend Confirmation
Supertrend – Price-following trend tracker
✅ Live Updates & Lightweight Performance
Built to update efficiently on every bar close
Minimal performance impact even with multiple timeframes active
By offering multi-timeframe (MTF) access to proven trend-following indicators, Trend Matrix helps you confidently align with the market’s dominant direction—without jumping between charts or analyzing indicators one by one.
This indicator offers customizable settings. The trader can choose the input parameters timeframes as per the choice.
Trend Matrix Multi-Timeframe Dashboard helps traders to identify trend based on technical indications. Trader can refer this while taking trading decisions.
🧠 Ideal For
Scalpers who need higher timeframe confirmation
Swing traders identifying clean entries aligned with the macro trend
Trend followers seeking clarity before committing capital
Price action & SMC traders validating market structure setups
Beginners who want a high-level trend guide without messy indicators
Trend Indicator with ArrowsTrend Indicator with arrows is a NoBrainer indicator to see the trend clearly.
UpTrend is defined as a candle closing above previous high. I
DownTrend is defined as a candle closing below previous low
A consolidation is defined as a candle closing inside previous candle high low.
UpTrend - Indicated with a green arrow below the candle with the current indicator.
DownTrend - ndicated with a red arrow above the candle with the current indicator.
So How to use this Indicator?
Identify zones of consolidation where the indicator doesn't show any arrows. Upon shift from consolidation to UpTrend or DownTrend take a entry. This is one way.
Second and most useful way is wait for Support or resistant hit.
If it's a support. Upon support hit wait for Consolidation, DownTrend and then UpTrend/(Consolidation again with uptrend) for long entry.
If its a resistance. Upon resistance hit wait for Consolidation, Uptrend and then DownTrend/(Consolidation again with DownTrend) for short Entry.
