Supply/Demand Zones (Synthetic SMA Candles)Supply/Demand Zones (Synthetic SMA Candles)
Created by The_Forex_Steward
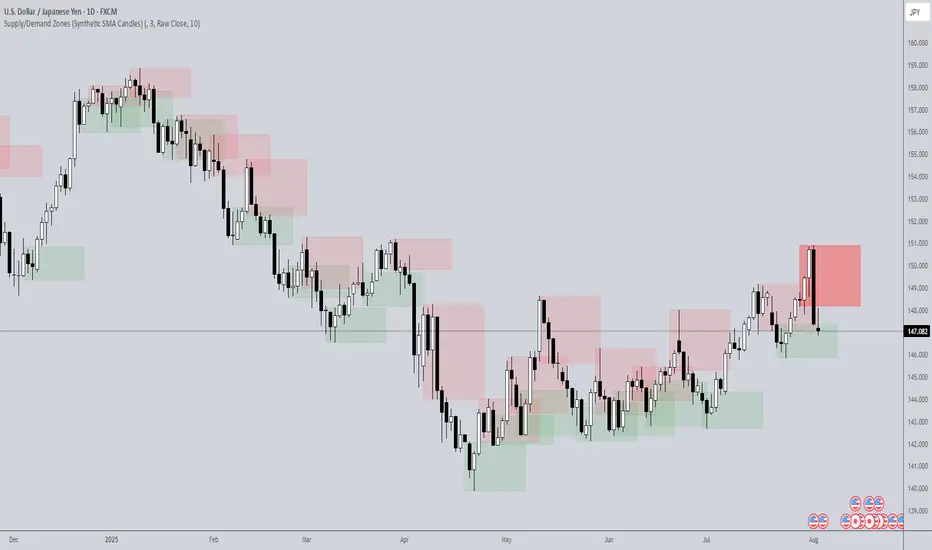
This indicator highlights institutional-style supply and demand zones using synthetic SMA-based candles rather than raw price data. It provides a smoother, more refined view of price action to help identify key imbalance areas where price is likely to react.
Features:
- Uses SMA-smoothed synthetic candles to detect bullish and bearish engulfing structures
- Draws demand zones after bullish breakouts and supply zones after bearish breakouts
- Zones are persistent for a customizable number of bars
- Mitigated zones can optionally be removed from the chart
- Includes alerts for breakout and mitigation events
- Optional plotting of synthetic candles over price for visual clarity
How It Works:
When a synthetic candle closes above the high of a previous bearish candle, a bullish engulfing is detected, and a demand zone is created from that bearish candle’s high and low. Conversely, when price closes below the low of a previous bullish candle, a supply zone is formed. These zones stay on the chart for the user-defined duration or until they are mitigated by price, at which point they can be removed automatically.
How to Use:
- Adjust the SMA Length to control how smooth the synthetic candles appear
- Enable or disable Show Supply Zones and Show Demand Zones as needed
- Set the Zone Duration to control how long each zone persists
- Use Delete Mitigated Zones to automatically remove zones when price returns to them
- Optionally enable Show Synthetic SMA Candles to see the candle logic used in detection
- Use the built-in alerts to stay notified of new zone creation or mitigation
Note: This tool is most effective when combined with structure or trend-based strategies for confirmation.
Search in scripts for "zone"
Mayer Multiple Zones (Crypto)Enhanced Mayer Multiple Zones
Advanced crypto valuation zones with ETH/BTC context
Key Features
Shows 6 price zones based on MA200 multiples (bubble, take profit, fair value, accumulation, value buy, strong buy)
Adds ETH/BTC ratio context for stronger signals
Works on any crypto with sufficient price history ( ETH , SOL , AAVE , etc)
Color intensity changes based on market conditions
How to Read
Color Zones : Price relative to its MA200 history
Zone Opacity : Stronger color = stronger signal (influenced by ETH/BTC context)
Status Box : Shows current "Enhanced Status" combining price level with ETH/BTC context
Context Line : Explains why the signal is strong or weak
Buy/Sell Signals
Strong Buy Signals :
• " EXTREME VALUE " (blue zone + BTC dominance)
• " STRONG VALUE BUY " (cyan zone + BTC preference)
Take Profit Signals :
• " CONFIRMED BUBBLE " (purple zone + altcoin dominance)
• " APPROACHING BUBBLE " (red zone + rising altcoin strength)
Customization
Adjust multiple thresholds (0.6x, 0.8x, 2.0x, 2.5x, 3.0x)
Toggle ETH/BTC context analysis
Configure ETH/BTC thresholds for market bias
Change MA length from default 200
This indicator helps identify optimal entry and exit points by watching the vertical color streaks on your chart. Look for deep blue/cyan zones with high opacity for strong buying opportunities, and intense purple/red zones for potential exits. The darker the color intensity, the stronger the signal—no complex interpretation needed!

Thin Liquidity Zones [PhenLabs]Thin Liquidity Zones with Volume Delta
Our advanced volume analysis tool identifies and visualizes significant liquidity zones using real-time volume delta analysis. This indicator helps traders pinpoint and monitor critical price levels where substantial trading activity occurs, providing precise volume flow measurement through lower timeframe analysis.
The tool works by leveraging the fact that hedge funds, institutions, and other large market participants strategically fill their orders in areas of thin liquidity to minimize slippage and market impact. By detecting these zones, traders gain valuable insights into potential areas of accumulation, distribution, and liquidity traps, allowing for more informed trading decisions.
🔍 Key Features
Real-time volume delta calculation using lower timeframe data
Dynamic zone creation based on volume spikes
Automatic timeframe optimization
Size-filtered zones to avoid noise
Custom delta timeframe scanning
Flexible analysis period selection
📊 Visual Demonstration
💡 How It Works
The indicator continuously scans for high-volume areas where trading activity exceeds the specified threshold (default 6.0x average volume). When detected, it creates zones that display the net volume delta, showing whether buying or selling pressure dominated that price level.
Key zone characteristics:
Size filtering prevents noise from large price swings
Volume delta shows actual buying/selling pressure
Zones automatically expire based on lookback period
Real-time updates as new volume data arrives
⚙️ Settings
Time Settings
Analysis Timeframe: 15M to 1W options
Custom Period: User-defined bar count
Delta Timeframe: Automatic or manual selection
Volume Analysis
Volume Threshold: Minimum spike multiple
Volume MA Length: Averaging period
Maximum Zone Size: Size filter percentage
Display Options
Zone Color: Customizable with transparency
Delta Display: On/Off toggle
Text Position: Left/Center/Right alignment
📌 Tips for Best Results
Adjust volume threshold based on instrument volatility
Monitor zone clusters for potential support/resistance
Consider reducing max zone size in volatile markets
Use in conjunction with price action and other indicators
⚠️ Important Notes
Requires volume data from your data provider
Lower timeframe scanning may impact performance
Maximum 500 zones maintained for optimization
Zone creation is filtered by both volume and size
🔧 Volume Delta Calculation
The indicator uses TradingView’s advanced volume delta calculation, which:
Scans lower timeframe data for precision
Measures actual buying vs selling pressure
Updates in real-time with new data
Provides clear positive/negative flow indication
This tool is ideal for traders focusing on volume analysis and order flow. It helps identify key levels where significant trading activity has occurred and provides insight into the nature of that activity through volume delta analysis.
Note: Performance may vary based on your chart’s timeframe. Adjust settings according to your trading style and the instrument’s characteristics. Past performance is not indicative of future results, DYOR.

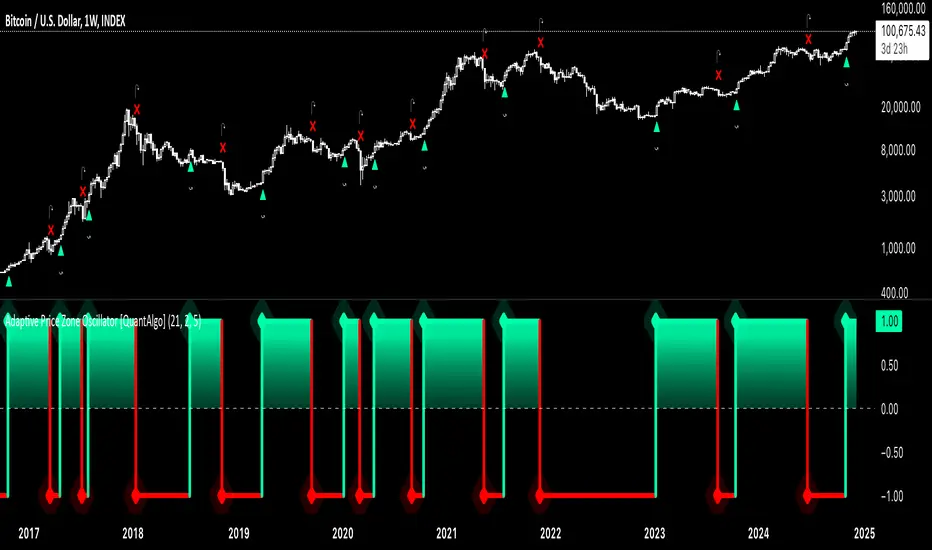
Adaptive Price Zone Oscillator [QuantAlgo]Adaptive Price Zone Oscillator 🎯📊
The Adaptive Price Zone (APZ) Oscillator by QuantAlgo is an advanced technical indicator designed to identify market trends and reversals through adaptive price zones based on volatility-adjusted bands. This sophisticated system combines typical price analysis with dynamic volatility measurements to help traders and investors identify trend direction, potential reversals, and market volatility conditions. By evaluating both price action and volatility together, this tool enables users to make informed trading decisions while adapting to changing market conditions.
💫 Dynamic Zone Architecture
The APZ Oscillator provides a unique framework for assessing market trends through a blend of smoothed typical prices and volatility-based calculations. Unlike traditional oscillators that use fixed parameters, this system incorporates dynamic volatility measurements to adjust sensitivity automatically, helping users determine whether price movements are significant relative to current market conditions. By combining smoothed price trends with adaptive volatility zones, it evaluates both directional movement and market volatility, while the smoothing parameters ensure stable yet responsive signals. This adaptive approach allows users to identify trending conditions while remaining aware of volatility expansions and contractions, enhancing both trend-following and mean-reversion strategies.
📊 Indicator Components & Mechanics
The APZ Oscillator is composed of several technical components that create a dynamic trending system:
Typical Price: Utilizes HLC3 (High, Low, Close average) as a balanced price representation
Volatility Measurement: Computes exponential moving average of price changes to determine dynamic zones
Smoothed Calculations: Applies additional smoothing to reduce noise while maintaining responsiveness
Trend Detection: Evaluates price position relative to adaptive zones to determine market direction
📈 Key Indicators and Features
The APZ Oscillator utilizes typical price with customizable length and threshold parameters to adapt to different trading styles. Volatility calculations are applied to determine zone boundaries, providing context-aware levels for trend identification. The trend detection component evaluates price action relative to the adaptive zones, helping validate trends and identify potential reversals.
The indicator also incorporates multi-layered visualization with:
Color-coded trend representation (bullish/bearish)
Clear trend state indicators (+1/-1)
Mean reversion signals with distinct markers
Gradient fills for better visual clarity
Programmable alerts for trend changes
⚡️ Practical Applications and Examples
✅ Add the Indicator : Add the indicator to your TradingView chart by clicking on the star icon to add it to your favorites ⭐️
👀 Monitor Trend State : Watch the oscillator's position relative to the zero line to identify trend direction and potential reversals. The step-line visualization with diamonds makes trend changes clearly visible.
🎯 Track Signals : Pay attention to the mean reversion markers that appear above and below the price chart:
→ Upward triangles (⤻) signal potential bullish reversals
→ X crosses (↷) indicate potential bearish reversals
🔔 Set Alerts : Configure alerts for trend changes in both bullish and bearish directions, ensuring you can act on significant technical developments promptly.
🌟 Summary and Tips
The Adaptive Price Zone Oscillator by QuantAlgo is a versatile technical tool, designed to support both trend following and mean reversion strategies across different market environments. By combining smoothed typical price analysis with dynamic volatility-based zones, it helps traders and investors identify significant trend changes while measuring market volatility, providing reliable technical signals. The tool's adaptability through customizable length, threshold, and smoothing parameters makes it suitable for various trading timeframes and styles, allowing users to capture opportunities while maintaining awareness of changing market conditions.
Key parameters to optimize for your trading style:
APZ Length: Adjust for more or less sensitivity to price changes
Threshold: Fine-tune the volatility multiplier for wider or narrower zones
Smoothing: Balance noise reduction with signal responsiveness
Swing Failure Zones and Signals [AlgoAlpha]Elevate your trading strategy with the Swing Failure Zones and Signals indicator by AlgoAlpha! This powerful tool helps you identify potential swing failure zones, offering clear bullish and bearish signals to guide your trading decisions. 📈💡
🎨 Bullish/Bearish Color Customization : Easily set the colors for bullish and bearish signals to match your chart preferences.
🧹 Mitigated Zone Removal : Option to remove mitigated zones from the chart for a cleaner view.
🔍 Range High/Low Lookback : Adjustable lookback period for determining significant highs and lows.
🖌 Dynamic Zone Creation : Automatically draws zones based on swing failure criteria.
🔔 Alert Conditions : Set alerts for both bullish and bearish swing failure conditions to stay informed without constant monitoring.
Quick Guide to Using the Swing Failure Zones and Signals Indicator
🛠 Add the Indicator : Search for "Swing Failure Zones and Signals " in TradingView's Indicators & Strategies. Customize settings like lookback period, colors, and zone removal options to fit your trading style.
📊 Market Analysis : Watch for the appearance of the zones and the directional arrows for potential reversal signals. Use these signals to identify key market entries and exits.
🔔 Alerts : Enable alerts for bullish and bearish swing failure conditions to capture trading opportunities without constant chart monitoring.
How it works
The indicator calculates the direction and length of each candle to identify swing failure points by comparing current high and low prices with those from the lookback period. A bullish swing failure is detected when the current low is lower than the previous low and the close is higher than the previous high, while a bearish swing failure occurs when the current high is higher than the previous high and the close is lower than the previous low. Upon detection, the script creates zones on the chart to indicate these failure points and manages them by removing invalidated zones based on the user's settings. Visual signals are plotted on the chart as arrows, and alerts are set for these conditions to help traders capture potential entry opportunities efficiently.
Enhance your trading edge with this robust tool designed to spotlight critical swing failure points in the market! 💪📈

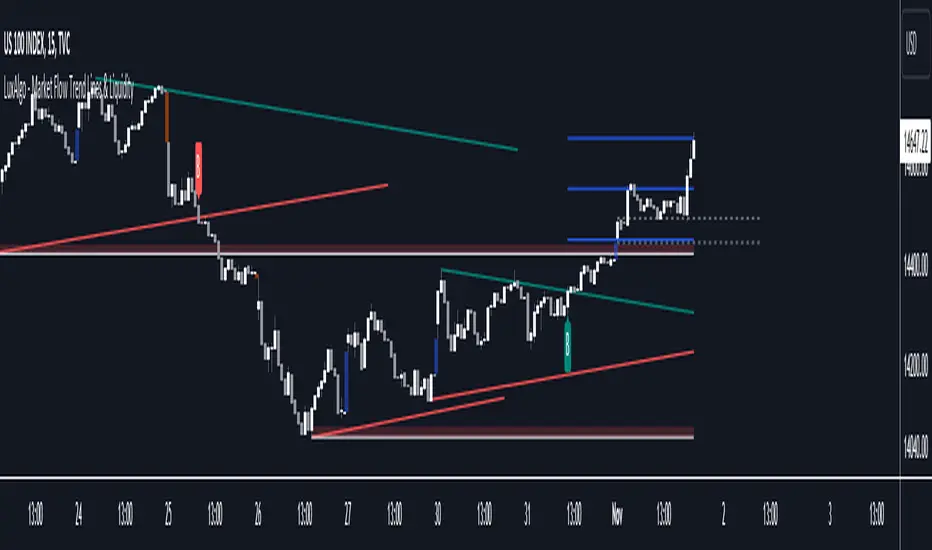
Market Flow Trend Lines & Liquidity [LuxAlgo]The Market Flow Trend Lines & Liquidity indicator is a script that aims to automate key insights such as trend lines, liquidity zones, opening ranges, & gaps on the chart. The aim of this script is to provide a functional breakout trader toolkit with various familiar tools as well as unique capabilities to further improve the user experience.
🔶 USAGE
There are various methods for using the features within this script, even with the included take profit levels users can pre-define.
The dotted lines represent an Opening Range with levels we can use as support & resistance. This opening range can be traded within the levels; however, it can also be used to tell the sentiment of price to see how it reacts to it.
In the image below, we can see after price was holding above the Opening Range whilst printing bullish trendline breakout signals, it made its way to the TP level we enabled from within the indicator to calculate a potential level for taking profits in a breakout trade.
The Market Flow Trend Lines & Liquidity indicator's key feature reside within its multi-timeframe capabilities for the main trendlines, as well as its key zones for potential entries.
In the image above we can see multiple areas where multi-timeframe (1H) trendlines on the 30m chart acted as support & resistance, alongside the Liquidity Zones & Opening Range as optimal points of interest for a breakout trader.
🔶 SETTINGS
🔹 Trendlines
Trendlines Lookback: Determines the frequency of detected tops/bottoms used to construct trendlines.
Slope: Trendlines slope, with higher values returning steeper trendlines.
Timeframe: Trendline timeframe.
🔹 Liquidity Zones
Liquidity Lookback: Determines the frequency of detected tops/bottoms used to construct liquidity zones.
🔹 Take Profits
Take profit settings. Up to 3 ATR based take profits can be enabled, with a numerical setting controlling the ATR multiplier.
🔹 Opening Range
From Time: 15min opening range starting time.
Extend: Extension length of Opening Range lines (in bars).
🔹 Gap Imbalance
Gap Up: Display upward gaps.
Gap Down: Display downward gaps.
🔹 EMA
Show EMA: Displays an EMA on the chart.
EMA Length: Length of the displayed EMA.
🔶 RELATED SCRIPTS
Liquidity Swings
Trendlines with Breaks
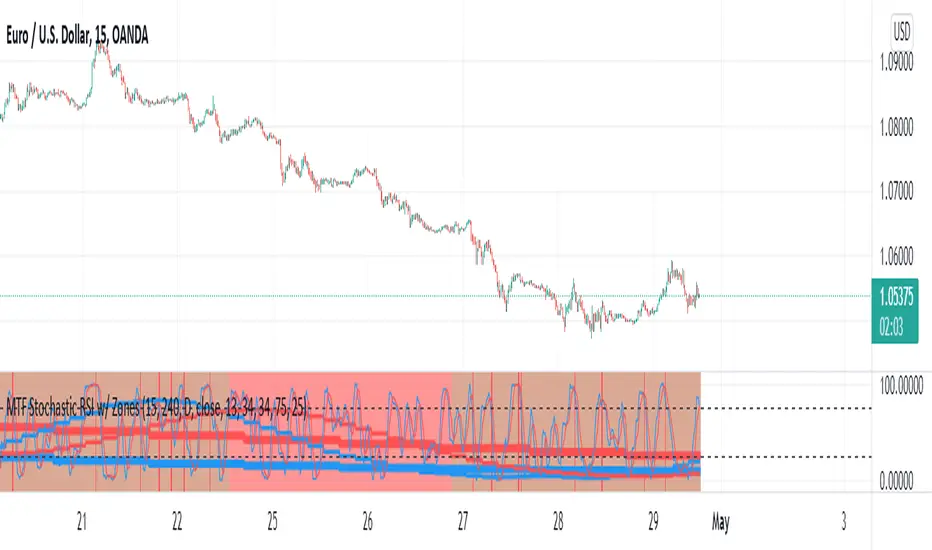
MTF Stochastic RSI w/ ZonesMTF Stochastic RSI w/ Zones by // © KaizenTraderB
I revamped my original Stochastic RSI Band indicator with more accurate algorithms, cleaner coding and more adjustable options.
I will be soon releasing a variation of this indicator that prints over price chart with key candle indicators
This indicator will display the Stochastic RSI in 3 Timeframes of your choice.
It will also display color zones. When the higher timeframe is bullish it will be green and when bullish, red.
When the middle timeframe is counter the higher, it will appear brownish.
The entry timeframe will print red and green lines at bullish and bearish Stochastic RSI crossovers when oversold and overbought, respectively,
In the direction of the higher timeframe directional bias when the middle timeframe is counter that direction to catch reversals in corrections.
The options allow you to turn the lines and zones on and off, as well as which Timeframes you choose to view.
Entry - 1Hr, 15m, 5m Middle Timeframe - 1Hr, 4Hr, Daily Higher Timeframe - 4Hr, Daily, Weekly or Monthly
You can also change the parameters of the Stochastic RSI for each of the three timeframes:
When 8 is chosen for RSI Length, Stochastic Length - 5, SmoothK - 3, Smooth D - 3 For 13 - 8, 5, 5 For 21 - 13, 8, 8 For 34 - 21, 13, 13
Its good practice to adjust settings so Higher Timeframe zones (green/red) correlate with longer trend movements,
Medium Timeframe with corrections and reversal areas (brown) and Entry Timeframe with key reversal candles.
Look at chart for last 200 bars or so and find the settings that correlate with recent past price action and adjust accordingly.
Its also good practice to have the chart timeframe correlate with entry timeframe of indicator.
You can also adjust overbought and oversold areas.
Coding included to prevent repainting
Message me with feedback to improve upon this indicator or requested additions.
Reversal zone finderThis script would find potential reversal price zones according to RSI over bought or sell condition and big reversal candle.
It works better in range markets and lower time frames like 5M and especially in Support/Resistance zones.
Suit for scalping in forex or crypto markets.
* Use it as a trade assistant not a trade signal!

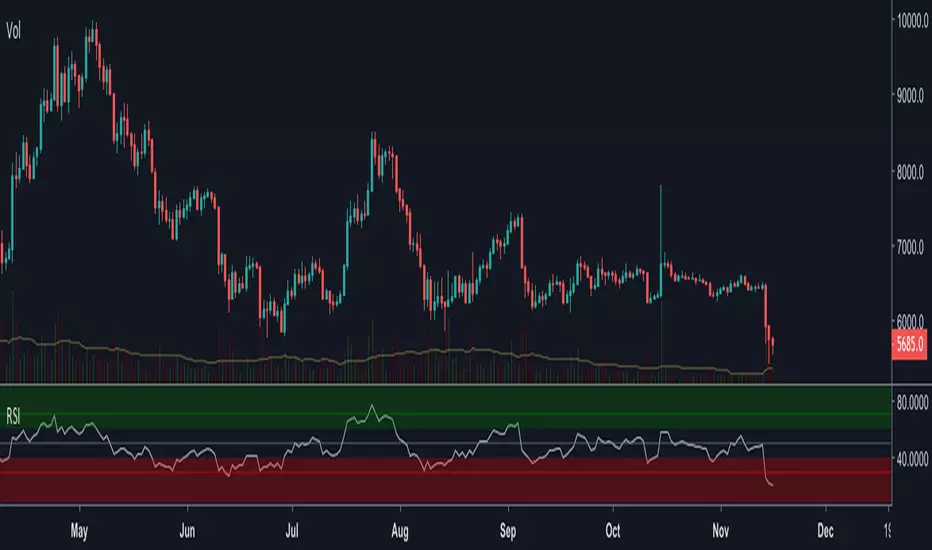
CryptoSignalScanner - OverBought/OverSold Zone IndicatorDESCRIPTION:
This indicator has been designed to do some swing trading on 4 hour and daily candles.
It also gives good results on the lower timeframes 5m, 15m and 1h but trading on those levels is time consuming and stressful.
• This indicator is based on RSI, Stochastic RSI and some other indicator(s).
• This indicator is based on our "CryptoSignalScanner - Advanced BUY/SELL Indicator" but with a small difference in calculation to define the OverBought and OverSold zones.
• It displays the OverBought and OverSold zones.
• It is also possibility to set an OverBought/OverSold, OverBought and OverSold alert.
HOW TO USE:
• When the OverBought zone is displayed it means that the trading pair is OverBought. Wait for the reversal to SELL. Use the Fibonacci tool together with the Eliot Waves Theory to SELL.
• When the OverSold zone is displayed it means that the trading pair is OverSold. Wait for the reversal to BUY. Use the Fibonacci tool together with the Eliot Waves Theory to BUY.
FEATURES:
• You can adjust the OverBought and OverSold zones.
• You can display/hide the RSI.
• You can adjust RSI values.
• You can display/hide the Stochastic RSI.
• You can adjust Stochastic RSI values.
• You can display/hide the ...
• You can adjust the ...
• You can set OverBought/OverSold alert.
• You can set OverBought alert.
• You can set OverSold alert.
• Etc...
REMARKS:
• This advice is NOT financial advice.
• We do not provide personal investment advice and we are not a qualified licensed investment advisor.
• All information found here, including any ideas, opinions, views, predictions, forecasts, commentaries, suggestions, or stock picks, expressed or implied herein, are for informational, entertainment or educational purposes only and should not be construed as personal investment advice.
• We will not and cannot be held liable for any actions you take as a result of anything you read here.
• We only provide this information to help you make a better decision.
• While the information provided is believed to be accurate, it may include errors or inaccuracies.
HOW TO GET ACCESS TO THE SCRIPT:
• Use the link below to subscribe to our indicators.
Good Luck,
SEOCO

PP Dynamic ZonesNSE:BANKNIFTY
So I Came Across the Dynamic Zones Trading System for 20K INR along with Basic course for stock market.
So I decided to Code it. This is only Version 1, I would like this system available for all and also would like to protect the source code for my study purpose and to enhance further versions with Many features like CPR, Automatic Support and resistance area,
Price action range during Market hours and some plans for Version 2 of the indicator for the Trading Community, and I ask for your feedback on anything you find.
What is Dynamic Zones?
Dynamic Zones are nothing but Support and Resistance Zones Calculated from the range of opening price and Close price for past 10 days.
How it will be useful in charts and What time Frame?
Dynamic Zone can be used in all time frame , it will act as support and resistance.
Daily Zone
Wider the Daily zone wider the resistance or support. if Daily Zone are narrow then most of the time it will be trending Day.
Weekly Zone
Weekly Zone is stronger than Daily , When Daily and Weekly Zone overlap Stronger the resistance or Support.
Monthly Zone
Monthly Zone is used when we are working on Swing Trading setup on a Daily Chart than intraday Chart.
Hope you all enjoy this system and get benefited.

Support & Resistance Zones IndicatorThis indicator attempts to detect support and resistance zones dynamically.
How does it work?
The indicator detects the strongest support and resistance zones in a dynamic way and labels as ''kanal''. When ''kanal'' label appears above a candle, you turn the closing price and the highest value of that candle into a zone. When ''kanal'' label appears below a candle, you turn the closing price and the lowest value of that candle into a zone. This way you have support and ressistance zones for future reference. When new zones appear, the indicator may delete the weak ones if necessary. In this way, the indicator guides you to follow not only the support and resistance zones but also the latest trends.
You can use the indicator with Stocks, Indices, Futures, Currencies and Cryptocurrencies.
On settings you can change label's color, size, style and position as you wish.
Use the link below to obtain access to this indicator.

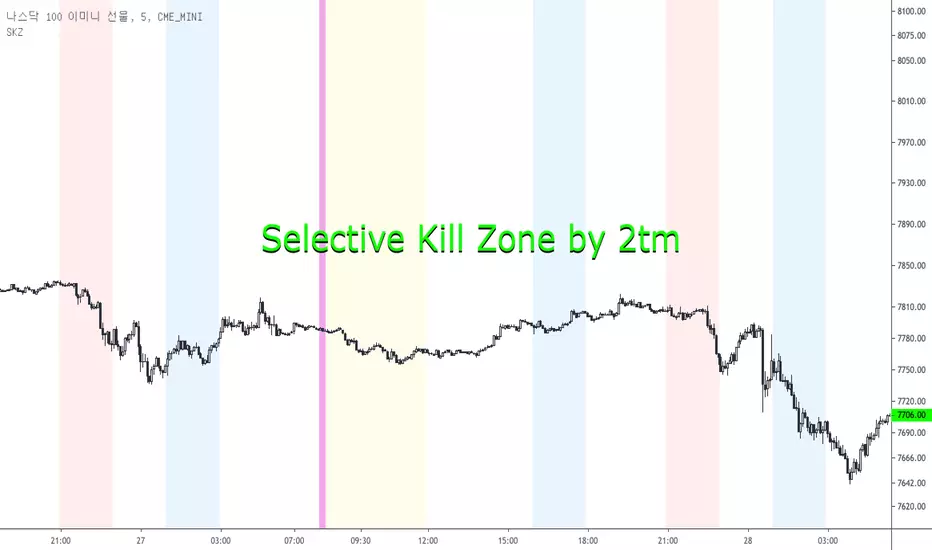
Selective Kill Zones by 2tm1. I think if you know how to use Kill Zone the this is very helpful to you but the Newbies must find out how to use the Kill Zone.
2. I've colored each Time Zone based on Olympic Flag, So the Yellow is Asia KZ, the blue is Europe I mean London and the Red is America for New York KZ.
3. There are Session Opens / Closes and Market Sessions in each Time Zone.
4. If you need adjust for Summer Time, then just click check box.
5. There are some options for the Period, that is a day, 3 days, a week, a month and a year.
6. It shows on weekends, so you can use on the crypto markets also.
7. Thanks and I hope your successful investment.
Support & Resistance Zones [SHK]Support & Resistance Zones clearly draws some useful S\R zones for you.
Important notes:
It's not bulletproof and unmistakable but it may be so useful to get some strong zones. You may get false or missed levels, So always check for other levels.
Always draw the continuation of previous levels by hand. It's a must! I didn't continue the zones to keep your charts clear.
The lagging is zero . Unlike many similar scripts.
Just compare the results to another support and resistance tools :)
Feel free to share your ideas about this script.

RSI ZonedStandard RSI(overbought oversold divergence rules still apply), but with added 60/50/40 lines, with bullish and bearish zone colors. 40(support)-60(resistance) is neutral and probable consolidation. 40(resistance) and below is a probably bearish zone continuation, where as, 60(support) is a probable bullish zone continuation. If the 60/40 are annoying, or anything, go to the indicator editor and reduce the lines transparency, or whatever and save as default .

Levels and Zones • Minimalist TradingThe Levels and Zones is a leading indicator which automatically identifies the best support and resistance levels as well as their corresponding bullish and bearish zones.
The indicator constantly detects and highlights for you the optimum levels and zones where you will find the greatest opportunities to go long or short .
As soon as the market moves to a new level with the Levels and Zones you will be ready to catch the next profitable trade .
The indicator is available via subscription and you can enjoy a free trial . To know more about the indicator and start the trial simply visit the link below.
➡ Try the indicator

Footprint Imbalance Reversal ZonesThe script detects blowouts and displays buy and sell volume as levels.
Green lines = bullish zones (potential support / buying pressure)
Red lines = bearish zones (potential resistance / selling pressure)
---------------
Trade ideas:
---------------
Price approaching a green zone → potential bounce/support.
Price approaching a red zone → potential rejection/resistance.
Combine with other indicators or price action for confirmation.
-----------------
Configuration
-----------------
Inputs:
Imbalance Threshold (%) → higher = only very strong imbalances trigger zones
Bars to form cluster → number of consecutive imbalance bars needed
Zone Extend Bars → how far each zone line extends into the future
Minimum bar volume → ignore low-volume bars for cleaner zones
Use tick-rule volume estimate → leave true if no real bid/ask data
Max saved zones → max number of zones stored (oldest removed if exceeded)
------
Tips
------
Best used on intraday or short-term charts where volume imbalances are meaningful.
Adjust Minimum bar volume to filter out low-volume noise.
Combine with candlestick patterns, RSI, or moving averages for higher-probability trades.
For long-term charts, consider increasing Bars to form cluster to capture stronger levels.
Combine with price action, candlestick patterns, or other indicators for better trade signals.

Sniper ZonesThe indicator evaluates the relationship between price expansion and compression within daily ranges. Based on these dynamics, it derives upper and lower threshold zones that often behave as supply or demand areas.
These thresholds act as “reaction pockets” where price has a tendency to slow, reverse, or accelerate depending on how it interacts with the levels.
No future data or repainting methods are used; the zones come from completed timeframe evaluations and remain fixed once established for that particular trading session
📌 How Traders Can Use It
Reversal Trading:
When price approaches a marked zone, traders can monitor for rejection signals or momentum fade.
Breakout & Continuation:
If a zone is broken with strength, it often suggests continuation in that direction. The broken zone can then act as a flip level.
Risk Management:
Zones may serve as potential stop-loss areas or context for target placement.
Bias Confirmation:
Zones help traders decide whether market structure is leaning toward exhaustion or expansion.
📌 What Makes This Indicator Valuable
While many supply/demand tools rely on pattern detection or candle shapes, this indicator uses a structured, rule-based approach grounded in range evaluation and volatility footprinting. The zones are clean, stable, and designed for professional reaction-based trading rather than subjective drawing.
This works best of Indices which are Nifty, Banknifty, Finnifty and also works for Indian Stocks. This is for Intraday and Scalpers.

Powerful Zone Detector (V19 - Hibrit)With the Powerful Zone Detector, you can easily identify support and resistance zones close to the price zone.

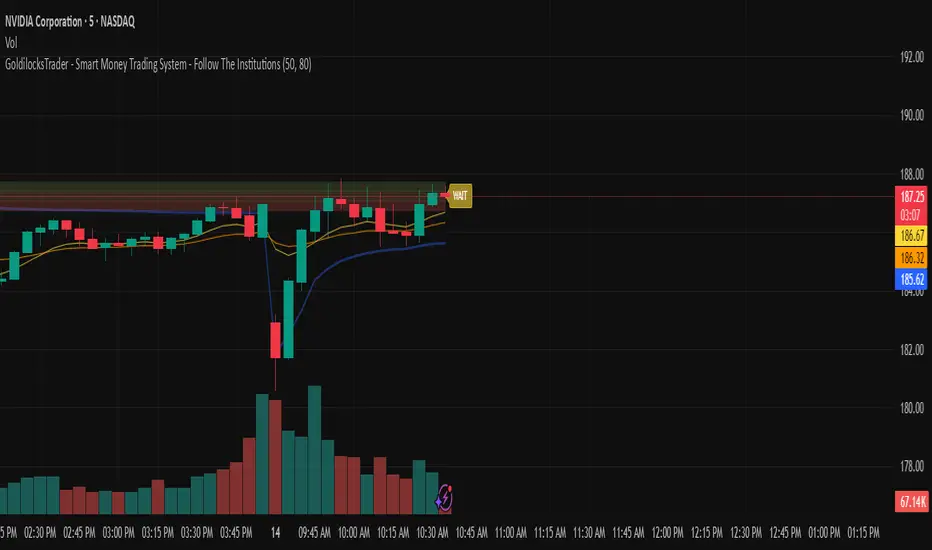
GoldilocksTrader – Institutional Zones + Smart Money Market ModeThe GoldilocksTrader – Smart Money Trading System is a powerful institutional-grade tool designed for traders who want to follow real liquidity, identify institutional zones, and accurately read Smart Money market structure.
This indicator automatically detects Supply & Demand Zones, plots Institutional Pivot Levels, builds dynamic fade-strength heatmaps, and labels the current Market Mode (ACCUMULATE, DISTRIBUTE, WAIT)—all powered by a clean, real-time algorithm that updates with every candle.
This system helps you understand where banks, hedge funds, and institutions are likely to defend price, accumulate positions, or engineer liquidity sweeps. It makes complex Smart Money concepts simple, visual, and trader-friendly.
🧠 Core Features
✔ Institutional Supply & Demand Zones (auto-detected from swing pivots)
✔ Smart Money fade-strength heatmap using multi-layered boxes
✔ Market Mode Detection:
• ACCUMULATE – Smart Money loading long positions
• DISTRIBUTE – Smart Money unloading into premium levels
• WAIT – Neutral / imbalance zones
✔ EMA 9/21 Trend Filters
✔ VWAP Institutional Bias Filter
✔ Nearest Above/Below Liquidity Zones with clean readability
✔ Adjustable Transparency & Zone Thickness
✔ Compact On-Chart Legend (optional)
✔ Extremely lightweight, low-lag, optimized for all markets/timeframes
✔ Works for Forex, Crypto, Stocks, Indices, Futures, Commodities
📈 Trading Concepts Covered
This indicator is built around world-class concepts used by top proprietary desks and Smart Money traders, including:
ICT (Inner Circle Trader) Supply/Demand
Liquidity Zones & Institutional Order Blocks
Wyckoff Accumulation / Distribution
Imbalance & Fair Value Behavior (FVG-style fades)
Market Maker Models (MMXM + Premium/Discount Zones)
Pivot-based liquidity mapping
VWAP Institutional Bias
Trend Continuation vs. Reversal Zones
If you trade SMC, ICT, Wyckoff, Smart Money, Algo-based models, or institutional liquidity, this indicator is a perfect companion.
🚀 How It Helps You Trade
🔹 Identify hidden institutional levels where real accumulation or distribution occurs
🔹 Avoid bad trades by staying out of “WAIT” zones where most of the retail market enters.
🔹 Time entries during premium vs. discount pricing
🔹 Understand where price is expected to react, reverse, or continue
🔹 Visualize institutional pressure with fade-strength heatmaps
🔹 Combine with your own strategy to increase precision and confidence
🎨 Clean, Professional Visualization
Zones auto-extend to the left for historical context
Fade opacity increases or decreases depending on zone strength
Market Mode label plotted dynamically near relevant price zones
Optional compact legend for fast reading
All elements can be toggled and customized to your style.
⭐ Created by GoldilocksTrader™
For more institutional-level tools—including the new and soon to be popular "GoldilocksTrader Buy-Sell Signals with Built-In Optimizer"—search:
👉 “GoldilocksTrader” on TradingView
👉 Visit GoldilocksTrader.com for premium systems & education
Follow the institutions.
Trade Smart.
Trade Goldilocks™..."it's just right"
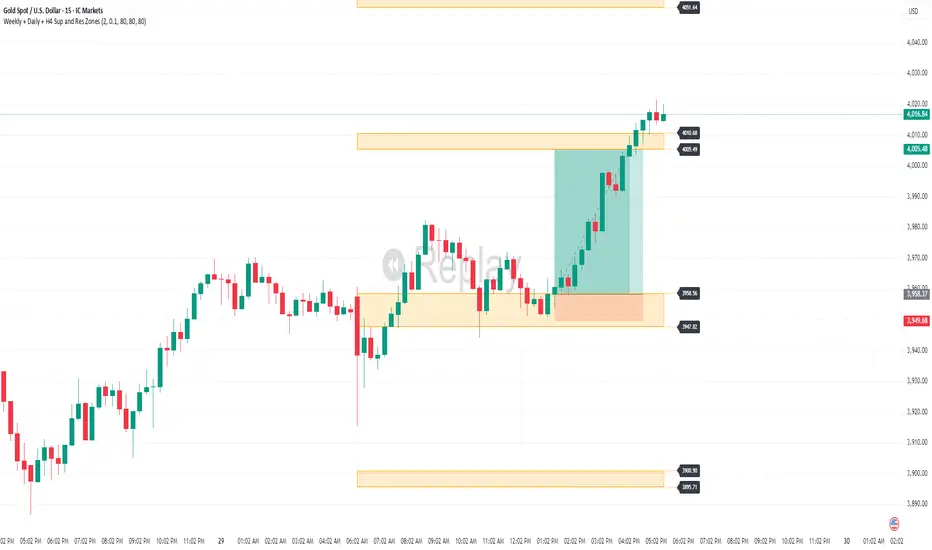
Weekly + Daily + H4 Sup and Res ZonesEveryday price move at a set range. Just wait at the zone for candle reversal/continuation pattern formation before entry. Always keep it simple. Patience is key. Just Pick your preferred tf zone. Daily zone highly recommended for less than 100 pips target. H4 for scalpers and Weekly for swingers.
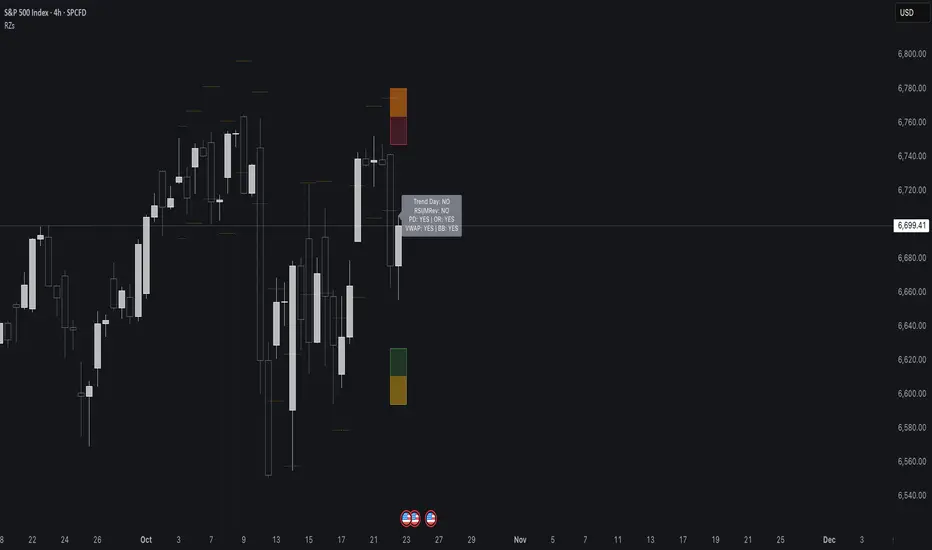
Reversal Zones// This indicator identifies likely reversal zones above and below current price by aggregating multiple technical signals:
// • Prior Day High/Low
// • Opening Range (9:30–10:00)
// • VWAP ±2 standard deviations
// • 60‑minute Bollinger Bands
// It draws shaded boxes for each base level, then computes a single upper/lower reversal zone (closest level from combined signals),
// with configurable zone width based on the expected move (EM). Within those reversal zones, it highlights an inner “strike zone”
// (percentage of the box) to suggest optimal short-option strikes for credit spreads or iron condors.
// Additional features:
// • Optional Expected Move lines from the RTH open
// • 15‑minute RSI/Mean‑Reversion and Trend‑Day confluence flags displayed in a dashboard
// • Toggles to include/exclude each signal and adjust styling
// How to use:
// 1. Adjust inputs to select which levels to include and set the expected move parameters.
// 2. Reversal boxes (red above, green below) show zones where price is most likely to reverse.
// 3. Inner strike zones (darker shading) guide optimal short-strike placement.
// 4. Dashboard confirms whether mean-reversion or trend-day conditions are active.
// Customize colors and visibility in the settings panel. Enjoy disciplined, confluence-based trade entries!
Gap ZonesThis TradingView indicator automatically detects daily price gaps and plots them clearly on any timeframe (intraday or daily).
It helps visualize where unfilled gaps are sitting, track whether they’ve been filled, and control how far the zone extends.
Key Features
1. Daily Gap Detection
• Works even when you’re on intraday charts (uses daily OHLC data).
• Marks both gap up (potential support zones) and gap down (potential resistance zones).
2. Shaded Gap Zones
• Each gap is highlighted as a band (greenish for up, reddish for down).
• Option to turn shading off if you just want horizontal lines.
3. Hide When Filled
• Once price closes or touches the far side of the gap, it disappears (configurable: Touch vs Close).
4. Lookback Window
• Gaps only show if they occurred within the past X trading days (default: 30).
• Prevents your chart from being cluttered with ancient gaps.
5. Multiple Gaps Tracked
• Can track up to 5 recent gaps simultaneously.
• Oldest gaps “roll off” as new ones form.
6. Finite Right-Edge Guides
• Optional horizontal guide lines extend to the right, but only for a fixed number of bars (default: 50).
• Cleaner than infinite extensions.
7. Gap-Day Marker
• Optional vertical line drawn on the bar where the gap first occurred.
⸻
⚙️ Inputs & Settings
When you apply the indicator, you’ll see these options:
• Lookback (trading days): How far back to scan for gaps (default 30).
• Max gaps to show (1..5): How many simultaneous gap zones to display.
• Min gap size (% of prior close): Filter out tiny gaps (default 0.25%).
• Hide gaps once filled: Removes a gap from the chart once filled.
• Fill rule uses CLOSE (off = Touch):
• Touch = filled when price trades through the level intraday.
• Close = filled only when a candle close crosses it.
• Show shading: Toggle zone fills on/off.
• Show vertical marker on gap day: Toggle gap-day marker line.
• Show finite right-edge lines: Toggle horizontal lines extending right.
• Right line length (bars): How far those lines extend (default 50 bars).
⸻
🟢 How to Use It
1. Apply on Any Chart
• Works best on daily or intraday (5m, 15m, 1h).
• Gaps are always calculated from daily data, so intraday charts will show higher-timeframe gaps correctly.
2. Interpret Colors
• Green shading = Gap Up (often acts as support).
• Red shading = Gap Down (often acts as resistance).
3. Watch for Fills
• When price re-enters the gap zone, the indicator checks if it’s “filled” (based on your Touch/Close setting).
• If “Hide When Filled” is on, the zone vanishes.
4. Trade Context
• Many traders use gaps as targets (expecting a fill) or levels of support/resistance.
• Combined with your bull put/bear call spread strategies, it helps confirm strong levels.
