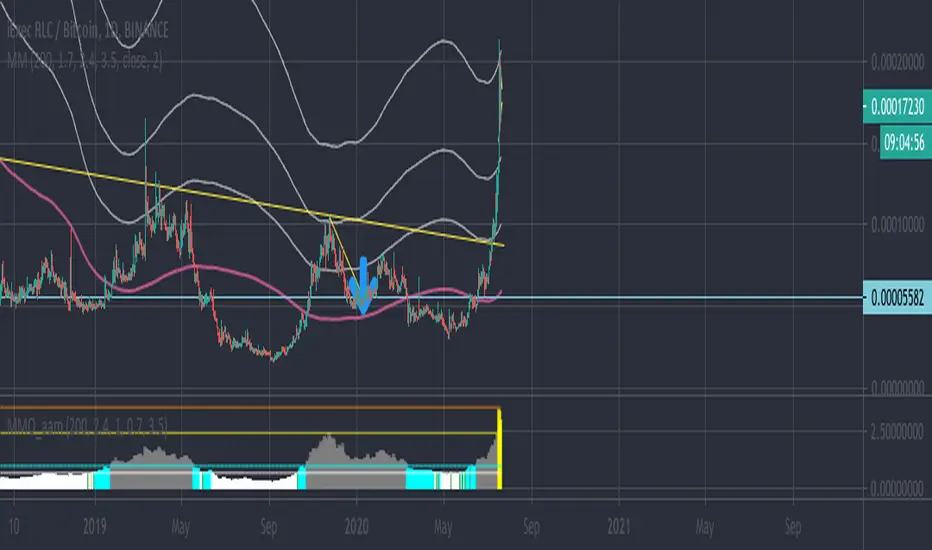
Mayer MultiplesScript that plots the 200 Moving average, and several Mayer Multiple levels in the chart. This may help guestimate TP levels
Simple Moving Average (SMA)
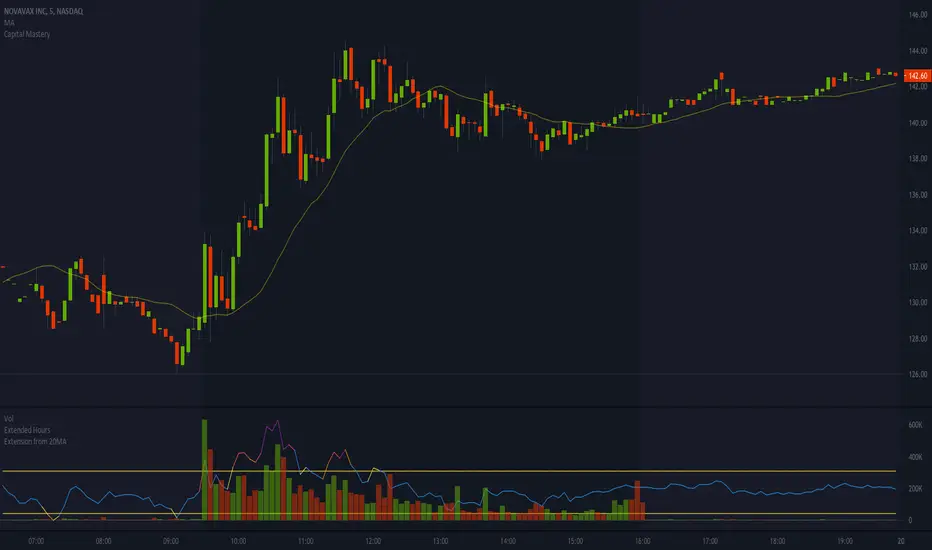
Extension from 20 Period Simple Moving AverageSimple indicator to help show when stocks are over extended intraday. It's based on the distance between a stock and it's moving average. The thesis being that, the farther away a stock is from it's 20 period simple moving average, the move extended it is. I've found that when a stock is more than 2-3% extended from it's 5min 20 period moving average, it's typically getting over extended, and can be a great time to start considering a short.
I primarily use this indicator when shorting intraday parabolic moves, while the stock is still on the frontside of the move. Note that this works best when the indicator is showing overextended AND there's a volume spike/mountain matching the overextension. In the attached example, you can see that I overlay this indicator on top of the volume panel because it helps me better visualize when the stock is getting over extended on heavy/elevated volume.
Hope this helps; any feedback is appreciated!
P.S. This works best on a 5min chart, but I'm sure it could be helpful on other timeframes, but may need to tweak the default outer bounds percentage.

Performance ComparatorThis indicator allows to compare the performance (% change) of a given symbol with the larger market ( AMEX:SPY ) and/or with a custom symbol, which defaults to AMEX:XLK (an ETF tracking technology companies from the S&P 500).
The performance for the current symbol is displayed as a blue histogram, while performance for the AMEX:SPY and the custom symbol are respectively displayed as orange and white lines, making it easy to spot when the symbol outperformed the market.
Features:
Configurable time resolution (default: same as chart)
Comparison using change percentage or its EMA/WMA/SMA (default: EMA)
Configurable moving average length
Optionally hide AMEX:SPY or the custom symbol from the chart

SIMPLE MOVING AVG 10,20,50,100,200 with RESOLUTIONThis indicator is the best than all other sma indicators.Because in just one click you can change all the resolution /time frames for all the sma .
Multitime frame analysis can be done in just one click. just change the resolution to
15 min/30 min/1hr- if you intraday trader
1D- LONG TERM INVESTORS.
Multi-timeframe analysis (MTF) is a process in which traders can view the same ticker/indicator using a higher time frame than the chart’s, for example, displaying a daily moving average on a one-hour chart in just two clicks.
How to Use this to Buy Stocks ?
The technical indicator known as the Death cross occurs when the 50-day SMA crosses below the 200-day SMA => Bearish Signal.
An opposite indicator, known as the Golden cross, occurs when the 50-day SMA crosses above the 200-day SMA => Bullish Signal.
Crossovers are one of the main moving average strategies.
1st Strategy is the first type is a price crossover, which is when the price crosses above the sma => Buy signal
when the price crosses below the sma => Sell signal
2nd Strategy is to apply two moving averages to a chart: one longer and one shorter.
When the shorter-term MA (100) crosses above the longer-term MA (200), it's a buy signal, indicates trend is shifting up.
This is known as a "Golden cross."
Meanwhile, when the shorter-term MA (100) crosses below the longer-term MA (200), it's a sell signal, indicates trend is shifting down.
This is known as a "Dead/death cross."
The time frame or length you choose for a moving average, also called the "look back period," can play a big role in how effective it is.
An MA with a short time frame will react much quicker to price changes than an MA with a long look back period. In the figure below, the 20-day moving average more closely tracks the actual price than the 100-day moving average does.
A 20-day MA = more beneficial to a shorter-term trader, since it follows the price more closely.
A 100-day MA = more beneficial to a longer-term trader.
Moving averages work quite well in strong trending conditions but poorly in choppy or ranging conditions.
use this indicator along with Price action theory and not alone.
Moving average crossovers are a popular strategy for both entries and exits. MAs can also highlight areas of potential support or resistance
Happy Trading

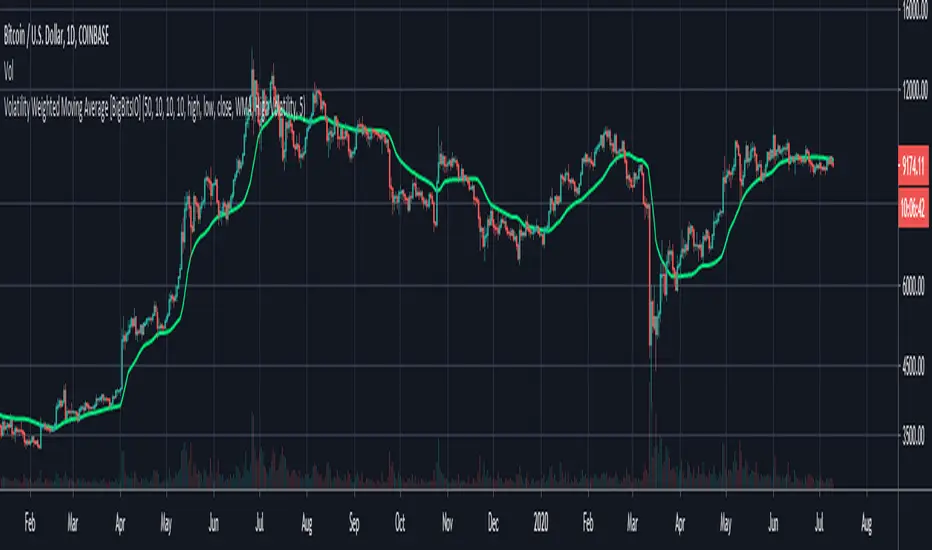
Volatility Weighted Moving Average [BigBitsIO]The "Volatility Weighted Moving Average " indicator is a moving average indicator that is designed to weight certain periods of volatility more so than others, applying a greater impact on periods of high, low or average volatility. Volatility is measured throughout the volatility lookback period, and the current candle is weighted appropriately based on the indicator's weight type. Peak volatility based on the weight type is valued more to amplify the effect of the desired volatility weight.
Below are the settings used for this indicator and what they mean and do:
Moving Average Length: The lookback period for the moving average calculation.
Length To Measure Volatility: The lookback period to compare the volatility of the current candle to. Ex: This candle is high/average/low volatility compared to the candles in the last X candles
Volatility Divisions: The more volatility divisions the more precise the weighting is on candle volatility. With more volatility divisions, there are typically fewer candles that can qualify as peak volatility within the volatility weight type.
Amplify Peak Volatility In Weight Type: This is an extra weight applied to candles with peak volatility to further help weight the moving average in the direction of desired volatility.
Start Source Of Volatility: The starting point of measuring volatility. Volatility is measured as the difference in start - end source.
End Source of Volatility: The ending point of measuring volatility. Volatility is measured as the difference in start - end source.
Moving Average Source: The data source of the candle when used to calculate the moving average.
Moving Average Type: You can choose between a Volatility Weighted "Weighted Moving Average (WMA)", and a Volatility Weighted "Simple Moving Average(SMA)". The WMA and SMA respectively will somewhat resemble the actual WMA and SMA of the same moving average length, but the volatility will be weighted to shift values based on your settings.
Weight Type: The type of volatility that should be valued most. High volatility values candles with the highest volatility, average volatility values candles that are within the average range of volatility most, and the low volatility option weights candles with the least volatility the most.
Moving Average Smoothing Length (SMA): This will smooth the final line with an SMA. The weighting can produce jagged lines by itself, so it is smoothed slightly by default.
Why this indicator was made: I made this indicator because I wanted to visually interpret the effects of volatility on moving averages and if it could help identify any patterns in breakouts, trends, or consolidation periods.
The theory: Using a weight type of high volatility you might be able to identify breakouts with a sharp value incline or decline in slope. An average weight type would help identify trends as it could potentially reduce noise from very large and very small candles and focus more on the value of average candles - I believe for the theory on this one to work you would actually want to use less "Volatility Division" in order to include more average-sized candles in the peak weight. Finally, using a weight type of low volatility could help identify periods of consolidation.
Median Absolute Deviation Filtered SMA & BBMedian Absolute Deviation (MAD) is a robust measurement of variability and more resilient against outliers and small samples.
This experiment uses MAD as a means of filtering outliers from an SMA calculation. First we construct the equivalent of a Bollinger Band, but based on the median as the basis and a multiple( k ) of MAD as the outlier cutoff.
k can be set a number of ways. As a simple multiple (3 - very conservative / 2.5 - moderately conservative / 2 - poorly conservative). Alternatively MAD can be used as an estimator of standard deviation by using a multiple of 1.4826 (SD1 - 1.4826 / SD2 - 2.9652 / SD3 - 4.4478).
Once we have a cutoff range an SMA is calculated with the outliers filtered out. Additionally a Bollinger band can be output using the filtered SMA as the basis and a multiple of the MAD instead of SD for the bands.

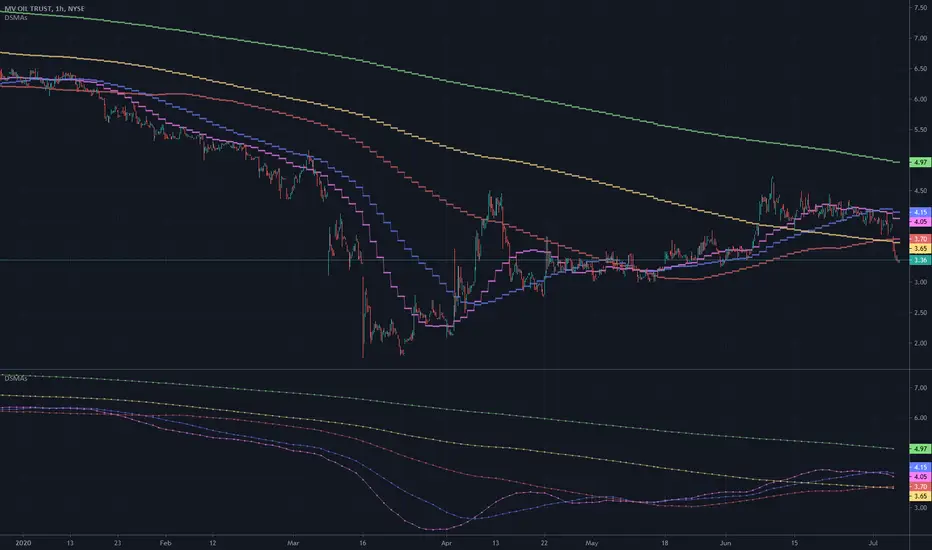
Daily SMAs 10/20/50/100/200This is one of the oldest and simplest trading tools still utilized today, having an ancillary role with long term trading and analyst's commentary in media/news. It's a multicator employing PSv4.0, freely available to ALL, with numerous simple moving averages(SMAs) that use different historical periods of observation in their formulations to portray trading bias. I have revived this tool to my modern expectations of what it could be, embellished with the "Power of Pine".
I provided these moving averages in pastel colors with dotted step-lines as an attempt to not interfere with other "more important indicators" that may exist in your overlay pane. In "Settings" with the "Time Frame" input() set to "Daily", while inspecting much smaller time frames other than daily candles, you may use the sampling quantization tweak to smooth out those step-lines for a different visual appeal. This is exemplified in the lower indicator pane of the chart demonstration above. Also, the brightness control can be quickly and easily fine tuned to your personal preference of visibility that is not distracting. The moving averages are all independently adjustable if you require more responsive calculations with shorter periods of time, or longer...
Features List Includes:
"Daily" or "Chart" time frames
Brightness control
Line thickness adjustment
Sampling quantization tweak
Adjustable periods for the SMAs
The comments section below is solely just for commenting and other remarks, ideas, compliments, etc... regarding only this indicator, not others. When available time provides itself, I will consider your inquiries, thoughts, and concepts presented below in the comments section if you do have any questions or comments regarding this indicator. When my indicators achieve more prevalent use by TV members, I may implement more ideas when they present themselves as worthy additions. As always, "Like" it if you simply just like it with a proper thumbs up, and also return to my scripts list occasionally for additional postings. Have a profitable future everyone!
P-MACD by DGTPrice and Moving Averages Convergence/Divergence, shortly named as P-MACD
P-MACD is a trend-following momentum indicator that shows the relationship between Price and Long-term Moving Average (PMACD), and the relationship between two Moving Averages (MAMACD). P-MACD is composed of two lines, and an histogram, showing price distance (convergence/divergence) to its Long-term MA (PMACD), showing short-term MA distance (convergence/divergence) to long-term MA (MAMACD), and a histogram showing the difference (momentum) between the PMACD and MAMACD
The PMACD is calculated by dividing the Price to Long-term Moving Average (200-period SMA/EMA) and finally smoothed with 9-period SMA/EMA
- PMACD Line Formula : (Price / SlowMovingAverage -1) * 100 and smoothed with 9-period SMA/EMA
The MAMACD is calculated by dividing the Short-term Moving Average (such as 20 SMA/EMA) to the Long-term Moving Average (such as 200-period SMA/EMA)
- MAMACD Line Formula : (FastMovingAverage / SlowMovingAverage -1) * 100
The Histogram is calculated by subscripting PMACD and MAMACD
- Formula : PMACD - MAMACD
Optional
Trend Cloud calculated based on fast and slow version of MAMACD
What to look for:
- Line Crosses : PMACD Line can function as a trigger(signal) for buy and sell signals. Buy when the PMACD crosses above the MAMACD line and sell - or short - when the PMACD crosses below the MAMACD line
- Base Crosses : PMACD and/or MAMACD crosses above or below Baseline is another way to indicate the trend and momentum. MAMACD crosses of Baseline, MAMACD positive or negative, reflects short-term moving average crosses the long-term moving average and similarly, PMACD crosses of BaseLine, PMACD positive or negative, reflects price crosses a long-term moving average
- Momentum : P-MACD helps investors understand whether the bullish or bearish movement in the price is strengthening or weakening displayed with a histogram which graphs the distance between the PMACD and MAMACD. Additionally, upward momentum is confirmed with a bullish crossover, which occurs when PMACD and/or MAMACD crosses above Baseline. Conversely, downward momentum is confirmed with a bearish crossover, which occurs when PMACD and/or MAMACD crosses below Baseline
- Distance : Prices high above the moving average (MA) or low below it are likely to be remedied in the future by a reverse price movement. The more distant the PMACD is above or below its baseline indicates that the distance between the Price and its SMA is growing (regarding PMACD, You may find a detailed article explained in “Price Distance to its MA” indicator by DGT) . Similarly the more distant the MAMACD is above or below its baseline indicates that the distance between the two SMAs is growing
- Trend : A rising P-MACD indicates an uptrend, while a declining P-MACD indicates a downtrend
MACD vs. P-MACD
MACD measures the relationship between two MAs, while the P-MACD measures both the relationship between price and its MA, and the relationship between two MAs. MAMACD Line of P-MACD If set to same moving average type and same lengths as in MACD will produce the same line as MACD line, only values are represented as percentage with MAMACD. Both measure momentum in a market, but, because they measure different factors, they differentiate from each other even if they have similarities in presentation. P-MACD provides additional insights, not only to MA relation but also to Price and MA relation
Warning : Moving Average are calculated based on past prices, so they are lagging. The longer the time period for the moving average, the greater the lag as well as less sensitive to price changes. This study implements usage of 200-period long-term moving average, which implies that the P-MACD will provide insight especially for long-term trades, more suited for long-term trades, usage of P-MACD for short-term trades is recommend with lower timeframes (1H or lower).
Indicators aim to generate a potential signal/indication of an upcoming opportunity, but, the Indicators themselves do not guarantee the future movement of a given financial instrument, and are most useful when used in combination with other techniques.
Trading success is all about following your trading strategy and the indicators should fit within your trading strategy, and not to be traded upon solely
Disclaimer : The script is for informational and educational purposes only. Use of the script does not constitutes professional and/or financial advice. You alone the sole responsibility of evaluating the script output and risks associated with the use of the script. In exchange for using the script, you agree not to hold dgtrd tradingview user liable for any possible claim for damages arising from any decision you make based on use of the script

多重平均线(Multi Moving Average)This is a Multi Moving Average indicator which redesign and translate for Chinese.
这是一个多重平均线(Multi Moving Average)指标。
本脚本的目的在于帮助使用中文的人了解该指标,特别是其用法。同时将该指标代码添加完整的中文注释,方便使用中文的人学习Pine语言。
平均线是最常用的技术分析方法之一。
本指标的特色
相对于官方提供的平均线,本版本平均线指标有两点特色:
1 可以在图表上一次显示多条(最多6条)移动平均线;
2 支持包括SMA、EMA、WMA、HMA、VWMA、RMA等多种平均线,可以根据自己的需求选择相应的平均线。
*注释
SMA:简单移动平均线
EMA:指数加权移动平均线
WMA:加权移动平均线
HMA:船体移动平均线
VWMA:成交量加权移动平均线
RMA:RSI指标中使用的移动平均线,也叫指数加权移动平均线
指标可调节参数
该指标有六个可设置的参数
1 MA1:默认为5;
2 MA2:默认为13;
3 MA3:默认为20;
4 MA4:默认为40;
5 MA5:默认为80;
6 MA6:默认为160。
本指标还有两项可选设置项
1 价格源:价格源默认使用收盘价,但是你还可以选择使用开盘价、最高价、最低价等其他的价格计算方式;
2 选择使用的MA类型;

COVID-19 Status by CountryThis script summarizes the daily COVID-19 confirmed and deaths cases by country. You can select the country of interest and the SMA period in inputs.
For how we think COVID-19 will impact the market in the near future, see the idea below:
All thoughts and critics are welcomed!

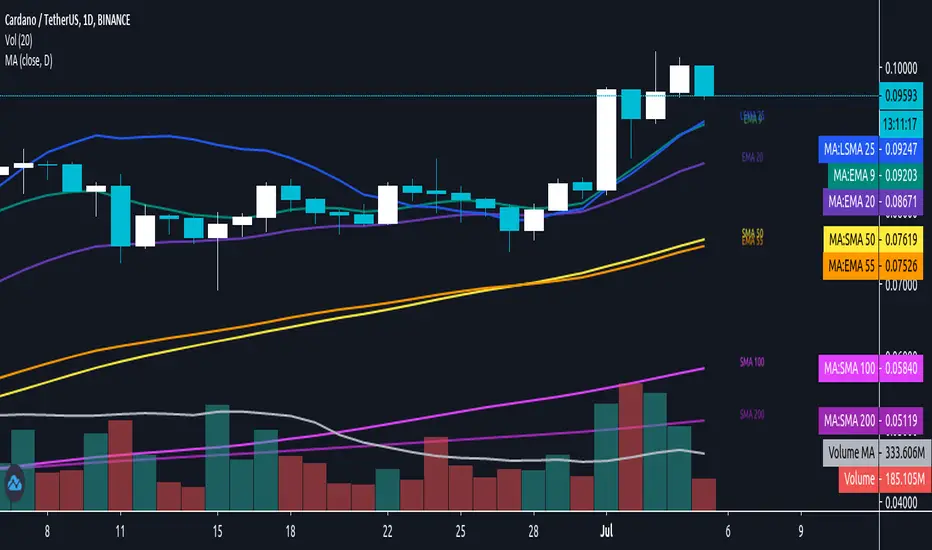
Ultimate Moving Averages (SMA & EMA)Welcome to the Ultimate Moving Average indicator.
Never again spend time looking for EMA / SMA indicators when you can have them all in this single indicator.
Options include :
Daily Chart: Classic Golden / Death Cross - 50/D and 200/D SMA
Daily Chart: 3-day Golden / Death Cross - 150/D and 600/D SMA
Daily Chart: 140/D SMA
Daily Chart: 700/D SMA
Daily Chart: 1458/D SMA
Daily Chart: Golden Ratio Multiplier
Any Chart: Scalping
9 SMA
10 SMA
20 SMA
21 SMA
30 SMA
34 SMA
50 SMA
80 SMA
100 SMA
200 SMA
8 EMA
10 EMA
13 EMA
20 EMA
21 EMA
26 EMA
30 EMA
34 EMA
50 EMA
55 EMA
80 EMA
89 EMA
100 EMA
200 EMA

Intraday BUY/SELLBUY & SELL Scalp Signals for Crude Oil Future Contracts (Or it can be used with any scrip with good amount of Volume) based on Sma & RSI overbought/oversold alert (!) for possible reversal indication.
Take Buy position only if candle breaks the high of alert candle & for Sell positions, take position if candle breaks low of the alert candle.
Best to perform with 3 min timeframe on Crude Oil Futures

HTF Candlestick Patterns [TradingView] vX by DGTCandlesticks are graphical representations of price movements for a given period of time. They are commonly formed by the opening, high, low, and closing prices of a financial instrument. They have their origins in the centuries-old Japanese rice trade and have made their way into modern day price charting.
It’s important to note that candlestick patterns aren’t necessarily a buy or sell signal by themselves. They are instead a way to look at market structure and a potential indication of an upcoming opportunity. It is always useful to look at candlestick patterns in context like any other market analysis tool and candlestick patterns are most useful when used in combination with other techniques. There are countless candlestick patterns that traders can use to identify areas of interest on a chart, where some candlestick patterns may provide insights into the balance between buyers and sellers, others may indicate a reversal, continuation, or indecision.
Reversal patterns are quite useful when used in context. Reversal patterns should form at the bottom of a downtrend or at the top of an uptrend. Otherwise, they are not a reversal patterns, but continuation patterns. Most reversal patterns require confirmation such as price move in the direction of reversal accompanied by appropriate trading volume. The reversal patterns can further be confirmed through other means of traditional technical analysis—like trend lines, momentum, oscillators, or volume indicators—to reaffirm buying or selling pressure. The patterns themselves do not guarantee that the trend will reverse. Investors should always confirm reversal by the subsequent price action before initiating a trade.
This study implements some of the most commonly used candlestick patterns in a context with directional movement indicator. On request users can adjust the strong trend threshold from dialog box, eighter can disabled correlation with directional movement indicator. To add additional sight to analysis the simple moving averages of 20, 50, 100 and 200 periods are added (configurable)
You may add additional indicators of your choice. Colored DMI, BB Cloud or Price Distance to its MAs may help
Enjoy it!
Disclaimer: The script is for informational and educational purposes only. Use of the script does not constitutes professional and/or financial advice. You alone the sole responsibility of evaluating the script output and risks associated with the use of the script. In exchange for using the script, you agree not to hold dgtrd tradingview user liable for any possible claim for damages arising from any decision you make based on use of the script

万有引力(均线支撑阻挡Moving Average Support and Resisitance)系统This is a Moving Average indicator base on R/S which design for Chinese.
这是一个基于均线作为移动支撑阻挡的用法而设计的指标。
本脚本的目的在于帮助使用中文的人了解该指标,特别是其用法。同时将该指标代码添加完整的中文注释,方便使用中文的人学习Pine语言。
均线移动支撑阻挡的用法是葛南维八大买卖法则的基础。
本指标的特色
本指标利用均线的支撑阻挡效应来捕捉一段长期趋势的第二段行情。
*万有引力:即均值回归理论。认为价格始终在重复着远离其均值,再回到其均值;
*洛希极限:以均线为中心,以其0.2标准差构建其上下轨道,形成一个容错通道;
指标可调节参数
该指标有三个可设置的参数
1 短周期均线参数:默认为20;
2 长周期均线乘数:默认为80;
3 标准差参数:0.2
本指标还有两项可选设置项
1 价格源:价格源默认使用收盘价,但是你还可以选择使用开盘价、最高价、最低价等其他的价格计算方式;
2 是否显示强趋势的开关;
3 是否显示中趋势的开关;
指标用法
买入信号: 当指标出现上涨A或上涨B时,即为买入信号。其中上涨A为强趋势信号,上涨B为中趋势信号。
卖出信号: 当指标出现下跌A或下跌B时,即为卖出信号。其中下跌A为强趋势信号,下跌B为中趋势信号。
本指标支持配置买卖点的预警。
指标优势
1 适用于不同的时间周期和不同的交易品种;
2 对趋势有很好的识别效应。
指标局限性
本指标主要在于捕捉趋势的第二段,若当前趋势较弱时,第二段极有可能不成立。

Daily/MTF Moving Averages (EMA20, EMA55, SMA50, SMA100, SMA200)Script to plot common daily/alternative timeframe moving averages on when viewing securities at other resolutions.
There's lots of different MA scripts out there, but I couldn't find one that just represented the standard support/resistance indicators that were typical for my markets. So, this is the DIY. :)
Levels - [Silver-Wong]Draw a line on the right with indicator of what is set :
- EMA
- WMA
- MA
- Ichimoku Tenkan
- Ichimoku Kijun
In all inportant EMAs and timeframes
- MA/EMA/WMA 13, 20, 50, 100, 200
- 1H, 4H, 12H, Daily, Weekly

Trailing Stop LossTrailing stop loss indicator to determine when to exit a position.
Multiple trailing stop loss calculation techniques are implemented:
ATR: Determines stop loss using a gap from recent highest value, that gap is defined by the ATR value and a multiplier
MA: Just a simple moving average used as a stop-loss
Percentage: Uses a percentage of the price
The script also implements alerting to be notified when the stop loss price is reached.

Daily Moving Averages on Intraday ChartShows the Daily Simple Moving Averages on the Intraday Chart
This will include the 200 day SMA, 50 day SMA and 20 day SMA automatically on the intraday chart.
Daily SMA time periods can be adjusted in the settings.
Based on the following script:

Hello VWAP "Beta"This is my 1st indicator, and my attention is to plot the VWAP "Volume-weighted average price" using the SMA "Simple Moving Average" over time... IE over the last 50,100,200 bars and just the VWAP... All of them in just one line... I have made it when I have been using the BTC/US chart, but it should work for stocks/forex or any other chart that you want to use...
I am not completely sure about this indicator and I do want to add more to this, that is how come I am posting to the community to show what I have done and people can use it and if they are open to it give me feedback or tips to make it better...
Happy trading...

