Smoothed RSIThis smoothed RSI indicator is designed to allow users to try and identify periods of extended time in oversold and overbought areas using a smoothed RSI value.
Features:
- RSI
- Period
- Source
- Resolution
- Visibility
- Smoothed RSI
- Period
- Moving Average Type
- Visibility
Simple Moving Average (SMA)


DT21 Moving Averages
I know a lot of people use the free version of TradingView, So I made a script to combine 5 Moving averages as 1 indicator for my followers
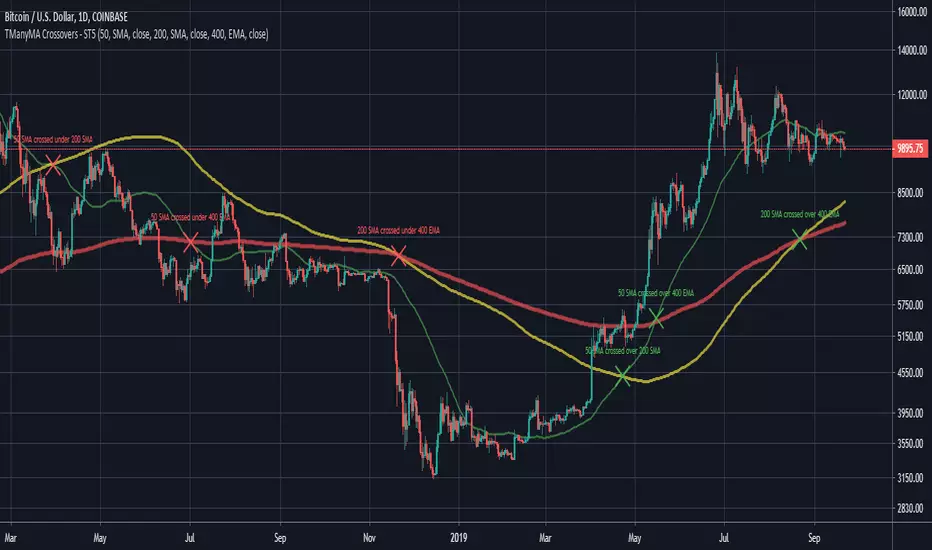
Scripting Tutorial 6 - Triple Many Moving Averages ForecastingThis script is for a triple moving average indicator where the user can select from different types of moving averages, price sources and lookback periods.
Features:
- 3 Moving Averages with variable MA types, periods, price sources and ability to disable each individually
- Crossovers are plotted on the chart with detailed information regarding the crossover (Ex: 50 SMA crossed over 200 SMA )
- Forecasting available for all three MAs. MA values are forecasted 5 values out and plotted as if a continuation to the MA.
- Forecast bias also applies to all forecasting. Bias means we can forecast based on an anticipated bullish, bearish or neutral direction in the market.
- To understand bias, please read the source code, or if you can't read the code just send me a message on here or Twitter. Twitter should be linked on my profile.
This script is meant as an educational script with well-formatted styling, and references for specific functions.

Volume-supported Fractal SRModified version of SynapticEX's Volume-supported Fractal S/R with EMA instead of SMA, pinescript 4 port, and EMA20/EMA50 defaults for support and resistance.
EMA20 = red/green
EMA50 = orange/yellow

MTF Bollinger Bands - ModifiedModified version of tansancrypto's MTF Bollinger to Pinescript 4 and removed limiters on BB1/BB2 max Sigma values.
Original Script:

Scripting Tutorial 5 - Triple Many Moving Averages CrossoversThis script is for a triple moving average indicator where the user can select from different types of moving averages and periods. This script improves upon tutorial 3 by adding source selection for MAs and another option for an MA that is not built-in, the HMA . It is meant as an educational script with well formatted styling, and references for specific functions.
Scripting Tutorial 3 - Triple Many Moving AveragesThis script is for a triple moving average indicator where the user can select from different types of moving averages. It is meant as an educational script with well formatted styling, and references for specific functions.

Scripting Tutorial 1 - Simple Moving AverageThis script is for a simple moving average indicator. It is meant as an educational script with well formatted styling, and references for specific functions.

DT-21 Moving AveragesI know a lot of people use the free version of TradingView, So I made a script to combine 5 Moving averages as 1 indicator.
X Period High/Low/MidToday we have a simple, but endlessly versatile, indicator that plots the X Period High/Low/Mid of your chosen market.
Traditionally the 52 week High/Low is used as a breakout signal. However, by changing to an X period, and adding a midway line, we create a more versatile indicator that can be tailored to various markets.
By default it's set at 250 periods (because I like the 250 period moving average), and I generally trade H4 and Daily time frames. But tweak it to your liking, you just have to modify the length periods by your desired time frame and lookback length. E.g. to create a 52 week indicator on the daily time frame, enter a length of 260 in the indicator (5 days per week * 52 weeks = 260).
For the above reason, I haven't made this indicator MTF, as there's no real need. However, if users find it easier I can look at adding it later.
Also, the mid point between an X period high/low is often a good trend-follower, as well as acting as support/resistance . I encourage you to experiment with different ways of using this indicator. Entire systems (if your risk management is correct) can be built and traded from this one indicator.
Good luck.
DD


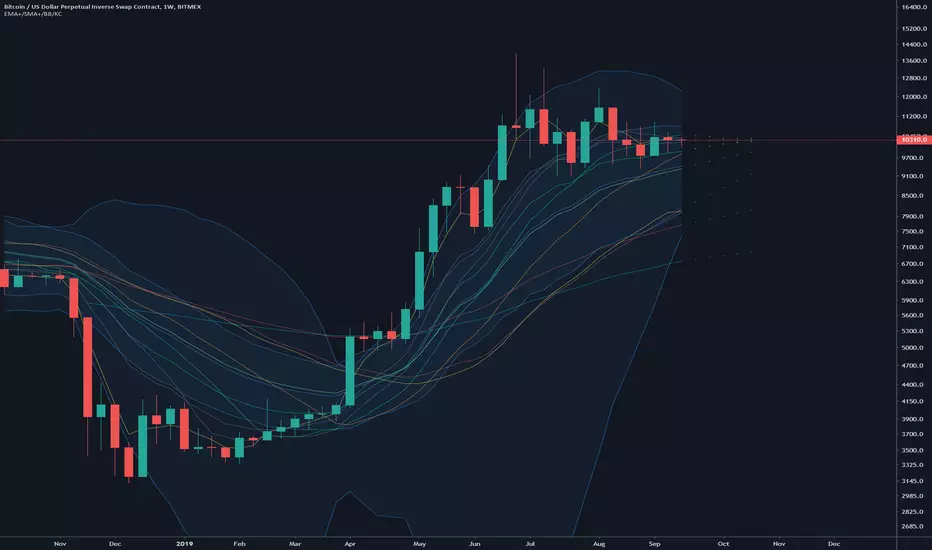
EMA/SMA Forecast MTF with BB and KC5 x EMA with future forecast values (5 periods)
4 x SMA with future forecast values (5 periods)
2 x MTF EMA
2 x MTF SMA
Bollinger Bands
Keltner Channels
Enjoy!
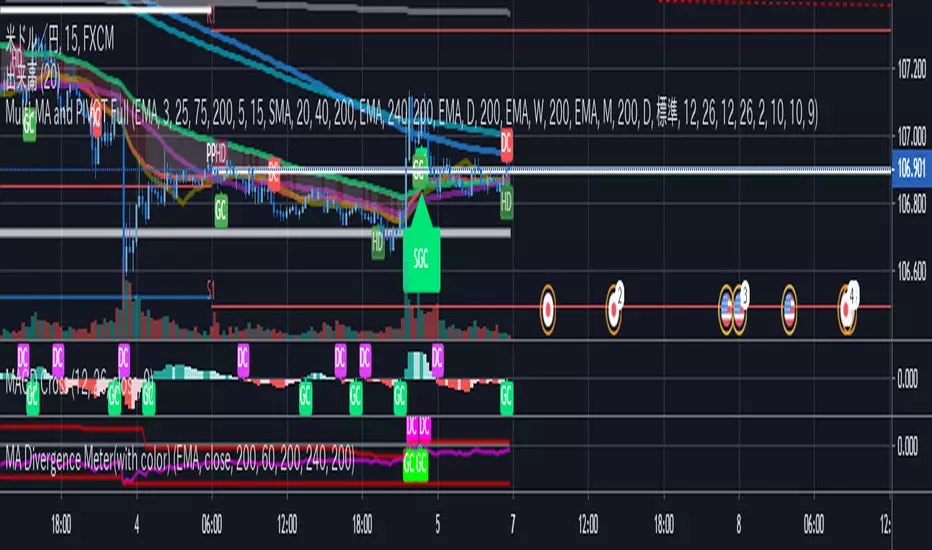
VWAP/MVWAP/SMA CROSSOVERTo use this indicator is simple.
When the VWAP (Thick Yellow) AND the two SMA (Orange and thin Yellow) cross above the MVWAP (Purple) then you will be in a uptrend that could possibly continue upwards. The opposite is true if you are looking a short opportunity, wait for the three other lines to cross under the MVWAP and you should be in a downtrend that could possibly continue downwards
Of course as with all indicators not every signal will be 100% accurate there is no way to predict human emotions when it comes to trading but based on the VWAP strategy used in other markets this is the closest I could get.
Note: Don't relay completely on this indicator to think for you. Use other forms of TA to confirm all positions before entering. And if the candles start trending the opposite direction after a lets say a mini pump/dump then the signal was false.
Finally this was made according to the 15 minute chart. I did not plan on remaking it for any other timeframes as I have left the code open for you to tweak and the setting are free to adjust aswell.
Q/A
Q: Does it repaint?
A: No, this is based on moving averages as far as I know they don't repaint.
Q: How did you come up with this indicator?
A: Went on youtube looking for trading strategies other and the usual EMA crosses and found a VWAP & EMA strat. I added the MVWAP and played with the numbers until I found something that I liked.
Q: How long have you been trading/learning pinescript?
A: Been trading less than a two months and pinescript about a month and a half.

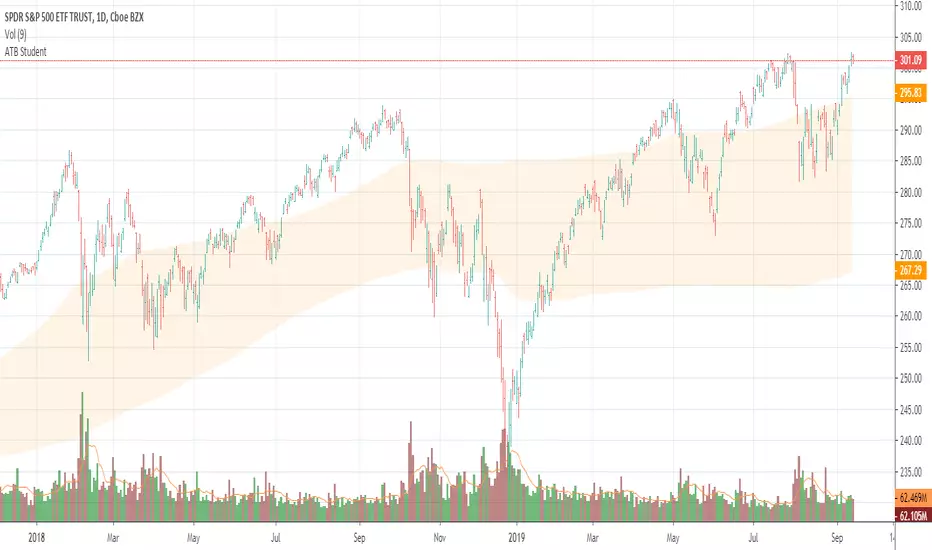
Apex Transformation Band StudentApex Transformation Band Student Version
Gauge the mean range of price on an annual/yearly basis of the market.
Determine if price is in an uptrend (above the zone), neutral (inside the zone) or downtrend (below the zone).
Works on 'Daily' time frame only.
Works only for SPY , QQQ , DIA , IWM , GLD , SLV , TLT and BTCUSD
Keep it simple.
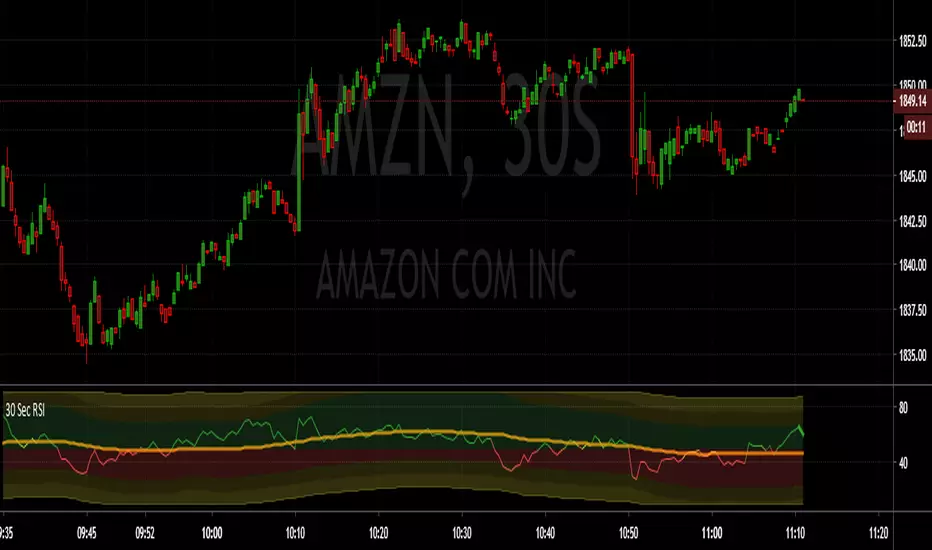
RSI and RSI SMA Signal with Variable LevelsThis script does the following:
Plots RSI to the existing resolution.
Plots the 50 SMA (sourced from the RSI)
Colors the line red when below the 50 SMA and RSI is below 50.
Colors the line green when above the 50 SMA and RSI is above 50.
Banding:
Green from 50 to 70
Dark yellow from 70-80 and 30-20
Red from 50 to 30
Brighter yellow from 80-90 and 20-10
The banding varies if there is a trend in the 50 SMA that holds below the 50 level. This way it defines the levels safe to maintain a position during and not during a trend.
You will notice that the red area increases and the OS yellow area(s) decreases if a short trend has developed.
You will notice that the green area increases and the OB yellow area(s) decreases if a long trend has developed.
The maximum levels are limited to 90 and 10.
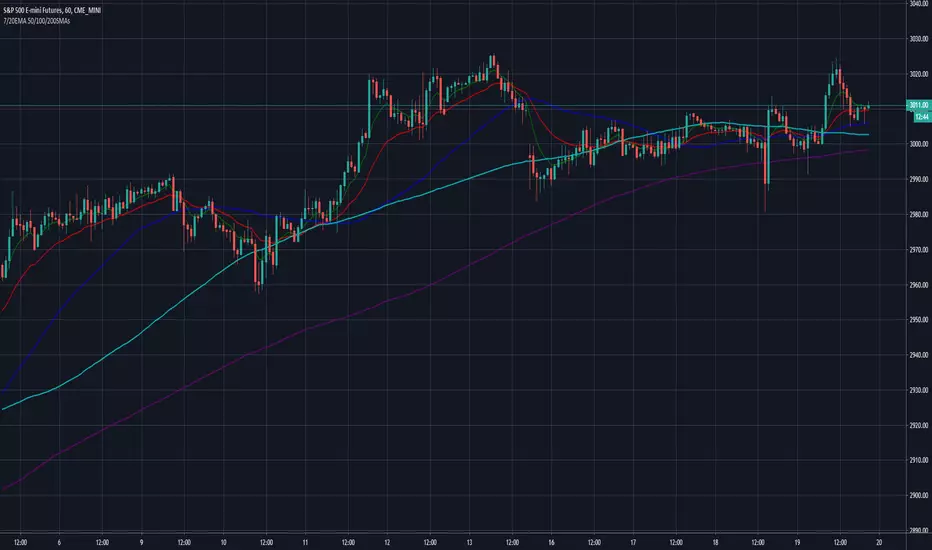
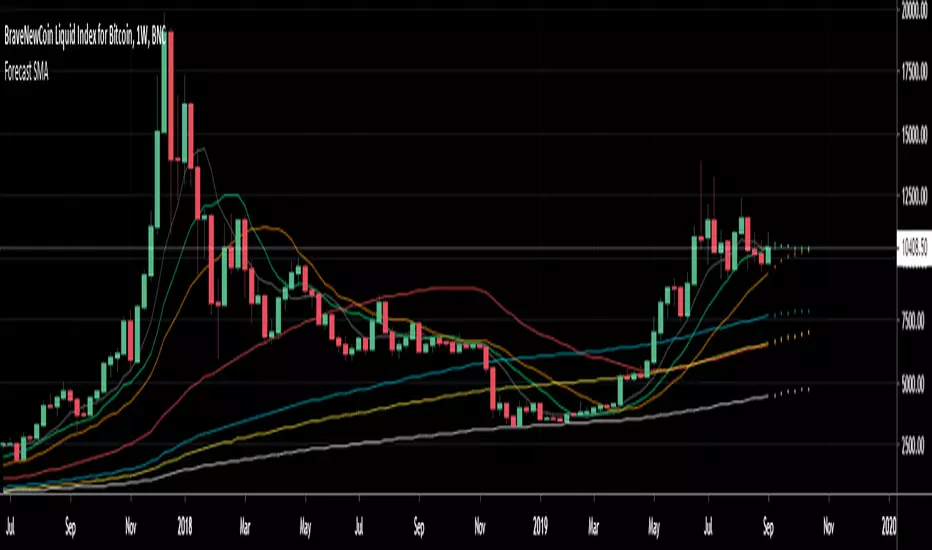
Forecast 7 SMA's 6 periodsForecast 7 SMA's 6 periods
This script is an upgrade of the existing Triple MA Forecast from Yatrader2
To allow the user to display 7 different SMAs and look 6 candles ahead
Default Value
8 SMA
13 SMA
20 SMA
50 SMA
100 SMA
128 SMA
200 SMA
Note:
Best to use on high timeframe, if on low timeframe change the forecast maximum to lower
This was made to forecast the 20 SMA on weekly timeframe on the upcomming Bitcoin price
Multi Timeframe EMA/SMAFeatures:
Up to 10 EMA/SMA
Optionally select a different resolution for each EMA/SMA
