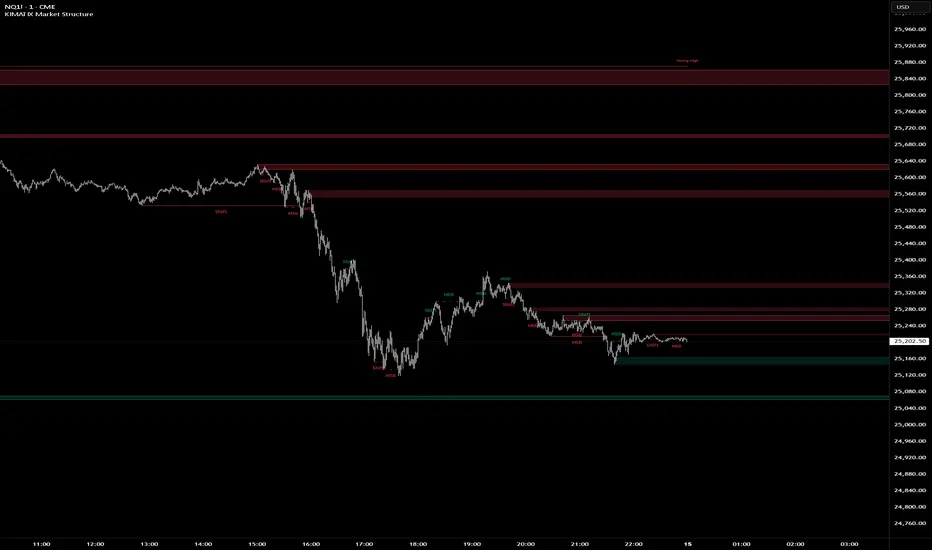
KIMATIX Market StructureKIMATIX Market Structure is a professional-grade market structure and liquidity framework built for traders who focus on institutional price behavior, not lagging indicators.
This tool continuously analyzes price to map internal (micro) and external (macro) structure, giving you a clear read on whether the market is in continuation, transition, or reversal. Instead of guessing trend direction, you see it unfold in real time through structure breaks and shifts.
What the indicator helps you identify
Micro & Macro Market Structure
Internal structure for execution and timing
Higher-structure context for directional bias
Market Structure Breaks (MSB) vs. Shifts
MSB highlights continuation strength
Shift signals potential trend transition
Institutional Zones
Automatically derived zones where displacement occurred
Designed to highlight areas of likely reaction, mitigation, or continuation
Strong vs. Weak Highs and Lows
Instantly see which extremes are protected and which are vulnerable to liquidity raids
Optional Swing Logic (HH / HL / LH / LL)
For traders who want classic structure confirmation layered on top
Historical vs. Present Mode
Study full structure development or keep the chart clean and execution-focused
The indicator is intentionally not a signal generator. It is a decision-support tool designed to give clarity, context, and confluence. Best results come from combining it with session timing, liquidity concepts, and your execution model.
Built with strict object management and internal safeguards, the script remains fast and stable even on lower timeframes and extended chart history.
If you trade price action, liquidity, and structure, this tool is designed to fit seamlessly into your workflow.
More Indicators here: kimatixtrading.com
Smartmoney
Smart Money Alpha Signals (Performance Dashboard) Smart Money Alpha Signals: Identifying Market Leaders & Generating Alpha
GMP Alpha Signals (Global Market Performance Alpha) is a specialized analysis tool designed not merely to find stocks that are rising, but to identify "Alpha" assets—Market Leaders that defend their price or rise even under adverse conditions where the market index falls or consolidates.
This indicator visualizes the concept of Comparative Relative Strength (RS) and Smart Money accumulation patterns, helping traders capture profit opportunities even during bearish market phases.
Key Objectives (Purpose)
Alpha Capture: Identifying assets generating 'excess returns' that outperform the market Beta.
Smart Money Tracking: Detecting traces of 'institutional buying' and 'accumulation' that defend prices during index plunges.
Decoupling Identification: Spotting assets moving on independent catalysts or momentum, regardless of the broader market direction.
Stop Hunt Filtering: Distinguishing 'fake drops' where price dips temporarily, but Relative Strength remains intact.
Dashboard Guide
Interpretation of the information panel (Table) displayed on the chart.
Rel. Performance: Shows the excess return compared to the index over the set period. (Positive/Green = Stronger than the market).
Decoupling Strength: The correlation coefficient with the index. Lower values (0 or negative) indicate movement independent of market risk.
Bullish: The count/rate of rising or limiting losses when the index drops sharply (e.g., < -0.5%). (Gold = Market Crash Leader).
Defended: The count/rate of holding support levels when the index shows mild weakness (e.g., < -0.05%). (Gold = Strong Accumulation).
Bench. Defense: The defense rate of the comparison benchmark (e.g., TSLA, ETH). Your target asset must be higher to be considered the sector leader.
Input Options & Settings Guide
You can optimize settings according to your trading style and asset class (Stocks/Crypto).
(1) Main Settings
Major Index: The baseline market index for comparison.
(US Stocks: NASDAQ:NDX or TVC:SPX / Crypto: BINANCE:BTCUSDT)
Benchmark Symbol: A competitor within the sector.
(e.g., Set NVDA when analyzing Semiconductor stocks).
Correlation Lookback: The lookback period for judging decoupling. (Default: 30)
Performance Lookback: The number of bars to calculate cumulative returns and defense rates. (Default: 60)
(2) Dashboard Thresholds
These settings define the criteria for what qualifies as "Defended" or "Bullish".
Performance (Max %): Used to find assets that haven't pumped yet. Signals trigger only when Alpha is below this value.
Defended Logic:
Index Drop Condition: The index must drop by at least this amount to start checking. (e.g., -0.05%)
Asset Buffer: How much the asset must outperform the index drop.
(Example: If Index drops -1.0% and Buffer is 0.2%, the asset must be at least -0.8% to count as 'Defended').
Bullish Logic: Measures resilience during steeper market dumps (e.g., -0.5% drop) compared to the Defended Logic.
Volume Settings: Decides whether to count Defended/Bullish instances only when accompanied by volume above the SMA.
(3) Signal Logic Settings (Crucial)
Customize conditions to trigger alerts. The choice between AND / OR is crucial.
AND: Condition must be met SIMULTANEOUSLY with other active conditions (Conservative/High Certainty).
OR: Condition triggers the signal INDEPENDENTLY (Aggressive/Opportunity Capture).
Performance: Is the relative performance within the threshold? (Basic Filter).
Decoupling: Has the correlation dropped? (Start of independent move).
Bullish Rate: Is the Bullish rate high during market dumps?
Defended Rate (High): (Recommended) Is there continuous price defense occurring? (Accumulation detection).
Defended Rate (Low): (Warning) Has the defense rate broken down? (For Stop Loss).
Defended > Benchmark: Is it stronger than the Benchmark (2nd tier)?
Volume Spike: Has volume surged compared to the average? (Institutional involvement).
RSI Oversold: Is it in oversold territory? (Counter-trend trading).
Decoupling Move: Does the current bar show the "Index Down / Asset Up" pattern?
Min USD Volume: Transaction value filter (To exclude low liquidity assets).

Market Structure Pivots with BOS & CHoCH [zazenio]What is Market Structure?
Market structure is simply the pattern of highs and lows that price creates as it moves. When you look at any chart, you'll notice price doesn't move in a straight line — it swings up, pulls back, swings up again (in an uptrend), or the opposite in a downtrend.
These swing points — the peaks and valleys — are what traders call pivots . Identifying them correctly is the foundation of understanding where a market has been and where it might go next.
What This Indicator Does
Swing Pivots automatically marks these peaks and valleys on your chart so you don't have to draw them manually. It works on any market — stocks, crypto, forex, futures, indices — and on any timeframe.
Beyond just marking pivots, this indicator also draws BOS (Break of Structure) and CHoCH (Change of Character) lines — two essential concepts that help you understand when a trend is continuing or potentially reversing.
How Pivots Are Detected
This indicator confirms pivots based on price structure, not a fixed bar count.
Here's how it works:
A swing high is confirmed when price breaks below the previous swing low. At that moment, we know the high was real — price tried to go higher, failed, and reversed. The market "proved" that level was a genuine turning point.
A swing low is confirmed when price breaks above the previous swing high. The same logic applies — price tried to go lower, failed, and reversed direction.
This creates a natural alternation: high, low, high, low. Each pivot is validated by the market's actual behavior, not by waiting for an arbitrary number of bars to pass.
Understanding BOS and CHoCH
Once you can identify pivots, the next step is understanding what happens when price breaks through them. This is where BOS and CHoCH come in.
BOS (Break of Structure)
A Break of Structure occurs when price continues in the direction of the current trend by breaking a previous pivot level.
In an uptrend : Price breaks above a previous swing high → This signals strength. Buyers are pushing price to new highs, and the trend is likely to continue.
In a downtrend : Price breaks below a previous swing low → This signals weakness. Sellers are pushing price to new lows, and the trend is likely to continue.
Think of BOS as the market saying "the trend is still intact." Each BOS confirms that the dominant side (buyers or sellers) remains in control.
CHoCH (Change of Character)
A Change of Character occurs when price breaks a pivot level in the opposite direction of the current trend. This is an early warning signal that the trend may be reversing.
In an uptrend : Price breaks below a previous swing low → This is unexpected. In a healthy uptrend, lows should hold. When they don't, it suggests buyers are losing control and sellers may be taking over.
In a downtrend : Price breaks above a previous swing high → This is unexpected. In a healthy downtrend, highs should hold. When they don't, it suggests sellers are losing control and buyers may be stepping in.
Think of CHoCH as the market's behavior "changing character" — it's no longer acting the way it should if the trend were healthy.
Why BOS and CHoCH Matter
These concepts give you a framework for reading what the market is actually doing:
BOS tells you the trend is continuing — stay with it or look for entries in that direction
CHoCH warns you the trend may be ending — time to be cautious, take profits, or look for trades in the new direction
By visualizing these breaks directly on your chart, you don't have to guess. You can see at a glance whether the market is trending smoothly (consecutive BOS) or showing signs of reversal (CHoCH).
Why This Approach Works
Most pivot indicators use a "lookback" method — they wait for a certain number of bars (say, 5 or 10) on each side of a candle before confirming it as a pivot. This creates a fixed delay. By the time the pivot appears on your chart, price has already moved on.
This indicator doesn't wait. It confirms pivots the moment price structure proves them. The result is pivots that align with how traders actually read charts — based on breaks of structure, not arbitrary countdowns.
Settings
Configuration
Swing Width : Controls how sensitive the detection is. Higher numbers show only major swings; lower numbers capture smaller moves within the structure.
Pivot Settings
High/Low Color : Customize the colors of swing high and swing low markers
Style : Choose between Triangle or Circle markers
Size : Adjust the size of pivot markers (Auto, Tiny, Small, Normal)
Structure Lines
Show CHoCH : Toggle Change of Character lines on/off
CHoCH Color : Customize the color of CHoCH lines
CHoCH Label : Show/hide the "CHoCH" text label
Show BOS : Toggle Break of Structure lines on/off
BOS Color : Customize the color of BOS lines
BOS Label : Show/hide the "BOS" text label
Use Cases
See the "skeleton" of price action at a glance
Identify potential support and resistance levels
Understand if the market is trending or ranging
Spot trend continuations with BOS lines
Catch early reversal signals with CHoCH lines
Build a foundation for more advanced trading strategies
━━━━━━━━━━━━━━━━━━━━━━
Version History
v1.1
Added BOS (Break of Structure) lines to visualize trend continuation
Added CHoCH (Change of Character) lines to identify potential trend reversals
Added toggle options for BOS and CHoCH visibility
Added customizable colors for structure lines
Added optional labels for BOS and CHoCH
v1.0
Initial release
Automatic swing high and swing low detection
Structure-based pivot confirmation (not fixed lookback)
Customizable pivot markers (style, size, colors)
Adjustable swing width sensitivity
━━━━━━━━━━━━━━━━━━━━━━
Disclaimer:
This script is provided for educational and informational purposes only. It is not financial advice and does not constitute a recommendation to buy or sell any financial instrument. Always do your own research and trade at your own risk.

Swing Pivots - Market Structure High Low [zazenio]What is Market Structure?
Market structure is simply the pattern of highs and lows that price creates as it moves. When you look at any chart, you'll notice price doesn't move in a straight line — it swings up, pulls back, swings up again (in an uptrend), or the opposite in a downtrend.
These swing points — the peaks and valleys — are what traders call pivots. Identifying them correctly is the foundation of understanding where a market has been and where it might go next.
What This Indicator Does
Swing Pivots automatically marks these peaks and valleys on your chart so you don't have to draw them manually. It works on any market — stocks, crypto, forex, futures, indices — and on any timeframe.
How Pivots Are Detected
This indicator confirms pivots based on price structure, not a fixed bar count.
Here's how it works:
A swing high is confirmed when price breaks below the previous swing low. At that moment, we know the high was real — price tried to go higher, failed, and reversed. The market "proved" that level was a genuine turning point.
A swing low is confirmed when price breaks above the previous swing high. The same logic applies — price tried to go lower, failed, and reversed direction.
This creates a natural alternation: high, low, high, low. Each pivot is validated by the market's actual behavior, not by waiting for an arbitrary number of bars to pass.
Why This Matters
Most pivot indicators use a "lookback" method — they wait for a certain number of bars (say, 5 or 10) on each side of a candle before confirming it as a pivot. This creates a fixed delay. By the time the pivot appears on your chart, price has already moved on.
This indicator doesn't wait. It confirms pivots the moment price structure proves them. The result is pivots that align with how traders actually read charts — based on breaks of structure, not arbitrary countdowns.
Settings
Swing Width: Controls how sensitive the detection is. Higher numbers show only major swings; lower numbers capture smaller moves within the structure.
Style/Size/Colors: Customize how the pivot markers look on your chart.
Use Cases
See the "skeleton" of price action at a glance
Identify potential support and resistance levels
Understand if the market is trending or ranging
Build a foundation for more advanced concepts like Break of Structure (BOS) and Change of Character (CHoCH)
⸻
Disclaimer:
This script is provided for educational and informational purposes only. It is not financial advice and does not constitute a recommendation to buy or sell any financial instrument. Always do your own research and trade at your own risk.

Fractal Fade Pro IndicatorA revolutionary contrarian trading indicator that applies chaos theory, fractal mathematics, and market entropy to generate high-probability reverse signals. This indicator fades traditional technical signals, providing BUY signals when conventional indicators say SELL, and SELL signals when they say BUY.
Full Description:
Most traders follow the herd. QFCI does the opposite. It identifies when conventional technical analysis is about to fail by detecting mathematical patterns of exhaustion in market structure.
How It Works (Technical Overview):
The indicator combines three sophisticated mathematical approaches:
Fractal Dimension Analysis: Measures the "roughness" of price movements using fractal mathematics
Market Entropy Calculation: Quantifies the randomness and disorder in price returns using information theory
Phase Space Reconstruction: Analyzes price evolution in multi-dimensional state space from chaos theory
Signal Generation Process:
Step 1: Market Regime Detection
Chaotic Regime: High fractal complexity + rising entropy (avoid trading)
Trending Regime: Low fractal complexity + high phase space distance (fade breakouts)
Mean-Reverting Regime: Very low fractal complexity (fade extremes)
Step 2: Reverse Signal Logic
When traditional indicators would give:
BUY signal (breakout, oversold bounce, volatility spike) → QFCI shows SELL
SELL signal (breakdown, overbought rejection, volatility crash) → QFCI shows BUY
Step 3: Smart Signal Filtering
No consecutive same-direction signals
Adjustable minimum bars between signals
Multiple confirmation layers required
Unique Features:
1. Mathematical Innovation:
Original fractal dimension algorithm (not standard indicators)
Market entropy calculation from information theory
Phase space reconstruction from chaos theory
Multi-regime adaptive logic
2. Trading Psychology Advantage:
Contrarian by design - profits from market overreactions
Fades retail trader mistakes - enters when others are exiting
Reduces overtrading - strict signal frequency controls
3. Clean Visual Interface:
Only BUY/SELL labels - no chart clutter
Clear directional arrows - immediate signal recognition
Built-in alerts - never miss a trade
Recommended Settings:
Default (Balanced Approach):
Fractal Depth: 20
Entropy Period: 200
Min Bars Between Signals: 100
Aggressive Trading:
Fractal Depth: 10-15
Entropy Period: 100-150
Min Bars Between Signals: 50-75
Conservative Trading:
Fractal Depth: 30-40
Entropy Period: 300-400
Min Bars Between Signals: 150-200
Optimal Timeframes:
Primary: Daily, Weekly (best performance)
Secondary: 4-Hour, 12-Hour
Can work on: 1-Hour (with adjusted parameters)
How to Use:
For Beginners:
Apply indicator to chart
Use default settings
Wait for BUY/SELL labels
Enter on next candle open
Use 2:1 risk/reward ratio
Always use stop losses
For Advanced Traders:
Adjust parameters for your trading style
Combine with support/resistance levels
Use volume confirmation
Scale in/out of positions
Track performance by regime
Risk Management Guidelines:
Position Sizing:
Conservative: 1-2% risk per trade
Moderate: 2-3% risk per trade
Aggressive: 3-5% risk per trade (not recommended)
Stop Loss Placement:
BUY signals: Below recent swing low or -2x ATR
SELL signals: Above recent swing high or +2x ATR
Take Profit Targets:
Primary: 2x risk (minimum)
Secondary: Previous support/resistance
Tertiary: Trailing stops after 1.5x risk
IMPORTANT RISK DISCLOSURE
This indicator is for educational and informational purposes only. It is not financial advice. Past performance does not guarantee future results. Trading involves substantial risk of loss and is not suitable for every investor. The risk of loss in trading can be substantial. You should therefore carefully consider whether such trading is suitable for you in light of your financial condition.

Dark Pool Pulse – LiteDark Pool Pulse Lite
This indicator provides an observational proxy for dealer gamma exposure using only price and volume data. It helps users visualize whether market makers may be leaning long gamma (potential stabilizing flows) or short gamma (potential destabilizing flows). For educational and informational purposes only.
Key Features
0–100 oscillator representing an estimated dealer-gamma proxy.
Bullish zone (above 60): dealers may be long gamma → potentially absorbing volatility.
Bearish zone (below 40): dealers may be short gamma → potentially amplifying volatility.
Background tint for quick visual context.
Optional summary table showing current value and interpretation.
Alert conditions for crosses of the 60 and 40 thresholds.
How It Works
The indicator measures volume-weighted directional pressure and normalizes it over a rolling lookback window. The value is smoothed and mapped into a 0–100 oscillator:
Above 60 → potential positive gamma conditions.
Below 40 → potential negative gamma conditions.
40–60 → neutral or balanced zone.
All calculations are performed internally using only price and volume.
Settings
Lookback Length (default 20): Number of bars used for normalization.
Smoothing Length (default 10): EMA smoothing applied to the proxy.
Show Summary Table: Toggles the optional value/interpretation panel.
How to Use
Add the indicator to any chart or timeframe.
Observe the oscillator levels:
A move above 60 may reflect a more stabilizing dealer environment.
A move below 40 may reflect a more destabilizing environment.
Use the background tint for quick contextual bias.
Enable alerts for threshold crossings if desired.
Adjust settings to match your preferred responsiveness.
Notes
For educational and informational purposes only.
Not financial, trading, or investment advice.
No signals or recommendations are provided.
Source code protected to maintain proprietary calculation methods.

Sen Channel LiteSen Channel Lite
Sen Channel Lite calculates a robust, median-based regression channel using the Theil–Sen slope method. This visual tool helps traders identify trend direction and potential breakout zones in real time.
Key Features
Dynamic Trend Line: The median-based regression line adapts to price movement, providing a central reference for trend direction.
Upper and Lower Bands: Automatically updated bands highlight potential breakout or reversal areas.
Breakout Markers: Optional triangles indicate when price crosses above the upper band or below the lower band.
Midline (EMA/SMA): Toggleable trend line for additional context on price direction.
VWAP Anchor: Optional VWAP plot to visualize volume-weighted average price levels.
Customizable Inputs:
Lookback Period for slope calculation
Band Multiplier to adjust sensitivity
Option to use Standard Deviation or ATR for band width
Midline type, length, and color
VWAP visibility and color
Channel cloud transparency
How to Read Signals (Educational Use Only):
Trend Context: The midline provides a reference for general trend direction. Price above the midline suggests bullish bias; below indicates bearish bias.
Breakouts:
Triangle up → price crossed above the upper band; potential strong move upward.
Triangle down → price crossed below the lower band; potential strong move downward.
Channel Interpretation:
Price near the upper band → market may be overextended.
Price near the lower band → market may be oversold.
Price moving within the channel → trend is balanced; use additional analysis for direction.
VWAP Context: Compare price to VWAP for intraday support/resistance insights.
Usage Notes:
Fully visual tool; no trading or financial advice.
All calculations are protected to preserve intellectual property.
Results reflect real-time calculations; no repainting.
Suitable for intraday to daily timeframes.
Important: This script is published as protected/closed-source to safeguard GammaBulldog intellectual property.
Options Fusion Core - Lite v6Options Fusion Core – Lite v6
A dual-engine oscillator designed to provide clear, confidence-driven market reads. OFC – Lite v6 combines two high-signal components into a single 0–100 panel to help traders interpret momentum strength and liquidity flow at a glance.
Core Components
Momentum Engine (Solid Line)
Above 50: Bullish bias (green shades)
Below 50: Bearish bias (red shades)
Near 20 or 80: Potential exhaustion zones where trends may pause or reverse
Liquidity Gauge (Dotted Line)
Above 55: Strong buying pressure
Below 45: Selling pressure
Around 50: Neutral flow
How to Use (Educational Purpose Only)
Alignment Signals: Watch for Momentum Engine and Liquidity Gauge moving in the same direction.
Example: Momentum >50 and Liquidity >55 → constructive environment
Example: Momentum <50 and Liquidity <45 → weakening conditions
Extremes: Momentum near 20 or 80 indicates potential trend exhaustion. Paired with strong Liquidity changes, these zones may highlight possible reversals or pauses.
Neutral Line (50): Many false moves occur around 50. Wait for a clear break above or below before interpreting as a signal.
Use in Context: Combine with price action, volume, or other indicators for confirmation.
User Inputs
Fast Momentum Length — controls how quickly Momentum reacts
VFI Length — smooths the Liquidity Gauge
VFI Cutoff — adjusts sensitivity to flow spikes
Lite Version:
Oscillator panel only
No automated signals or multi-ticker table
Educational and visualization purposes only
Important Notice
This script is educational and informational only. Not trading, financial, or investment advice.
Calculations are proprietary and protected to safeguard intellectual property.
No repainting; all results reflect real-time calculation.

Gamma Conviction Oscillator LiteGamma Conviction Oscillator Lite
A volume-weighted momentum oscillator designed to help traders visualize conviction in gamma-heavy instruments (SPY, TSLA, NVDA, MSTR, COIN, HOOD, etc.). This LITE edition is fully functional and educational, focusing on reading market momentum without offering trading signals.
Core Features (LITE Version):
Dynamic oscillator panel with volatility-adjusted overbought/oversold levels
Long-term trend filter: 200-period moving average selectable as SMA, EMA, or HMA
Conviction-based coloring system:
Bright Lime → high-conviction oversold (price above long-term MA)
Bright Red → high-conviction overbought (price below long-term MA)
Teal / Maroon → low-conviction extremes (counter-trend)
User Inputs:
Base Oscillator Length, Volatility Smoothing Length, and Sensitivity Factor are adjustable in Settings → Inputs
Long-Term Trend Length and MA Type are selectable for trend confirmation
How to Read Signals (Educational Use Only):
Oscillator Level: Observe the main VWPS line relative to overbought/oversold levels:
Above the red overbought line → price may be stretched
Below the green oversold line → price may be compressed
Trend Context: Compare the oscillator reading to the long-term MA:
Oscillator above oversold + price above MA → potential bullish conviction
Oscillator below overbought + price below MA → potential bearish conviction
Color Coding: The line color communicates conviction strength and trend alignment:
Bright Lime / Bright Red indicate strong alignment with trend extremes
Teal / Maroon indicate weaker, counter-trend extremes
Use the oscillator in conjunction with your own analysis; consider confirming with price action, volume, or other indicators.
LITE Version:
Oscillator panel only
No divergence detection
No multi-ticker gamma table
Important Notice:
This script is educational and informational only. Not trading, financial, or investment advice.
All calculations are proprietary and protected to preserve intellectual property.
No repainting: results reflect real-time calculations.
Source Code:
This script is published as protected/closed-source to safeguard GammaBulldog intellectual property.

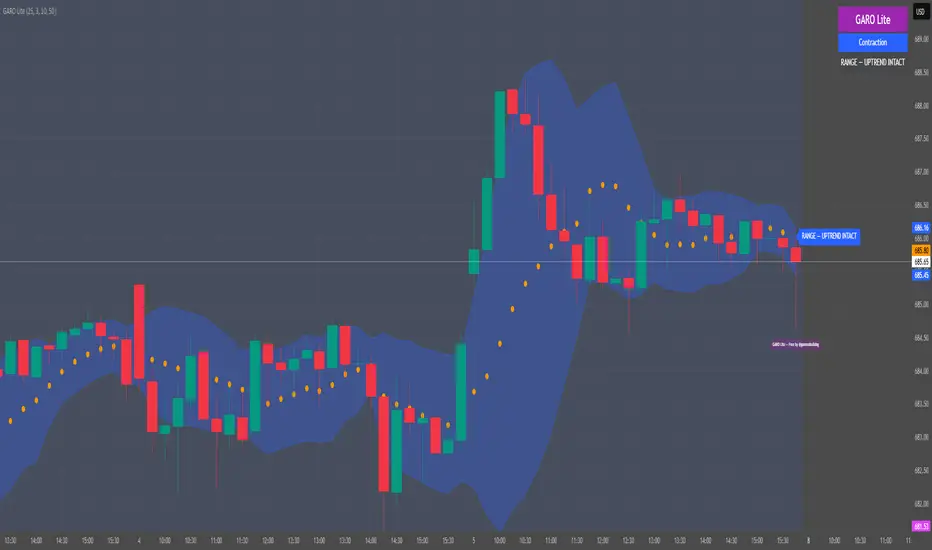
GARO Lite - Free Regime EngineGARO — Gamma Regime Engine
Overview
GARO (Gamma Regime Oscillator) is a visual regime engine that shows market conditions in real-time. This free edition is for educational and charting purposes only.
Key Features
Regime Detection: Highlights Expansion, Contraction, and Spike conditions using trend, volatility, and volume-based calculations.
Core and Bands: Central reference line with upper and lower bands.
Visual Alerts: Orange dots appear under candles during compressions; background colors indicate current regime.
Signal Labels: Labels provide visual guidance based on regime and trend slope.
Gamma Exposure (GEX) Proxy & Zero Gamma Flip: Optional visual overlays for contextual awareness.
User Inputs: Some settings are visible in the input panel but are disabled in this free edition.
How to Use
Regime Colors:
Expansion (green background): Market trending/expanding; core line indicates direction.
Contraction (blue background): Market range-bound; orange dots indicate compression.
Spike (red background): High volatility; visual alert only.
Labels & Signals:
Labels highlight potential regime moves; not trade advice.
Combine colors, core/band positions, and label cues with your own analysis.
Core Line & Bands:
Core line shows central reference per regime.
Upper/lower bands provide context for potential support/resistance zones.
Orange Dots:
Indicate compressions or regime-specific signals; visual only.
Gamma Exposure & Zero Gamma Flip (Optional):
Illustrates potential price sensitivity; charting/educational use only.
Important:
Protected code; underlying calculations are not visible.
For educational and visual guidance only; not financial or trading advice.
Works on any timeframe; free edition gives visual regime insights.
Liquidity Pulse Oscillator LITETitle:
Liquidity Pulse Oscillator LITE
Description:
This indicator provides an observational view of market activity by measuring intra-bar price and volume dynamics. It is fully informational and educational, and does not constitute financial, trading, or investment advice.
Key Features:
Fast and Slow Pulse lines: Dual EMAs of volume-weighted pressure to highlight crossover points.
Histogram: Displays the difference between fast and slow pulses with color-coded bars (green for positive, red for negative).
Scaled 0–100 line: Provides a normalized perspective for easier interpretation of relative activity levels.
EXP/CON markers: Indicate expansions and contractions in observed market activity.
How It Works:
Pressure is calculated as the absolute open-to-close movement divided by the candle range, multiplied by volume. Safeguards handle zero-range bars. The resulting values are smoothed using fast and slow EMAs. Crossovers generate EXP and CON markers, helping users visualize changes in market activity.
Why This Approach:
Traditional volume indicators often overlook intra-bar dynamics and range normalization. This oscillator emphasizes price movement relative to bar range combined with volume, offering an additional perspective on shifts in market activity.
How to Use:
EXP marker + positive histogram: Indicates potential expansion in observed market activity.
CON marker + negative histogram: Indicates potential contraction in observed market activity.
Can be applied on any timeframe to help confirm breakouts, reversals, or shifts in market behavior.
Notes:
For informational and educational purposes only. Not financial advice.

Flow Dynamics Pro [ChartNation]Flow Dynamics Pro - Institutional Order Flow Zones
Detect high-probability institutional rejection zones with advanced volume analysis and confluence scoring.
Flow Dynamics Pro identifies institutional order flow zones where smart money enters and defends positions. Unlike traditional order blocks or supply/demand indicators, this tool combines multiple confirmation factors into a single confluence score, helping you focus on the highest-quality setups.
🎯 KEY FEATURES
Institutional Zone Detection
Volume spike analysis (customizable threshold)
Rejection wick detection (upper/lower wick ratios)
Market structure validation (swing high/low alignment)
Multi-factor confluence scoring (0-100 scale)
Visual Volume Distribution
Bull/bear volume split displayed inside each zone
See the exact buying vs selling pressure at institutional levels
Percentage breakdowns for quick analysis
Toggle on/off based on preference
Smart Zone Management
Automatic zone invalidation when broken with volume
Zone test tracking (shows how many times zones held)
Visual strengthening (borders thicken after successful tests)
Overlap prevention (maintains minimum spacing between zones)
Maximum zone limit (keeps chart clean)
Confluence Scoring System
Zones are scored 0-100 based on:
Volume Strength (30 points) - How significant was the volume spike
Market Structure (25 points) - Alignment with swing points
Zone Quality (25 points) - Wick ratio and pressure imbalance
Size Quality (20 points) - Optimal zone size relative to ATR
Zones are categorized as:
⚡ PREMIUM (80+) - Highest quality setups
🔥 STRONG (60-79) - Solid institutional zones
✓ MODERATE (40-59) - Valid but lower confluence
Timeframe Adaptive
Automatically adjusts detection sensitivity based on timeframe:
On 1H and lower: Stricter requirements (reduces noise)
On 4H and higher: Standard sensitivity (catches major zones)
Works on all timeframes from 1-minute to Monthly
Multi-Timeframe Context
Display higher timeframe zones for broader market context
Customizable HTF timeframe selection
Dashed visualization to distinguish from current timeframe zones
Comprehensive Alerts
Premium zone created (score 80+)
Price entering zone
Price exiting zone
Zone tested successfully
Zone invalidated
⚙️ SETTINGS OVERVIEW
Detection Settings
Volume Spike Threshold (default: 1.2x)
Minimum Wick Ratio (default: 0.3)
Structure Validation toggle
Detection Lookback period
Invalidation Settings
Require volume for invalidation (toggle)
Invalidation volume threshold (default: 1.2x)
Customizable to match your trading style
Display Settings
Maximum zones to display (default: 8)
Show/hide labels
Show/hide volume data
Volume distribution toggle
Label size adjustment (Small/Normal/Large)
Minimum zone spacing % (prevents overlaps)
Minimum confluence score filter (default: 55)
Visual Customization
Bullish zone color and opacity
Bearish zone color and opacity
Border colors
Multi-timeframe zone colors
📊 HOW TO USE
For Swing Traders (4H, Daily)
Focus on PREMIUM zones (score 80+)
Look for zones with multiple successful tests
Enter on retests with confirmation
Use HTF zones for broader context
For Intraday Traders (1H, 15m)
Use higher confluence minimum (60-65)
Increase zone spacing to reduce clutter
Focus on zones with clear volume distribution
Combine with price action for entries
Zone Test Interpretation
Tested 0x: Fresh zone, untested
Tested 1-2x: Gaining strength
Tested 3+x: Highly defended level (thicker borders)
Volume Distribution Guide
80%+ on one side: Strong directional bias
60-70% dominance: Moderate bias
50-50 split: Contested area, use caution
🔧 BEST PRACTICES
Combine with trend: Trade zones in direction of higher timeframe trend
Wait for confirmation: Don't enter blindly at zone touch
Respect invalidation: When zones break with volume, they're done
Use confluence scores: Prioritize scores 70+ for highest win rate
Manage spacing: Adjust spacing % if chart feels cluttered
Check timeframe: Lower timeframes may need stricter settings
🎓 UNDERSTANDING THE INDICATOR
What are Institutional Zones?
Areas where large players (institutions, market makers, smart money) have entered positions and actively defend them. These show up as:
High volume rejection wicks
Multiple tests that hold
Clear buying/selling pressure imbalance
Why Confluence Scoring?
Not all zones are equal. The 0-100 scoring system helps you quickly identify which zones have the most confirmation factors aligned, saving time and improving trade selection.
Why Zone Spacing Matters
Too many overlapping zones create analysis paralysis. The spacing filter ensures you see only distinct, meaningful levels.
📈 TECHNICAL DETAILS
Indicator Type: Overlay
Max Boxes: 500
Max Labels: 500
Pine Script Version: 6
Real-time Updates: Yes
Alerts: 5 types available
Repainting: Zones finalize on bar close
🚀 GET STARTED
Add indicator to chart
Adjust confluence minimum (55-65 recommended)
Set volume threshold for your instrument (1.2-1.5)
Customize colors to match your theme
Enable alerts for your preferred signals
Trade with proper risk management
💡 TIPS
Start with default settings and adjust based on results
Higher timeframes = more reliable zones
Premium zones (80+) have best risk/reward
Tested zones (3+) show strong institutional defense
Use zone invalidation as stop-loss reference
Flow Dynamics Pro is part of the ChartNation indicator suite - delivering institutional-grade tools for serious traders.

VMDM - Volume, Momentum & Divergence Master [BullByte]VMDM - Volume, Momentum and Divergence Master
Educational Multi-Layer Market Structure Analysis System
Multi-factor divergence engine that scores RSI momentum, volume pressure, and institutional footprints into one non-repainting confluence rating (0-100).
WHAT THIS INDICATOR IS
VMDM is an educational indicator designed to teach traders how to recognize high-probability reversal and continuation patterns by analyzing four independent market dimensions simultaneously. Instead of relying on a single indicator that may produce frequent false signals, VMDM creates a confluence-based scoring system that weights multiple confirmation factors, helping you understand which setups have stronger technical backing and which are lower quality.
This is NOT a trading system or signal generator. It is a learning tool that visualizes complex market structure concepts in an accessible format for both coders and non-coders.
THE PROBLEM IT SOLVES
Most traders face these common challenges:
Challenge 1 - Indicator Overload: Running RSI, volume analysis, and divergence detection separately creates chart clutter and conflicting signals. You waste time cross-referencing multiple windows trying to determine if all factors align.
Challenge 2 - False Divergences: Standard divergence indicators trigger on every minor pivot, creating noise. Many divergences fail because they lack supporting evidence from volume or market structure.
Challenge 3 - Missed Context: A bullish RSI divergence means nothing if it occurs during weak volume or in the middle of strong distribution. Context determines quality.
Challenge 4 - Repainting Confusion: Many divergence scripts repaint, showing perfect historical signals that never actually triggered in real-time, leading to false confidence.
Challenge 5 - Institutional Pattern Recognition: Absorption zones, stop hunts, and exhaustion patterns are taught in trading education but difficult to identify systematically without manual analysis.
VMDM addresses all five challenges by combining complementary analytical layers into one transparent, non-repainting, confluence-weighted system with visual clarity.
WHY THIS SPECIFIC COMBINATION - MASHUP JUSTIFICATION
This indicator is NOT a random mashup of popular indicators. Each of the four layers serves a specific analytical purpose and together they create a complete market structure assessment framework.
THE FOUR ANALYTICAL LAYERS
LAYER 1 - RSI MOMENTUM DIVERGENCE (Trend Exhaustion Detection)
Purpose: Identifies when price momentum is weakening before price itself reverses.
Why RSI: The Relative Strength Index measures momentum on a bounded 0-100 scale, making divergence detection mathematically consistent across all assets and timeframes. Unlike raw price oscillators, RSI normalizes momentum regardless of volatility regime.
How It Contributes: Divergence between price pivots and RSI pivots reveals early momentum exhaustion. A lower price low with a higher RSI low (bullish regular divergence) signals sellers are losing strength even as price makes new lows. This is the PRIMARY signal generator in VMDM.
Limitation If Used Alone: RSI divergence by itself produces many false signals because momentum can remain weak during continued trends. It needs confirmation from volume and structural evidence.
LAYER 2 - VOLUME PRESSURE ANALYSIS (Buying vs Selling Intensity)
Purpose: Quantifies whether the current bar's volume reflects buying pressure or selling pressure based on where price closed within the bar's range.
Methodology: Instead of just measuring volume size, VMDM calculates WHERE in the bar range the close occurred. A close near the high on high volume indicates strong buying absorption. A close near the low indicates selling pressure. The calculation accounts for wick size (wicks reduce pressure quality) and uses percentile ranking over a lookback period to normalize pressure strength on a 0-100 scale.
Formula Concept:
Buy Pressure = Volume × (Close - Low) / (High - Low) × Wick Quality Factor
Sell Pressure = Volume × (High - Close) / (High - Low) × Wick Quality Factor
Net Pressure = Buy Pressure - Sell Pressure
Pressure Strength = Percentile Rank of Net Pressure over lookback period
Why Percentile Ranking: Absolute volume varies by asset and session. Percentile ranking makes 85th percentile pressure on low-volume crypto comparable to 85th percentile pressure on high-volume forex.
How It Contributes: When a bullish divergence occurs at a pivot low AND pressure strength is above 60 (strong buying), this adds 25 confluence points. It confirms that the divergence is occurring during actual accumulation, not just weak selling.
Limitation If Used Alone: Pressure analysis shows current bar intensity but cannot identify trend exhaustion or reversal timing. High buying pressure can exist during a strong uptrend with no reversal imminent.
LAYER 3 - BEHAVIORAL FOOTPRINT PATTERNS (Volume Anomaly Detection)
CRITICAL DISCLAIMER: The terms "institutional footprint," "absorption," "stop hunt," and "exhaustion" used in this indicator are EDUCATIONAL LABELS for specific price and volume behavioral patterns. These patterns are detected through technical analysis of publicly available price, volume, and bar structure data. This indicator does NOT have access to actual institutional order flow, market maker data, broker stop-loss locations, or any non-public data source. These pattern names are used because they are common terminology in trading education to describe these technical behaviors. The analysis is interpretive and based on observable price action, not privileged information.
Purpose: Detect volume anomalies and price patterns that historically correlate with potential reversal zones or trend continuation failure.
Pattern Type 1 - Absorption (Labeled as "ACCUMULATION" or "DISTRIBUTION")
Detection Criteria: Volume is more than 2x the moving average AND bar range is less than 50 percent of the average bar range.
Interpretation: High volume compressed into a tight range suggests large participants are absorbing supply (accumulation) or distribution (distribution) without allowing price to move significantly. This often precedes directional moves once absorption completes.
Visual: Colored box zone highlighting the absorption area.
Pattern Type 2 - Stop Hunt (Labeled as "BULL HUNT" or "BEAR HUNT")
Detection Criteria: Price penetrates a recent 10-bar high or low by a small margin (0.2 percent), then closes back inside the range on above-average volume (1.5x+).
Interpretation: Price briefly spikes beyond recent structure (likely triggering stop losses placed just beyond obvious levels) then reverses. This is a classic false breakout pattern often seen before reversals.
Visual: Label at the wick extreme showing hunt direction.
Pattern Type 3 - Exhaustion (Labeled as "SELL EXHAUST" or "BUY EXHAUST")
Detection Criteria: Lower wick is more than 2.5x the body size with volume above 1.8x average and RSI below 35 (sell exhaustion), OR upper wick more than 2.5x body size with volume above 1.8x average and RSI above 65 (buy exhaustion).
Interpretation: Large wicks with high volume and extreme RSI suggest aggressive buying or selling was met with equally aggressive rejection. This exhaustion often marks short-term extremes.
Visual: Label showing exhaustion type.
How These Contribute: When a divergence forms at a pivot AND one of these behavioral patterns is active, the confluence score increases by 20 points. This confirms the divergence is occurring during structural anomaly activity, not just normal price flow.
Limitation If Used Alone: These patterns can occur mid-trend and do not indicate direction without momentum context. Absorption in a strong uptrend may just be continuation accumulation.
LAYER 4 - CONFLUENCE SCORING MATRIX (Quality Weighting System)
Purpose: Translate all detected conditions into a single 0-100 quality score so you can objectively compare setups.
Scoring Breakdown:
Divergence Present: +30 points (primary signal)
Pressure Confirmation: +25 points (volume supports direction)
Behavioral Footprint Active: +20 points (structural anomaly present)
RSI Extreme: +15 points (RSI below 30 or above 70 at pivot)
Volume Spike: +10 points (current volume above 1.5x average)
Maximum Possible Score: 100 points
Why These Weights: The weights reflect reliability hierarchy based on backtesting observation. Divergence is the core signal (30 points), but without volume confirmation (25 points) many fail. Behavioral patterns add meaningful context (20 points). RSI extremes and volume spikes are secondary confirmations (15 and 10 points).
Quality Tiers:
90-100: TEXTBOOK (all factors aligned)
75-89: HIGH QUALITY (strong confluence)
60-74: VALID (meets minimum threshold)
Below 60: DEVELOPING (not displayed unless threshold lowered)
How It Contributes: The confluence score allows you to filter noise. You can set your minimum quality threshold in settings. Higher thresholds (75+) show fewer but higher-quality patterns. Lower thresholds (50-60) show more patterns but include lower-confidence setups. This teaches you to distinguish strong setups from weak ones.
Limitation: Confluence scoring is historical observation-based, not predictive guarantee. A 95-point setup can still fail. The score represents technical alignment, not future certainty.
WHY THIS COMBINATION WORKS TOGETHER
Each layer addresses a limitation in the others:
RSI Divergence identifies WHEN momentum is exhausting (timing)
Volume Pressure confirms WHETHER the exhaustion is accompanied by opposite-side accumulation (confirmation)
Behavioral Footprint shows IF structural anomalies support the reversal hypothesis (context)
Confluence Scoring weights ALL factors into an objective quality metric (filtering)
Using only RSI divergence gives you timing without confirmation. Using only volume pressure gives you intensity without directional context. Using only pattern detection gives you anomalies without trend exhaustion context. Using all four together creates a complete analytical framework where each layer compensates for the others' weaknesses.
This is not a mashup for the sake of combining indicators. It is a structured analytical system where each component has a defined role in a multi-dimensional market assessment process.
HOW TO READ THE INDICATOR - VISUAL ELEMENTS GUIDE
VMDM displays up to five visual layer types. You can enable or disable each layer independently in settings under "Visual Layers."
VISUAL LAYER 1 - MARKET STRUCTURE (Pivot Points and Lines)
What You See:
Small labels at swing highs and lows marked "PH" (Pivot High) and "PL" (Pivot Low) with horizontal dashed lines extending right from each pivot.
What It Means:
These are CONFIRMED pivots, not real-time. A pivot low appears AFTER the required right-side confirmation bars pass (default 3 bars). This creates a delay but prevents repainting. The pivot only appears once it is mathematically confirmed.
The horizontal lines represent support (from pivot lows) and resistance (from pivot highs) levels where price previously found significant rejection.
Color Coding:
Green label and line: Pivot Low (potential support)
Red label and line: Pivot High (potential resistance)
How To Use:
These pivots are the foundation for divergence detection. Divergence is only calculated between confirmed pivots, ensuring all signals are non-repainting. The lines help you see historical structure levels.
VISUAL LAYER 2 - PRESSURE ZONES (Background Color)
What You See:
Subtle background color shading on bars - light green or light red tint.
What It Means:
This visualizes volume pressure strength in real-time.
Color Coding:
Light Green Background: Pressure Strength above 70 (strong buying pressure - price closing near highs on volume)
Light Red Background: Pressure Strength below 30 (strong selling pressure - price closing near lows on volume)
No Color: Neutral pressure (pressure between 30-70)
How To Use:
When a bullish divergence pattern appears during green pressure zones, it suggests the divergence is forming during accumulation. When a bearish divergence appears during red zones, distribution is occurring. Pressure zones help you filter divergences - those forming in supportive pressure environments have higher probability.
VISUAL LAYER 3 - DIVERGENCE LINES (Dotted Connectors)
What You See:
Dotted lines connecting two pivot points (either two pivot lows or two pivot highs).
What It Means:
A divergence has been detected between those two pivots. The line connects the price pivots where RSI showed opposite behavior.
Color Coding:
Bright Green Line: Bullish divergence (regular or hidden)
Bright Red Line: Bearish divergence (regular or hidden)
How To Use:
The divergence line appears ONLY after the second pivot is confirmed (delayed by right-side confirmation bars). This is intentional to prevent repainting. When you see the line appear, it means:
For Bullish Regular Divergence:
Price made a lower low (second pivot lower than first)
RSI made a higher low (RSI at second pivot higher than first)
Interpretation: Downtrend losing momentum
For Bullish Hidden Divergence:
Price made a higher low (second pivot higher than first)
RSI made a lower low (RSI at second pivot lower than first)
Interpretation: Uptrend continuation likely (pullback within uptrend)
For Bearish Regular Divergence:
Price made a higher high (second pivot higher than first)
RSI made a lower high (RSI at second pivot lower than first)
Interpretation: Uptrend losing momentum
For Bearish Hidden Divergence:
Price made a lower high (second pivot lower than first)
RSI made a higher high (RSI at second pivot higher than first)
Interpretation: Downtrend continuation likely (bounce within downtrend)
If "Show Consolidated Analysis Label" is disabled, a small label will appear on the divergence line showing the divergence type abbreviation.
VISUAL LAYER 4 - BEHAVIORAL FOOTPRINT MARKERS
What You See:
Boxes, labels, and markers at specific bars showing pattern detection.
ABSORPTION ZONES (Boxes):
Colored rectangular boxes spanning one or more bars.
Purple Box: Accumulation absorption zone (high volume, tight range, bullish close)
Red Box: Distribution absorption zone (high volume, tight range, bearish close)
If absorption continues for multiple consecutive bars, the box extends and a counter appears in the label showing how many bars the absorption lasted.
What It Means: Large volume is being absorbed without significant price movement. This often precedes directional breakouts once the absorption phase completes.
STOP HUNT MARKERS (Labels):
Small labels below or above wicks labeled "BULL HUNT" or "BEAR HUNT" (may show bar count if consecutive).
What It Means:
BULL HUNT : Price spiked below recent lows then reversed back up on volume - likely triggered sell stops before reversing
BEAR HUNT : Price spiked above recent highs then reversed back down on volume - likely triggered buy stops before reversing
EXHAUSTION MARKERS (Labels):
Labels showing "SELL EXHAUST" or "BUY EXHAUST."
What It Means:
SELL EXHAUST : Large lower wick with high volume and low RSI - aggressive selling met with strong rejection
BUY EXHAUST : Large upper wick with high volume and high RSI - aggressive buying met with strong rejection
How To Use:
These markers help you identify WHERE structural anomalies occurred. When a divergence signal appears AT THE SAME TIME as one of these patterns, the confluence score increases. You are looking for alignment - divergence + behavioral pattern + pressure confirmation = high-quality setup.
VISUAL LAYER 5 - CONSOLIDATED ANALYSIS LABEL (Main Pattern Signal)
What You See:
A large label appearing at pivot points (or in real-time mode, at current bar) containing full pattern analysis.
Label Appearance:
Depending on your "Use Compact Label Format" setting:
COMPACT MODE (Single Line):
Example: "BULLISH REGULAR | Q:HIGH QUALITY C:82"
Breakdown:
BULLISH REGULAR: Divergence type detected
Q:HIGH QUALITY: Pattern quality tier
C:82: Confluence score (82 out of 100)
FULL MODE (Multi-Line Detailed):
Example:
PATTERN DETECTED
-------------------
BULLISH REGULAR
Quality: HIGH QUALITY
Price: Lower Low
Momentum: Higher Low
Signal: Weakening Downtrend
CONFLUENCE: 82/100
-------------------
Divergence: 30
Pressure: 25
Institutional: 20
RSI Extreme: 0
Volume: 10
Breakdown:
Top section: Pattern type and quality
Middle section: Divergence explanation (what price did vs what RSI did)
Bottom section: Confluence score with itemized breakdown showing which factors contributed
Label Position:
In Confirmed modes: Label appears AT the pivot point (delayed by confirmation bars)
In Real-time mode: Label appears at current bar as conditions develop
Label Color:
Gold: Textbook quality (90+ confluence)
Green: High quality (75-89 confluence)
Blue: Valid quality (60-74 confluence)
How To Use:
This is your primary decision-making label. When it appears:
Check the divergence type (regular divergences are reversal signals, hidden divergences are continuation signals)
Review the quality tier (textbook and high quality have better historical win rates)
Examine the confluence breakdown to see which factors are present and which are missing
Look at the chart context (trend, support/resistance, timeframe)
Use this information to assess whether the setup aligns with your strategy
The label does NOT tell you to buy or sell. It tells you a technical pattern has formed and provides the quality assessment. Your trading decision must incorporate risk management, market context, and your strategy rules.
UNDERSTANDING THE THREE DETECTION MODES
VMDM offers three signal detection modes in settings to accommodate different trading styles and learning objectives.
MODE 1: "Confluence Only (Real-Time)"
How It Works: Displays signals AS THEY DEVELOP on the current bar without waiting for pivot confirmation. The system calculates confluence score from pressure, volume, RSI extremes, and behavioral patterns. Divergence signals are NOT required in this mode.
Delay: ZERO - signals appear immediately.
Use Case: Real-time scanning for high-confluence zones without divergence requirement. Useful for intraday traders who want immediate alerts when multiple factors align.
Tradeoff: More frequent signals but includes setups without confirmed divergence. Higher false signal rate. Signals can change as the bar develops (not repainting in historical bars, but current bar updates).
Visual Behavior: Labels appear at the current bar. No divergence lines unless divergence happens to be present.
MODE 2: "Divergence + Confluence (Confirmed)" - DEFAULT RECOMMENDED
How It Works: Full system engagement. Signals appear ONLY when:
A pivot is confirmed (requires right-side confirmation bars to pass)
Divergence is detected between current pivot and previous pivot
Total confluence score meets or exceeds your minimum threshold
Delay: Equal to your "Pivot Right Bars" setting (default 3 bars). This means signals appear 3 bars AFTER the actual pivot formed.
Use Case: Highest-quality, non-repainting signals for swing traders and learners who want to study confirmed pattern completion.
Tradeoff: Delayed signals. You will not receive the signal until confirmation occurs. In fast-moving markets, price may have already moved significantly by the time the signal appears.
Visual Behavior: Labels appear at the historical pivot location (in the past). Divergence lines connect the two pivots. This is the most educational mode because it shows completed, confirmed patterns.
Non-Repainting Guarantee: Yes. Once a signal appears, it never disappears or changes.
MODE 3: "Divergence + Confluence (Relaxed)"
How It Works: Same as Confirmed mode but with adaptive thresholds. If confluence is very high (10 points above threshold), the signal may appear even if some factors are weak. If divergence is present but confluence is slightly below threshold (within 10 points), it may still appear.
Delay: Same as Confirmed mode (right-side confirmation bars).
Use Case: Slightly more signals than Confirmed mode for traders willing to accept near-threshold setups.
Tradeoff: More signals but lower average quality than Confirmed mode.
Visual Behavior: Same as Confirmed mode.
DASHBOARD GUIDE - READING THE METRICS
The dashboard appears in the corner of your chart (position selectable in settings) and provides real-time market state analysis.
You can choose between four dashboard detail levels in settings: Off, Compact, Optimized (default), Full.
DASHBOARD ROW EXPLANATIONS
ROW 1 - Header Information
Left: Current symbol and timeframe
Center: "VMDM "
Right: Version number
ROW 2 - Mode and Delay
Shows which detection mode you are using and the signal delay.
Example: "CONFIRMED | Delay: 3 bars"
This reminds you that signals in confirmed mode appear 3 bars after the pivot forms.
ROW 3 - Market Regime
Format: "TREND UP HV" or "RANGING NV"
First Part - Trend State:
TREND UP: 20 EMA above 50 EMA with strong separation
TREND DOWN: 20 EMA below 50 EMA with strong separation
RANGING: EMAs close together, low trend strength
TRANSITION: Between trending and ranging states
Second Part - Volatility State:
HV: High Volatility (current ATR more than 1.3x the 50-bar average ATR)
NV: Normal Volatility (current ATR between 0.7x and 1.3x average)
LV: Low Volatility (current ATR less than 0.7x average)
Third Column: Volatility ratio (example: "1.45x" means current ATR is 1.45 times normal)
How To Use: Regime context helps you interpret signals. Reversal divergences are more reliable in ranging or transitional regimes. Continuation divergences (hidden) are more reliable in trending regimes. High volatility means wider stops may be needed.
ROW 4 - Pressure
Shows current volume pressure state.
Format: "BUYING | ██████████░░░░░░░░░"
States:
BUYING : Pressure strength above 60 (closes near highs)
SELLING : Pressure strength below 40 (closes near lows)
NEUTRAL : Pressure strength between 40-60
Bar Visualization: Each block represents 10 percentile points. A full bar (10 filled blocks) = 100th percentile pressure.
Color: Green for buying, red for selling, gray for neutral.
How To Use: When pressure aligns with divergence direction (bullish divergence during buying pressure), confluence is stronger.
ROW 5 - Volume and RSI
Format: "1.8x | RSI 68 | OB"
First Value: Current volume ratio (1.8x = volume is 1.8 times the moving average)
Second Value: Current RSI reading
Third Value: RSI state
OB: Overbought (RSI above 70)
OS: Oversold (RSI below 30)
Blank: Neutral RSI
How To Use: Volume spikes (above 1.5x) during divergence formation add confluence. RSI extremes at pivots add confluence.
ROW 6 - Behavioral Footprint
Format: "BULL HUNT | 2 bars"
Shows the most recent behavioral pattern detected and how long ago.
States:
ACCUMULATION / DISTRIBUTION: Absorption detected
BULL HUNT / BEAR HUNT: Stop hunt detected
SELL EXHAUST / BUY EXHAUST: Exhaustion detected
SCANNING: No recent pattern
NOW: Pattern is active on current bar
How To Use: When footprint activity is recent (within 50 bars) or active now, it adds context to divergence signals forming in that area.
ROW 7 - Current Pattern
Shows the divergence type currently detected (if any).
Examples: "BULLISH REGULAR", "BEARISH HIDDEN", "Scanning..."
Quality: Shows pattern quality (TEXTBOOK, HIGH QUALITY, VALID)
How To Use: This tells you what type of signal is active. Regular divergences are reversal setups. Hidden divergences are continuation setups.
ROW 8 - Session Summary
Format: "14 events | A3 H8 E3"
First Value: Total institutional events this session
Breakdown:
A: Absorption events
H: Stop hunt events
E: Exhaustion events
How To Use: High event counts suggest an active, volatile session with frequent structural anomalies. Low counts suggest quiet, orderly price action.
ROW 9 - Confluence Score (Optimized/Full mode only)
Format: "78/100 | ████████░░"
Shows current real-time confluence score even if no pattern is confirmed yet.
How To Use: Watch this in real-time to see how close you are to pattern formation. When it exceeds your threshold and divergence forms, a signal will appear (after confirmation delay).
ROW 10 - Patterns Studied (Optimized/Full mode only)
Format: "47 patterns | 12 bars ago"
First Value: Total confirmed patterns detected since chart loaded
Second Value: How many bars since the last confirmed pattern appeared
How To Use: Helps you understand pattern frequency on your selected symbol and timeframe. If many bars have passed since last pattern, market may be trending without reversal opportunities.
ROW 11 - Bull/Bear Ratio (Optimized/Full mode only)
Format: "28:19 | BULL"
Shows count of bullish vs bearish patterns detected.
Balance:
BULL: More bullish patterns detected (suggests market has had more bullish reversals/continuations)
BEAR: More bearish patterns detected
BAL: Equal counts
How To Use: Extreme imbalances can indicate directional bias in the studied period. A heavily bullish ratio in a downtrend might suggest frequent failed rallies (bearish continuation). Context matters.
ROW 12 - Volume Ratio Detail (Optimized/Full mode only)
Shows current volume vs average volume in absolute terms.
Example: "1.4x | 45230 / 32300"
How To Use: Confirms whether current activity is above or below normal.
ROW 13 - Last Institutional Event (Full mode only)
Shows the most recent institutional pattern type and how many bars ago it occurred.
Example: "DISTRIBUTION | 23 bars"
How To Use: Tracks recency of last anomaly for context.
SETTINGS GUIDE - EVERY PARAMETER EXPLAINED
PERFORMANCE SECTION
Enable All Visuals (Master Toggle)
Default: ON
What It Does: Master kill switch for ALL visual elements (labels, lines, boxes, background colors, dashboard). When OFF, only plot outputs remain (invisible unless you open data window).
When To Change: Turn OFF on mobile devices, 1-second charts, or slow computers to improve performance. You can still receive alerts even with visuals disabled.
Impact: Dramatic performance improvement when OFF, but you lose all visual feedback.
Maximum Object History
Default: 50 | Range: 10-100
What It Does: Limits how many of each object type (labels, lines, boxes) are kept in memory. Older objects beyond this limit are deleted.
When To Change: Lower to 20-30 on fast timeframes (1-minute charts) to prevent slowdown. Increase to 100 on daily charts if you want more historical pattern visibility.
Impact: Lower values = better performance but less historical visibility. Higher values = more history visible but potential slowdown on fast timeframes.
Alert Cooldown (Bars)
Default: 5 | Range: 1-50
What It Does: Minimum number of bars that must pass before another alert of the same type can fire. Prevents alert spam when multiple patterns form in quick succession.
When To Change: Increase to 20+ on 1-minute charts to reduce noise. Decrease to 1-2 on daily charts if you want every pattern alerted.
Impact: Higher cooldown = fewer alerts. Lower cooldown = more alerts.
USER EXPERIENCE SECTION
Show Enhanced Tooltips
Default: ON
What It Does: Enables detailed hover-over tooltips on labels and visual elements.
When To Change: Turn OFF if you encounter Pine Script compilation errors related to tooltip arguments (rare, platform-specific issue).
Impact: Minimal. Just adds helpful hover text.
MARKET STRUCTURE DETECTION SECTION
Pivot Left Bars
Default: 3 | Range: 2-10
What It Does: Number of bars to the LEFT of the center bar that must be higher (for pivot low) or lower (for pivot high) than the center bar for a pivot to be valid.
Example: With value 3, a pivot low requires the center bar's low to be lower than the 3 bars to its left.
When To Change:
Increase to 5-7 on noisy timeframes (1-minute charts) to filter insignificant pivots
Decrease to 2 on slow timeframes (daily charts) to catch more pivots
Impact: Higher values = fewer, more significant pivots = fewer signals. Lower values = more frequent pivots = more signals but more noise.
Pivot Right Bars
Default: 3 | Range: 2-10
What It Does: Number of bars to the RIGHT of the center bar that must pass for confirmation. This creates the non-repainting delay.
Example: With value 3, a pivot is confirmed 3 bars AFTER it forms.
When To Change:
Increase to 5-7 for slower, more confirmed signals (better for swing trading)
Decrease to 2 for faster signals (better for intraday, but still non-repainting)
Impact: Higher values = longer delay but more reliable confirmation. Lower values = faster signals but less confirmation. This setting directly controls your signal delay in Confirmed and Relaxed modes.
Minimum Confluence Score
Default: 60 | Range: 40-95
What It Does: The threshold score required for a pattern to be displayed. Patterns with confluence scores below this threshold are not shown.
When To Change:
Increase to 75+ if you only want high-quality textbook setups (fewer signals)
Decrease to 50-55 if you want to see more developing patterns (more signals, lower average quality)
Impact: This is your primary signal filter. Higher threshold = fewer, higher-quality signals. Lower threshold = more signals but includes weaker setups. Recommended starting point is 60-65.
TECHNICAL PERIODS SECTION
RSI Period
Default: 14 | Range: 5-50
What It Does: Lookback period for RSI calculation.
When To Change:
Decrease to 9-10 for faster, more sensitive RSI that detects shorter-term momentum changes
Increase to 21-28 for slower, smoother RSI that filters noise
Impact: Lower values make RSI more volatile (more frequent extremes and divergences). Higher values make RSI smoother (fewer but more significant divergences). 14 is industry standard.
Volume Moving Average Period
Default: 20 | Range: 10-200
What It Does: Lookback period for calculating average volume. Current volume is compared to this average to determine volume ratio.
When To Change:
Decrease to 10-14 for shorter-term volume comparison (more sensitive to recent volume changes)
Increase to 50-100 for longer-term volume comparison (smoother, less sensitive)
Impact: Lower values make volume ratio more volatile. Higher values make it more stable. 20 is standard.
ATR Period
Default: 14 | Range: 5-100
What It Does: Lookback period for Average True Range calculation used for volatility measurement and label positioning.
When To Change: Rarely needs adjustment. Use 7-10 for faster volatility response, 21-28 for slower.
Impact: Affects volatility ratio calculation and visual label spacing. Minimal impact on signals.
Pressure Percentile Lookback
Default: 50 | Range: 10-300
What It Does: Lookback period for calculating volume pressure percentile ranking. Your current pressure is ranked against the pressure of the last X bars.
When To Change:
Decrease to 20-30 for shorter-term pressure context (more responsive to recent changes)
Increase to 100-200 for longer-term pressure context (smoother rankings)
Impact: Lower values make pressure strength more sensitive to recent bars. Higher values provide more stable, long-term pressure assessment. Capped at 300 for performance reasons.
SIGNAL DETECTION SECTION
Signal Detection Mode
Default: "Divergence + Confluence (Confirmed)"
Options:
Confluence Only (Real-time)
Divergence + Confluence (Confirmed)
Divergence + Confluence (Relaxed)
What It Does: Selects which detection logic mode to use (see "Understanding The Three Detection Modes" section above).
When To Change: Use Confirmed for learning and non-repainting signals. Use Real-time for live scanning without divergence requirement. Use Relaxed for slightly more signals than Confirmed.
Impact: Fundamentally changes when and how signals appear.
VISUAL LAYERS SECTION
All toggles default to ON. Each controls visibility of one visual layer:
Show Market Structure: Pivot markers and support/resistance lines
Show Pressure Zones: Background color shading
Show Divergence Lines: Dotted lines connecting pivots
Show Institutional Footprint Markers: Absorption boxes, hunt labels, exhaustion labels
Show Consolidated Analysis Label: Main pattern detection label
Use Compact Label Format
Default: OFF
What It Does: Switches consolidated label between single-line compact format and multi-line detailed format.
When To Change: Turn ON if you find full labels too large or distracting.
Impact: Visual clarity vs. information density tradeoff.
DASHBOARD SECTION
Dashboard Mode
Default: "Optimized"
Options: Off, Compact, Optimized, Full
What It Does: Controls how much information the dashboard displays.
Off: No dashboard
Compact: 8 rows (essential metrics only)
Optimized: 12 rows (recommended balance)
Full: 13 rows (every available metric)
Dashboard Position
Default: "Top Right"
Options: Top Right, Top Left, Bottom Right, Bottom Left
What It Does: Screen corner where dashboard appears.
HOW TO USE VMDM - PRACTICAL WORKFLOW
STEP 1 - INITIAL SETUP
Add VMDM to your chart
Select your detection mode (Confirmed recommended for learning)
Set your minimum confluence score (start with 60-65)
Adjust pivot parameters if needed (default 3/3 is good for most timeframes)
Enable the visual layers you want to see
STEP 2 - CHART ANALYSIS
Let the indicator load and analyze historical data
Review the patterns that appear historically
Examine the confluence scores - notice which patterns had higher scores
Observe which patterns occurred during supportive pressure zones
Notice the divergence line connections - understand what price vs RSI did
STEP 3 - PATTERN RECOGNITION LEARNING
When a consolidated analysis label appears:
Read the divergence type (regular or hidden, bullish or bearish)
Check the quality tier (textbook, high quality, or valid)
Review the confluence breakdown - which factors contributed
Look at the chart context - where is price relative to structure, trend, etc.
Observe the behavioral footprint markers nearby - do they support the pattern
STEP 4 - REAL-TIME MONITORING
Watch the dashboard for real-time regime and pressure state
Monitor the current confluence score in the dashboard
When it approaches your threshold, be alert for potential pattern formation
When a new pattern appears (after confirmation delay), evaluate it using the workflow above
Use your trading strategy rules to decide if the setup aligns with your criteria
STEP 5 - POST-PATTERN OBSERVATION
After a pattern appears:
Mark the level on your chart
Observe what price does after the pattern completes
Did price respect the reversal/continuation signal
What was the confluence score of patterns that worked vs. those that failed
Learn which quality tiers and confluence levels produce better results on your specific symbol and timeframe
RECOMMENDED TIMEFRAMES AND ASSET CLASSES
VMDM is timeframe-agnostic and works on any asset with volume data. However, optimal performance varies:
BEST TIMEFRAMES
15-Minute to 1-Hour: Ideal balance of signal frequency and reliability. Pivot confirmation delay is acceptable. Sufficient volume data for pressure analysis.
4-Hour to Daily: Excellent for swing trading. Very high-quality signals. Lower frequency but higher significance. Recommended for learning because patterns are clearer.
1-Minute to 5-Minute: Works but requires adjustment. Increase pivot bars to 5-7 for filtering. Decrease max object history to 30 for performance. Expect more noise.
Weekly/Monthly: Works but very infrequent signals. Increase confluence threshold to 70+ to ensure only major patterns appear.
BEST ASSET CLASSES
Forex Majors: Excellent volume data and clear trends. Pressure analysis works well.
Crypto (Major Pairs): Good volume data. High volatility makes divergences more pronounced. Works very well.
Stock Indices (SPY, QQQ, etc.): Excellent. Clean price action and reliable volume.
Individual Stocks: Works well on high-volume stocks. Low-volume stocks may produce unreliable pressure readings.
Commodities (Gold, Oil, etc.): Works well. Clear trends and reactions.
WHAT THIS INDICATOR CANNOT DO - LIMITATIONS
LIMITATION 1 - It Does Not Predict The Future
VMDM identifies when technical conditions align historically associated with potential reversals or continuations. It does not predict what will happen next. A textbook 95-confluence pattern can still fail if fundamental events, news, or larger timeframe structure override the setup.
LIMITATION 2 - Confirmation Delay Means You Miss Early Entry
In Confirmed and Relaxed modes, the non-repainting design means you receive signals AFTER the pivot is confirmed. Price may have already moved significantly by the time you receive the signal. This is the tradeoff for non-repainting reliability. You can use Real-time mode for faster signals but sacrifice divergence confirmation.
LIMITATION 3 - It Does Not Tell You Position Sizing or Risk Management
VMDM provides technical pattern analysis. It does not calculate stop loss levels, take profit targets, or position sizing. You must apply your own risk management rules. Never risk more than you can afford to lose based on a technical signal.
LIMITATION 4 - Volume Pressure Analysis Requires Reliable Volume Data
On assets with thin volume or unreliable volume reporting, pressure analysis may be inaccurate. Stick to major liquid assets with consistent volume data.
LIMITATION 5 - It Cannot Detect Fundamental Events
VMDM is purely technical. It cannot predict earnings reports, central bank decisions, geopolitical events, or other fundamental catalysts that can override technical patterns.
LIMITATION 6 - Divergence Requires Two Pivots
The indicator cannot detect divergence until at least two pivots of the same type have formed. In strong trends without pullbacks, you may go long periods without signals.
LIMITATION 7 - Institutional Pattern Names Are Interpretive
The behavioral footprint patterns are named using common trading education terminology, but they are detected through technical analysis, not actual institutional data access. The patterns are interpretations based on price and volume behavior.
CONCEPT FOUNDATION - WHY THIS APPROACH WORKS
MARKET PRINCIPLE 1 - Momentum Divergence Precedes Price Reversal
Price is the final output of market forces, but momentum (the rate of change in those forces) shifts first. When price makes a new low but the momentum behind that move is weaker (higher RSI low), it signals that sellers are losing strength even though they temporarily pushed price lower. This precedes reversal. This is a fundamental principle in technical analysis taught by Charles Dow, widely observed in market behavior.
MARKET PRINCIPLE 2 - Volume Reveals Conviction
Price can move on low volume (low conviction) or high volume (high conviction). When price makes a new low on declining volume while RSI shows improving momentum, it suggests the new low is not confirmed by participant conviction. Adding volume pressure analysis to momentum divergence adds a confirmation layer that filters false divergences.
MARKET PRINCIPLE 3 - Anomalies Mark Structural Extremes
When volume spikes significantly but range contracts (absorption), or when price spikes beyond structure then reverses (stop hunt), or when aggressive moves are met with large-wick rejection (exhaustion), these anomalies often mark short-term extremes. Combining these structural observations with momentum analysis creates context.
MARKET PRINCIPLE 4 - Confluence Improves Probability
No single technical factor is reliable in isolation. RSI divergence alone fails frequently. Volume analysis alone cannot time entries. Combining multiple independent factors into a weighted system increases the probability that observed patterns have structural significance rather than random noise.
THE EDUCATIONAL VALUE
By visualizing all four layers simultaneously and breaking down the confluence scoring transparently, VMDM teaches you to think in terms of multi-dimensional analysis rather than single-indicator reliance. Over time, you will learn to recognize these patterns manually and understand which combinations produce better results on your traded assets.
INSTITUTIONAL TERMINOLOGY - IMPORTANT CLARIFICATION
This indicator uses the following terms that are common in trading education:
Institutional Footprint
Absorption (Accumulation / Distribution)
Stop Hunt
Exhaustion
CRITICAL DISCLAIMER:
These terms are EDUCATIONAL LABELS for specific price action and volume behavior patterns detected through technical analysis of publicly available chart data (open, high, low, close, volume). This indicator does NOT have access to:
Actual institutional order flow or order book data
Market maker positions or intentions
Broker stop-loss databases
Non-public trading data
Proprietary institutional information
The patterns labeled as "institutional footprint" are interpretations based on observable price and volume behavior that educational trading literature often associates with potential large-participant activity. The detection is algorithmic pattern recognition, not privileged data access.
When this indicator identifies "absorption," it means it detected high volume within a small range - a condition that MAY indicate large orders being filled but is not confirmation of actual institutional participation.
When it identifies a "stop hunt," it means price briefly penetrated a structural level then reversed - a pattern that MAY have triggered stop losses but is not confirmation that stops were specifically targeted.
When it identifies "exhaustion," it means high volume with large rejection wicks - a pattern that MAY indicate aggressive participation meeting strong opposition but is not confirmation of institutional involvement.
These are technical analysis interpretations, not factual statements about market participant identity or intent.
DISCLAIMER AND RISK WARNING
EDUCATIONAL PURPOSE ONLY
This indicator is designed as an educational tool to help traders learn to recognize technical patterns, understand multi-factor analysis, and practice systematic market observation. It is NOT a trading system, signal service, or financial advice.
NO PERFORMANCE GUARANTEE
Past pattern behavior does not guarantee future results. A pattern that historically preceded price movement in one direction may fail in the future due to changing market conditions, fundamental events, or random variance. Confluence scores reflect historical technical alignment, not future certainty.
TRADING INVOLVES SUBSTANTIAL RISK
Trading financial instruments involves substantial risk of loss. You can lose more than your initial investment. Never trade with money you cannot afford to lose. Always use proper risk management including stop losses, position sizing, and portfolio diversification.
NO PREDICTIVE CLAIMS
This indicator does NOT predict future price movement. It identifies when technical conditions align in patterns that historically have been associated with potential reversals or continuations. Market behavior is probabilistic, not deterministic.
BACKTESTING LIMITATIONS
If you backtest trading strategies using this indicator, ensure you account for:
Realistic commission costs
Realistic slippage (difference between signal price and actual fill price)
Sufficient sample size (minimum 100 trades for statistical relevance)
Reasonable position sizing (risking no more than 1-2 percent of account per trade)
The confirmation delay inherent in the indicator (you cannot enter at the exact pivot in Confirmed mode)
Backtests that do not account for these factors will produce unrealistic results.
AUTHOR LIABILITY
The author (BullByte) is not responsible for any trading losses incurred using this indicator. By using this indicator, you acknowledge that all trading decisions are your sole responsibility and that you understand the risks involved.
NOT FINANCIAL ADVICE
Nothing in this indicator, its code, its description, or its visual outputs constitutes financial, investment, or trading advice. Consult a licensed financial advisor before making investment decisions.
FREQUENTLY ASKED QUESTIONS
Q: Why do signals appear in the past, not at the current bar
A: In Confirmed and Relaxed modes, signals appear at confirmed pivots, which requires waiting for right-side confirmation bars (default 3). This creates a delay but prevents repainting. Use Real-time mode if you want current-bar signals without pivot confirmation.
Q: Can I use this for automated trading
A: You can create alert-based automation, but understand that Confirmed mode signals appear AFTER the pivot with delay, so your entry will not be at the pivot price. Real-time mode signals can change as the current bar develops. Automation requires careful consideration of these factors.
Q: How do I know which confluence score to use
A: Start with 60. Observe which patterns work on your symbol/timeframe. If too many false signals, increase to 70-75. If too few signals, decrease to 55. Quality vs. quantity tradeoff.
Q: Do regular divergences mean I should enter a reversal trade immediately
A: No. Regular divergences indicate momentum exhaustion, which is a WARNING sign that trend may reverse, not a confirmation that it will. Use confluence score, market context, support/resistance, and your strategy rules to make entry decisions. Many divergences fail.
Q: What's the difference between regular and hidden divergence
A: Regular divergence = price and momentum move in opposite directions at extremes = potential reversal signal. Hidden divergence = price and momentum move in opposite directions during pullbacks = potential continuation signal. Hidden divergence suggests the pullback is just a correction within the larger trend.
Q: Why does the pressure zone color sometimes conflict with the divergence direction
A: Pressure is real-time current bar analysis. Divergence is confirmed pivot analysis from the past. They measure different things at different times. A bullish divergence confirmed 3 bars ago might appear during current selling pressure. This is normal.
Q: Can I use this on stocks without volume data
A: No. Volume is required for pressure analysis and behavioral pattern detection. Use only on assets with reliable volume reporting.
Q: How often should I expect signals
A: Depends on timeframe and settings. Daily charts might produce 5-10 signals per month. 1-hour charts might produce 20-30. 15-minute charts might produce 50-100. Adjust confluence threshold to control frequency.
Q: Can I modify the code
A: Yes, this is open source. You can modify for personal use. If you publish a modified version, please credit the original and ensure your publication meets TradingView guidelines.
Q: What if I disagree with a pattern's confluence score
A: The scoring weights are based on general observations and may not suit your specific strategy or asset. You can modify the code to adjust weights if you have data-driven reasons to do so.
Final Notes
VMDM - Volume, Momentum and Divergence Master is an educational multi-layer market analysis system designed to teach systematic pattern recognition through transparent, confluence-weighted signal detection. By combining RSI momentum divergence, volume pressure quantification, behavioral footprint pattern recognition, and quality scoring into a unified framework, it provides a comprehensive learning environment for understanding market structure.
Use this tool to develop your analytical skills, understand how multiple technical factors interact, and learn to distinguish high-quality setups from noise. Remember that technical analysis is probabilistic, not predictive. No indicator replaces proper education, risk management, and trading discipline.
Trade responsibly. Learn continuously. Risk only what you can afford to lose.
-BullByte

Smart Money Setup 08 [TradingFinder] Binary Options Gold Scalper🔵 Introduction
In the Smart Money methodology, the market is understood as a structure driven by liquidity flow. This structure forms through the movement of large orders, the accumulation of liquidity, and the reactions that occur around key price zones. The logic of Smart Money is based on the idea that price movement is not random and usually evolves with the intention of collecting liquidity and creating price inefficiencies known as imbalances.
Within this framework, several important stages including the liquidity sweep, the formation of a point of interest, the appearance of an imbalance and the transition of market structure play major roles and collectively define the broader direction of price.
In many bullish scenarios, the market begins by sweeping sell side liquidity and targeting important lows in order to collect the liquidity resting below them. This liquidity collection often becomes the starting point for creating a point of interest which usually marks the area where Smart Money begins to enter the market.
After price moves away from this point, it breaks a structural high and forms a change of character. This shift marks a transition in the balance of power between buyers and sellers and is considered the first clear signal that the market structure is changing.
After the change of character, new institutional order flow often creates a strong and rapid movement that leaves behind an imbalance. This imbalance is one of the most important elements in Smart Money analysis because price tends to return to this area in order to complete structure and restore balance.
The return into the imbalance becomes meaningful when it occurs together with the liquidity sweep, the presence of a validated point of interest and a confirmed structural transition. These conditions frequently mark the beginning of powerful movements within the Smart Money cycle.
Understanding the sequence of liquidity, point of interest, imbalance, change of character and market structure builds the foundation of Smart Money analysis and provides a clear view of the true direction of institutional strength.
Bullish Setup :
Bearish Setup :
🔵 How to Use
To use this framework effectively, the trader must analyze the market through the principles of Smart Money and observe how liquidity drives price. A trade becomes valid only when several essential components appear together in a clear and consistent order.
These components include the liquidity sweep, the formation of a point of interest, the confirmation of a change of character, the transition of market structure and the return of price into an imbalance. The method is built on the understanding that the market first collects liquidity, then shifts order flow and finally provides an entry opportunity inside an inefficient area or inside a point of interest.
For this reason, the trader must follow the path of liquidity from the moment the sweep occurs, through the point of interest and the change of character and finally into the return of price toward the imbalance. When applied correctly, this approach creates entries that are more precise, more structural and more aligned with the real behavior of the market rather than with superficial signals.
🟣 Long Position
A bullish setup in Smart Money structure begins with a liquidity sweep on the sell side. The market first targets the areas where sell side liquidity is located and collects the stops and resting liquidity under previous lows. This collection is the condition that Smart Money requires to begin creating a new order flow. After this liquidity has been taken, a point of interest forms which is usually the last bearish candle or the effective demand zone that initiated the upward movement.
Price then moves away from the point of interest and breaks a structural high which creates a change of character. This event confirms that the market structure has moved from a bearish state to a bullish one and that buying pressure has taken control of the order flow. Following this shift, a strong upward movement often occurs and creates an imbalance between candles. This imbalance reflects the entrance of strong Smart Money orders and is seen as an important confirmation of bullish strength.
When price returns to this imbalance after the displacement, the market enters a phase where Smart Money aims to complete the corrective movement and continue the upward direction. The reaction inside the imbalance when combined with the liquidity sweep, the confirmed point of interest and the change of character completes the bullish setup and forms a structure that often leads to a continuation of the bullish trend.
🟣 Short Position
A bearish setup follows the same Smart Money logic but in the opposite direction. The market begins by collecting buy side liquidity and targets the highs where buy side liquidity and resting stops are located. This liquidity sweep on the buy side becomes the starting phase for Smart Money to initiate a downward order flow. After the liquidity is collected, a bearish point of interest forms which is usually the last bullish candle or the supply zone that created the initial drop.
Price then moves away from this point and breaks the first structural low. This creates a change of character to the downside which confirms that the market structure has transitioned from bullish to bearish and that selling pressure has gained control. After this shift, a strong downward displacement appears and leaves behind a bearish imbalance that clearly shows the dominance of sellers.
As price returns to this imbalance and corrects the inefficient movement, the bearish setup becomes complete as long as the market structure remains bearish. The combination of the buy side liquidity sweep, the bearish point of interest, the change of character, the imbalance and the corrective return creates the ideal structure that Smart Money uses to continue the downward movement and develop a reliable selling opportunity.
🔵 Settings
🟣 Logic Settings
Pivot Period : Defines how many bars are analyzed to identify swing highs and lows. Higher values detect larger, slower structures, while lower values respond to faster patterns. The default value of 5 offers a balanced sensitivity.
🟣 Alert Settings
Alert : Enables alerts for SMS08.
Message Frequency : Determines the frequency of alerts. Options include 'All' (every function call), 'Once Per Bar' (first call within the bar), and 'Once Per Bar Close' (final script execution of the real-time bar). Default is 'Once per Bar'.
Show Alert Time by Time Zone : Configures the time zone for alert messages. Default is 'UTC'.
🔵 Conclusion
The Smart Money approach demonstrates that price movement is not random or based on surface level patterns. Instead, it develops through a clear cycle of liquidity collection, structural transition and corrective movement toward key price zones. By recognizing events such as the liquidity sweep, the formation of the point of interest, the change of character and the return into the imbalance, the trader gains the ability to understand order flow more accurately and identify the true direction of market structure.
Both bullish and bearish setups show that the alignment of these elements creates a transparent view of institutional behavior and reveals the source of strong movements in the market. When the trader correctly identifies this sequence, entry points become more reliable and more aligned with liquidity flow. The combination of liquidity, structure and imbalance provides a consistent framework that removes guesswork and guides decisions through the real logic of the market.

KVS-Ultimate FVG & iFVG System [MTF + Distance Filter]Description: This indicator identifies Fair Value Gaps (FVG) and Inversion FVGs (iFVG) across multiple timeframes (MTF) with an advanced visualization system. Unlike standard FVG indicators, this script solves the "chart clutter" problem with a unique Distance Filter and offers a customizable Split Label System.
Key Features:
1. Unique Distance Filter (Clean Screen Mode):
When enabled, the script only shows the closest FVGs to the current price within a user-defined limit.
Keeps your chart clean while focusing on relevant price action levels.
2. Split Label System (Tabular Design):
Completely customizable label positioning, sizing, and coloring.
Separate controls for Normal FVGs and iFVGs.
Smart Label Logic: If you hide the FVG box, its label automatically hides. If an FVG breaks and becomes an iFVG (or fades), the label logic switches automatically to the iFVG settings.
3. Strict Mode Filtering:
Enabled: Checks if the candle closing price effectively breaks the previous structure (High/Low of the 1st candle), ensuring high-quality gaps.
Disabled: Detects all gaps between wicks (Standard calculation).
4. Multi-Timeframe (MTF) Support:
Monitor FVGs from up to 5 different timeframes simultaneously on a single chart.
5. Dynamic Interaction:
Choose how the script reacts when an FVG is broken: Turn it into an iFVG (Inversion) or simply fade the color (Ghost/Fade mode).
How to Use:
Use the "Distance Filter" checkbox in settings to clean up old/far blocks.
Adjust "TF1" to "TF5" to set up your multi-timeframe analysis.
Customize the Label Panel to align text perfectly with your chart style.
Disclaimer: This tool is for educational purposes and support for technical analysis.

SIDD Table Volume multiframe (Modified)🚀 SIDD Volume Table – The Most Powerful Multi-Timeframe Volume Dashboard
Designed by Siddhartha Mukherjee (SIDD)
Free for the community.
Get an unfair edge with the cleanest, fastest, and most accurate multi-timeframe volume analyzer available on TradingView. This tool reveals where buyers and sellers are truly active across multiple timeframes—helping you confirm trends, avoid traps, and enter with confidence.
🔥 Why Traders Love This Indicator
✅ 1. Multi-Timeframe Volume Domination
Instantly view Buy% / Sell% / Total Volume for:
1m • 5m • 15m • 1H • 4H • 1D • 1W
Choose any combination you want!
✅ 2. Advanced Buy/Sell Volume Logic
Not simple volume…
This tool breaks it into:
Buy Volume% (green dominance)
Sell Volume% (red dominance)
Using candle structure (H-L-C), giving far more accurate pressure detection.
✅ 3. Realtime Candle Countdown
Never guess when a candle will close again.
Get:
Seconds (1m)
MM:SS (5m/15m/1H)
DD:HH:MM:SS (4H, 1D, 1W)
Perfect for scalpers, swing traders, and index traders.
✅ 4. Beautiful & Customizable Dashboard
Choose position anywhere on screen
Auto size or choose Tiny → Huge
Color-coded Bias (Green Buyers, Red Sellers)
Clean layout built for modern charts
Your chart stays clean while your data stays powerful.
💡 What This Helps You Identify
Where buyers are gaining strength
Where sellers are dominating
Multi-timeframe alignment (the key to big moves)
Real reversal pressure
Volume divergence across timeframes
Trend confirmation before breakouts
Perfect for:
NIFTY / BANKNIFTY / Stocks / Crypto / FX / Commodities
🧠 Who Should Use This?
Intraday traders
Swing traders
Options traders
Futures traders
Crypto scalpers
Professional volume analysts
If volume matters to you → this indicator becomes a must-have.
🛠 Built with Precision
Non-repainting
Multi-TF aligned
Fast + lightweight arrays
Uses BTC/ETH feed to stabilize ticks
Zero chart clutter
❤️ Free for Everyone
This tool is released 100% free to help the community trade with clarity and confidence.
Leave a like ⭐, comment 💬, or follow if you want more such institutional-grade tools.
⚠️ Disclaimer
This is for educational/analytical use only.
Not financial advice. Trade at your own risk.

QuantMotions - FVG with Volume TrackingFair Value Gap Detector with Dynamic Shrinking & Volume Analysis
Overview
Advanced Fair Value Gap (FVG) detection indicator with real-time box shrinking and volume delta analysis. Automatically identifies price inefficiencies and tracks institutional volume flow within each gap.
What are Fair Value Gaps?
Fair Value Gaps occur when price moves so rapidly that a "gap" is left between three consecutive candles, creating an inefficiency where no trading occurred. These gaps often act as support/resistance zones that price tends to revisit.
Detection:
- Bullish FVG: When low > high (upward price inefficiency)
- Bearish FVG: When high < low (downward price inefficiency)
Key Features
Dynamic Box Shrinking
FVG boxes automatically shrink as price enters them:
- Bullish FVGs shrink from top as price moves down into the gap
- Bearish FVGs shrink from bottom as price moves up into the gap
- Provides precise visualization of remaining unfilled gap area
Volume Delta Analysis
Tracks volume characteristics for the 3-candle FVG formation:
- Total Volume: Sum of volume from all three FVG candles
- Up/Down Split: Separates buying vs selling pressure
- Delta %: Shows directional bias of volume flow
- Color Coding: Green/Red when volume confirms direction, Orange when it doesn't
Smart Filtering
- ATR-based minimum gap size - Filters out insignificant noise gaps
- Auto-cleanup - Removes fully filled FVGs automatically
- Maximum display limit - Keeps charts clean by limiting visible FVGs
Live Statistics
Real-time stats table showing:
- Active bullish/bearish FVG count
- Average volume delta for each direction
- Fill progress tracking
Settings
Min Gap Size (ATR): Minimum gap size as multiple of ATR(14). Default: 0.3
- Lower values (0.1-0.3): More sensitive, shows smaller gaps
- Higher values (0.5-1.0): More selective, only significant gaps
Max FVGs: Maximum number of FVG boxes to display (5-100)
Remove Fully Filled: Automatically remove FVGs when price completely fills them
Shrink on Partial Fill: Enable dynamic box shrinking as price enters gaps
Show Volume Info: Display volume delta labels at box edges
How to Use
1. Confluence Trading: Look for FVGs that align with your support/resistance levels
2. Volume Confirmation: Check volume delta - strong directional volume increases probability
3. Partial Fills: Watch for price reactions at shrinking FVG boundaries
4. Multiple Timeframes: Use on higher timeframes (4H+) for swing trading, lower timeframes for scalping
Best Practices
- Combine with trend analysis - FVGs in trend direction have higher fill rates
- Pay attention to volume delta - gaps with confirming volume are more reliable
- Use on liquid markets for accurate volume data
- Higher timeframe FVGs typically carry more significance
Notes
- Works on all timeframes and instruments
- Volume data accuracy depends on your data provider
- FVGs are not guaranteed support/resistance - use proper risk management
- This indicator shows historical inefficiencies, not future predictions
Disclaimer: This indicator is for educational purposes only. Past performance does not guarantee future results. Always use proper risk management.

NeuraEdge Delta Flow Pro V1.0INSTITUTIONAL ORDER FLOW ANALYSIS
NeuraEdge Delta Flow Pro reveals the hidden battle between buyers and sellers that traditional indicators miss. While price shows you WHAT happened, Delta Flow shows you WHO won the fight.
═══════════════════════════════════════════════
⚡ WHAT MAKES THIS UNIQUE?
Unlike basic volume indicators that just show size, Delta Flow analyzes:
- Bar-by-bar order flow direction (buying vs selling pressure)
- Cumulative Volume Delta (CVD) for institutional accumulation/distribution tracking
- Normalized strength metrics (0-100%) for conviction measurement
- Hidden divergences that predict reversals before they happen
Most order flow tools require expensive data feeds. Delta Flow uses advanced price action algorithms to estimate institutional flow on ANY timeframe, ANY market - all within TradingView.
═══════════════════════════════════════════════
📊 VISUAL COMPONENTS
DELTA HISTOGRAM
- Green bars = Buying pressure dominates
- Red bars = Selling pressure dominates
- Bright colors = Strong conviction (>70% threshold)
- Faded colors = Weak/normal pressure
CVD LINE (Blue)
- Rising = Buyers accumulating (institutions buying dips)
- Falling = Sellers distributing (institutions selling rallies)
- Divergence from price = Early reversal warning
DIVERGENCE SIGNALS
- Green Triangle = Bullish divergence (price LL, delta HL)
- Red Triangle = Bearish divergence (price HH, delta LH)
REAL-TIME DASHBOARD
- Current delta state (Strong Buy/Sell/Neutral)
- Normalized strength percentage
- CVD trend direction
- 20-bar pressure statistics
═══════════════════════════════════════════════
🎯 HOW TO USE IT:
1. SIGNAL CONFIRMATION
Your indicator says BUY → Check delta → Green = Take it ✅ | Red = Skip ⚠️
2. DETECT WEAK MOVES
Price rallies but delta is red = Distribution (sellers unloading into strength)
Price drops but delta is green = Accumulation (buyers absorbing weakness)
3. SPOT REVERSALS EARLY
Divergence triangles often precede major turning points by several bars
4. GAUGE CONVICTION
Strong delta (bright colors) = High probability the move continues
Weak delta (near zero) = Chop zone, reduce size or stay flat
═══════════════════════════════════════════════
💎 WHY CLOSED SOURCE?
Delta Flow uses a proprietary calculation method developed through extensive testing to provide the most accurate order flow estimation possible within TradingView's data limitations.
The closed-source model protects the methodology and ensures consistent results for all users, while preventing modifications that could lead to confusion or misinterpretation of signals.
═══════════════════════════════════════════════
⚙️ CUSTOMIZABLE SETTINGS
DELTA CALCULATION
- 3 estimation methods (Price Action, Candle Body, Wick Weighted)
- Smoothing options (1-10 periods)
CUMULATIVE DELTA
- CVD line toggle
- Auto-reset period (0-100 bars, or never)
- Custom line color
DISPLAY OPTIONS
- Toggle histogram on/off
- Toggle divergence signals
- Toggle dashboard
- Custom buying/selling/neutral colors
THRESHOLDS
- Strong delta percentage (50-95%, default 70%)
- Threshold line display toggle
DIVERGENCES
- Pivot lookback length (2-15 bars)
- Sensitivity control
═══════════════════════════════════════════════
📊 REAL MARKET EXAMPLE: EXHAUSTION PATTERN
The chart above shows SPY on the 1-hour timeframe with two critical exhaustion points where Delta Flow provided early reversal warnings:
Exhaustion Point 1 (Left):
- Price: Made higher high
- Delta: RED bars (selling pressure)
- CVD: Falling (net sellers)
- Signal: Green divergence triangle
- Outcome: Reversal down
Exhaustion Point 2 (Right):
- Price: Pushed to new high
- Delta: RED bars persist (weak buyers)
- CVD: Continued bearish
- Signal: Red divergence triangle
- Outcome: Sharp decline
The Pattern:
When price makes new highs but delta remains negative with falling CVD, it indicates:
1. Institutional selling into retail buying
2. Weak hands driving price (exhaustion)
3. Smart money distributing (preparing for reversal)
The divergence triangles appeared BEFORE the major moves down, giving traders advance notice to either exit longs or prepare shorts.
This is why Delta Flow is most powerful when used to FILTER signals from other indicators - it reveals when rallies/selloffs lack conviction.
═══════════════════════════════════════════════
📈 BEST PRACTICES
✅ Use with your primary trading system as confirmation
✅ Works on all timeframes (best on 15m+)
✅ Most effective on liquid markets (major pairs, indices, popular crypto)
✅ Pay attention to CVD trend for bigger picture
✅ Divergences are powerful but wait for price confirmation
❌ Not a standalone system - designed for confluence
❌ Less reliable on low-volume instruments
❌ Avoid trading when delta is near zero (indecision zone)
═══════════════════════════════════════════════
🔔 ALERT SYSTEM
6 customizable alerts:
- Strong Buying Pressure
- Strong Selling Pressure
- Bullish Divergence
- Bearish Divergence
- Delta Flip Bullish
- Delta Flip Bearish
═══════════════════════════════════════════════
🎓 INCLUDED RESOURCES
Upon invite approval, you receive:
- Complete user guide (PDF)
═══════════════════════════════════════════════
⚠️ IMPORTANT NOTES
- This is an ESTIMATION of order flow based on price action and volume
- TradingView does not provide tick-by-tick data required for true order flow
- Works as a highly effective proxy for institutional pressure
- Designed for traders who understand order flow concepts
- Best results when combined with structure-based analysis
═══════════════════════════════════════════════
💬 TO REQUEST INVITE ACCESS FOR 7 DAYS TRIAL
write email to support@neura-edge.com with your username
═══════════════════════════════════════════════
💬 Questions or feedback? Leave a comment below.
🌐 Check out our full Indicator Suite: neura-edge.com/
📧 Support: support@neura-edge.com
INSTITUTIONAL PRECISION. RETAIL EXECUTION.

Đại Ka 3 ATR BandsĐại Ka 3 ATR Bands – The ultimate single-slot indicator that replaces three separate ATR plots.
Designed specifically for ICT/SMC traders in 2025:
• Light red band (±0.5 ATR) → fake moves, Judas Swing, Turtle Soup zone
• Gray band (±1.0 ATR) → normal price action
• Light green band (±2.0 ATR) → real displacement zone → Silver Bullet, SFT, high-probability entries
How to use:
– Price stuck inside red band → expect reversal/fakeout
– Price breaks and closes outside green band + volume spike → enter aggressively in that direction (85%+ win-rate inside Killzones)
Default ATR(14), subtle fills for instant visual filtering of real vs fake moves.
Perfect companion for Order Blocks, FVG, Breaker Blocks and NY/London Killzones.
Free forever – coded with love by Đại Ka & Vietnamese ICT crew.

TradeBeard Larry Williams A/D + Classic DivergenceName: TradeBeard – Larry Williams A/D + Classic Divergence
What it does:
This indicator plots a classic Larry Williams Accumulation/Distribution (A/D) line, using:
(Close−Open)/(High−Low)×Volume
It then looks at price swings vs. A/D swings and marks true Larry-style divergences:
Bull Div – Price makes a lower low, but the A/D line makes a higher low → buying pressure/accumulation.
Bear Div – Price makes a higher high, but the A/D line makes a lower high → selling pressure/distribution.
Lines are drawn between the two pivots on the A/D line, with a label at the most recent pivot.
How to use / read it:
Use on any timeframe; the logic is the same.
Look for Bull Div near potential bottoms as confirmation that smart money is quietly buying.
Look for Bear Div near potential tops as confirmation that smart money is unloading.
Settings:
Pivot left bars (price) / Pivot right bars (price)
Controls how “wide” a swing high/low must be.
1 / 1 ≈ very sensitive (ICT/Larry-style 3-bar swings).
Higher values = fewer but cleaner swings and fewer signals.
Show bullish divergences / Show bearish divergences
Turn each signal type on or off.
Bullish color (line + label) / Bearish color (line + label)
Color of the divergence lines and label background.
Bullish label text color / Bearish label text color
Text color inside the Bull Div / Bear Div labels.
That’s it: pure Larry Williams A/D flow, price-based pivots, and clean visual divergence signals, wrapped in a TradeBeard skin.
I hope this will help you in your trading.
// Disclaimer:
// This script is for educational and informational purposes only.
// Trading and investing involve risk. You are fully responsible for your own decisions,

Change in State of Delivery CISD [AlgoAlpha]🟠 OVERVIEW
This script tracks how price “changes delivery” after failed attempts to push in one direction. It builds swing levels from pivots, watches for those levels to be wicked, and then checks if price delivers cleanly in the opposite direction. When the pattern meets the script’s tolerance rules, it marks a Change in State of Delivery (CISD). These CISD levels are drawn as origin lines and are used to spot shifts in intent, failed pushes, and continuation attempts. A CISD becomes stronger when it forms after opposing liquidity is swept within a defined lookback.
🟠 CONCEPTS
The script first defines structure using swing highs/lows. These levels act as potential liquidity points. When price wicks through a swing, the script registers a mitigation event. After this, it looks for a reversal-style candle sequence: a failed push, followed by a counter-move strong enough to pass a tolerance ratio. This ratio compares how far price expanded away from the failed attempt versus the counter-move that followed. If the ratio is high enough, this becomes a CISD. The idea is simple: liquidity interaction sets context , and the tolerance logic identifies actual intent . CISD levels and sweep markers combine these two ideas into a clean map of where delivery flipped.
🟠 FEATURES
Liquidity tracking: marks swing highs/lows and updates them until expiry
Liquidity sweep confirmation when CISD aligns with recent mitigations
Alert conditions for all key events: mitigations, CISDs, and strong CISDs
🟠 USAGE
Setup : Add the script to your chart. Use it on any timeframe where swing behavior matters. Set the Swing Period for how wide a pivot must be. Set Noise Filter to control how strict the CISD detection is. Liquidity Lookback defines how recent a wick must be to confirm a sweep.
Read the chart : Origin lines mark where the CISD began. A green line signals bullish intent; a red line signals bearish intent. ▲ and ▼ shapes show CISDs that form after liquidity is swept, these mark strong signals for potential entry. Swing dots show recent swing highs/lows. Candle colors follow the latest CISD trend.
Settings that matter : Increasing Swing Period produces fewer but stronger swings. Raising Noise Filter requires cleaner counter-moves and reduces false CISDs. Liquidity Lookback controls how strict the sweep confirmation is. Expiry Bars decides how long swing levels remain active.

Volume-Confirmed FTR Zones [AlgoPoint]FTR Zone Indicator — Fail To Return Zones (With Volume Confirmation)
Advanced Smart Money Zone Detection for Institutional Orderflow
The FTR Zone Indicator is a professional-grade tool designed for traders who follow Smart Money Concepts (SMC), ICT methodologies, or institutional orderflow. It automatically detects Fail To Return Zones (FTR) — high-probability supply and demand areas formed after strong displacement moves.
By combining impulse detection, base identification, and volume confirmation, this indicator highlights zones where price is most likely to react, reverse, or mitigate shortly after structure breaks.
⸻
⭐ What Are FTR Zones?
FTR zones (Fail To Return zones) are price areas where:
1. A strong displacement / impulse candle is formed
2. That impulse originates from a small consolidation (base)
3. Price moves away aggressively
4. AND fails to return immediately to the origin area
These zones often indicate:
• Institutional orders
• Imbalance
• Hidden liquidity
• Origin of a trend leg
• High-probability mitigation points
This indicator fully automates the detection and visualization of such areas.
🔍 How the Indicator Works
1. Impulse Detection
The indicator identifies a valid impulse candle using:
• ATR-based bar range filter
• Trend-aligned candle body direction
• Optional volume confirmation
Only large, meaningful institutional candles qualify — filtering out noise.
2. Base Zone Identification
Before every impulse, the tool finds the micro-consolidation base using:
• Highest high of the last X bars
• Lowest low of the last X bars
This base becomes the potential FTR zone.
3. FTR Zone Creation
When a valid impulse is detected:
• Bullish impulse → Demand FTR zone
• Bearish impulse → Supply FTR zone
The zone is immediately drawn on the chart using box.new().
4. Zone Extension
Every zone continuously extends to the right as price evolves, allowing you to track:
• Mitigation
• Retests
• Reaction points
• Liquidity sweeps
5. Invalidation Logic
Zones automatically delete when violated:
• Demand zone invalid if close < zone low
• Supply zone invalid if close > zone high
This keeps the chart clean and helps focus only on active, high-value areas.
🎛️ Key Features
✔ Automatic FTR Zone Detection
Instantly identifies institutional origin zones based on real impulse and displacement.
✔ Volume-Based Filtering
Ensures only high-volume impulses (true institutional orders) create zones.
✔ Supply & Demand Coloring
• Bullish FTR → Demand Zone (Teal tone)
• Bearish FTR → Supply Zone (Red tone)
✔ Safe Zone Storage
Fault-tolerant logic ensures no array errors, invalid zones, or broken visuals.
✔ Auto-Extending Boxes
Real-time zone updates with precise historical mapping.
✔ Smart Invalidation
Zone is removed only when fully broken, preventing false signals.
✔ Clean, Non-Repainting Logic
Impulse detection and zone placement are confirmed only on bar close.
📈 How to Use It (Example Schenarios)
For Reversals or Continuations
• Look for price reacting or mitigating inside a zone
• Use as entry confirmation in trend continuations
• Combine with FVG, BOS/CHOCH, liquidity sweeps, or premium/discount zones
For Scalping or Intraday Trading
• High-probability countertrend entries
• Reaction-based setups at institutional footprints
For Swing Traders
• Identify weekly/daily origin zones
• Plan entries around large displacement points

Screener (SSA) [AlgoAlpha]🟠 OVERVIEW
This script is a multi-symbol screener that serves as a dashboard companion to the "Smart Signals Assistant (SSA)" indicator. Its purpose is to monitor the entire suite of SSA components—from the core signals to all confluence tools—across a customizable watchlist of up to 18 assets. By displaying the real-time status of each indicator in a single table, it allows traders to get a bird's-eye view of the market, quickly identify assets with strong trend confluence, and filter for high-probability setups without needing to switch charts.
The screener is designed to mirror the modularity of the main SSA indicator, allowing you to enable or disable components in the table to match your preferred trading dashboard.
🟠 CONCEPTS
The screener is built directly on the analytical framework of the Smart Signals Assistant, applying its complex, proprietary algorithms to each symbol in your watchlist and summarizing the results. The combination of these different analytical concepts is what gives the screener its utility, as it helps traders find opportunities where multiple, distinct strategies align.
Each column in the table represents a core trading concept:
Smart Signals: This is the primary signal engine, designed to identify potential entry points. It operates in different modes to capture both long-term swings and faster scalping opportunities.
Fair Value Trail (FVT): This component provides a dynamic, volatility-adjusted baseline for the trend. It acts as a form of dynamic support or resistance, helping to confirm the validity of a trend shown by the Smart Signals.
Trend Spine: This tool is designed to identify the underlying "backbone" of the market's trend. It filters out short-term price noise to provide a more stable, clear indication of the dominant market direction.
Trend Bias: This measures the strength and conviction behind a trend. It helps distinguish between a strong, accelerating move and a weak, decelerating one, adding a layer of momentum analysis.
Firmament Clouds: These are volatility-based bands that create dynamic overbought and oversold zones. They help identify when price is potentially overextended and due for a pullback or consolidation.
Trend-Range Classifier (TRC): A machine-learning model that analyzes market characteristics to classify the current environment as either "Trending" or "Ranging." This is crucial for helping traders apply the right strategy for the current conditions.
🟠 FEATURES
This screener organizes the complex data from the SSA indicator into a simple, color-coded table. Here is a breakdown of each column and its possible values:
Asset: Displays the ticker symbol for the asset being analyzed.
Smart Signals: Shows the latest signal from the core engine.
▲: A standard bullish signal has been detected.
▼: A standard bearish signal has been detected.
▲+: A strong bullish signal with higher conviction has been detected.
▼+: A strong bearish signal with higher conviction has been detected.
Fair Value Trail: Indicates the trend direction based on the volatility trail.
▲: The FVT is in a bullish trend (acting as dynamic support).
▼: The FVT is in a bearish trend (acting as dynamic resistance).
Trend Spine: Shows the direction of the core underlying trend.
▲: The underlying trend backbone is bullish.
▼: The underlying trend backbone is bearish.
Trend Bias: Measures the current momentum strength.
Strong▲: Strong and accelerating bullish momentum.
Weak▲: Bullish momentum exists but is weakening.
Strong▼: Strong and accelerating bearish momentum.
Weak▼: Bearish momentum exists but is weakening.
Firmament Clouds: Identifies overbought/oversold conditions relative to volatility.
Very Overbought / Overbought: Price is significantly extended above its recent range.
Very Oversold / Oversold: Price is significantly extended below its recent range.
Neutral: Price is trading within its normal volatility range.
Trend-Range Classifier: Displays the market state as determined by the ML model.
Trend: The market is in a trending environment, suitable for trend-following strategies.
Range: The market is in a ranging or consolidating environment, suitable for mean-reversion strategies.
Exit Signal Count: Tracks the number of take-profit signals that have occurred since the last primary Smart Signal.
0, 1, 2, 3...: A numerical count of exit signals. A higher number suggests a trend may be maturing or exhausting.
🟠 USAGE
The main purpose of the screener is to quickly identify assets where multiple components of the SSA system are in alignment, indicating a high-confluence trading opportunity.
1. Setup and Configuration:
Add the screener to your chart.
Go into the settings and populate the "Watchlist" group with the symbols you wish to monitor.
Ensure the settings for the components (Time Horizon, Signal Mode, etc.) are synchronized with the settings on your main SSA indicator for consistency.
2. Interpreting the Columns for Trading Decisions:
Start with the Big Picture (TRC): First, look at the "Trend-Range Classifier" column. If it shows "Trend," you should be looking for trend-following setups. If it shows "Range," you might avoid taking strong trend signals.
Establish Directional Bias (Spine & Bias): For trend-following, look for assets where the "Trend Spine" and "Trend Bias" agree. A "▲" in the Spine column combined with a "Strong▲" in the Bias column indicates a healthy and robust uptrend.
Time Your Entry (Smart Signals): Once you have an asset with a clear bias, watch the "Smart Signals" column for a fresh signal that aligns with that bias. A "▲+" signal appearing in an asset with a strong bullish bias across other columns is a high-confluence entry point.
Add Context (FVT & Clouds): Use the "Fair Value Trail" and "Firmament Clouds" to refine your entry. A buy signal is generally stronger if the FVT is also bullish ("▲") and the price is not in a "Very Overbought" state according to the clouds.
Manage the Trade (Exit Count): After entering a trade, keep an eye on the "Exit Signal Count." As the number increases, it serves as a warning that the trend is becoming extended and it might be time to take partial profits or tighten your stop-loss.
Paid script
