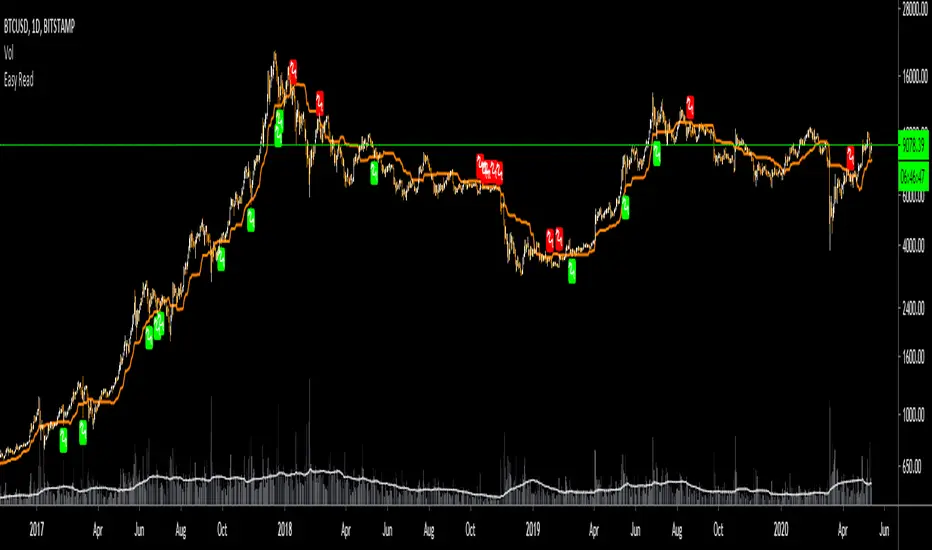
Easy Read_Combo IndicatorEasy Read is a combo indicator. It is designed to plot,
5 SMAs: 20, 50, 100, 144, 200 (with Golden and Death Cross)
6 EMAs: 21, 55, 89, 144, 200, 377 (with Golden and Death Cross)
2 Bollinger Bands with 1st and 2nd standard deviation and a 'Trend Line'
Cobra Indicator with cobra line and cobra buy/sell signals
Buy and take profit signals based on over bought levels in RSI and STOCH
The indicator is pretty straight forward to use. The buy-sell signal show you long/short entries and MAs will help you decide the take profit zone.
Smoothed Moving Average (SMMA)
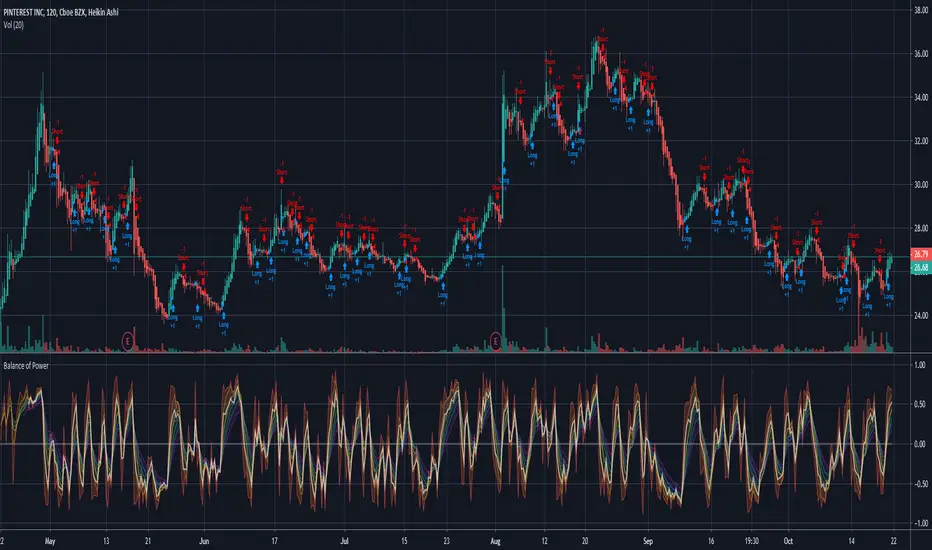
Balance of Power StrategyA simple variation on the balance of power idea, using a weighted moving average and a basic lookback to attempt to predict the motion in the next tick.
As far as a trading pattern goes, it's performance is rather conservative, and it is rather noisy as it doesn't do a good job of preventing quick, meaningless trades.
Yellow Brick Road with GuppyYellow Brick Road channel is institutional knowledge and application of based on price action. Coupled with Guppy it can be a great companion just as much as it can be used alone or with full guppy. Dean Malone who I also consider a GOAT provided traders this knowledge.

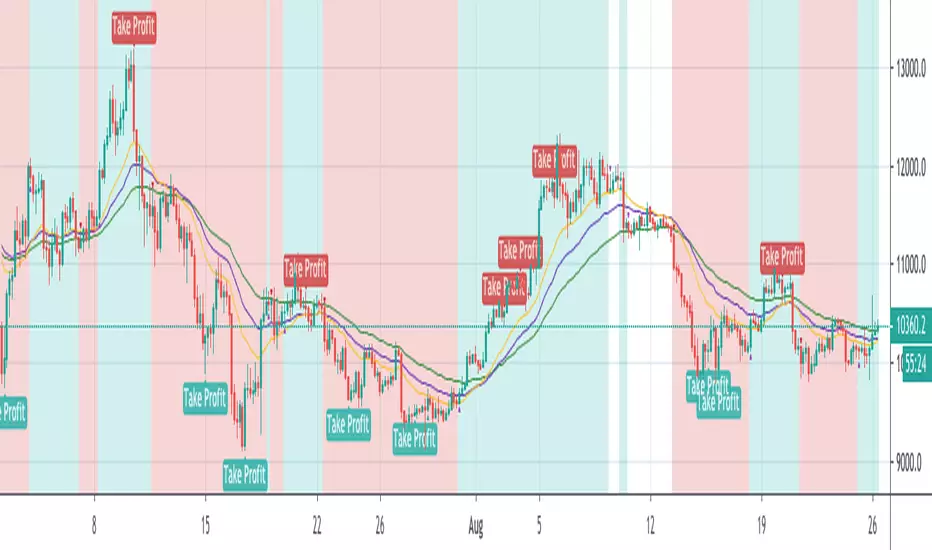
PD Crypto Performer PRO (Backtest)Description:
This is the backtesting version of the PD Crypto Performer Pro (Alert) . You can choose to backtest either one of the two strategies included, a trend-identifying swing strategy and a low risk scalping strategy. Both strategies assume the same capital amount invested ($10,000) each trade. You can also see how your capital grows over time by enabling the reinvesting proceeds option. For details, please check out this tutorial .
The backtesting results could be easily improved in live trading by utilizing the “Take Profit” signals and following the recommended methods of use below.
To assist the decision-making process, the code currently references BTCUSD. As a result, it is only suitable for crypto traders. However, we are working on the stock and forex versions, and the Performer will have these compatibilities soon.
Most importantly, our signals DO NOT REPAINT !
Recommended Use:
- Time Frame: 1HR
- Asset: Large cap crypto assets.
For lower risk tolerance, we recommend using the indicator on ETHUSD. For maximizing profits, we recommend using the indicator on BCHUSD.
- Always set stop loss according to your own risk tolerance
- Take profits along the way. Check out this video tutorial for when to reenter after our take profit signals.
Recommended Use for Advanced Traders:
- Position sizing:
Larger position if the 1HR signal is in the same direction compared to the 4HR trend.
Smaller position if the 1HR signal is in the opposite direction compared to the 4HR trend.
- Better entry/exit points:
Track the 1HR signal for the asset you are trading on other exchanges along with the BTCUSD 1HR signal. Sometimes, the signals from different exchanges occur with a 1-2 hour difference. You could use these earlier signals along with a lower time frame (eg. 15min) entry confirmation from your own exchange for better entry / exit points.
- Use “Take Profit” signals for counter trend scalps. Recover at the reentering opportunities . This works best with candlestick pattern confirmations.
Never use this if you suspect a flag / inverted flag pattern is forming.
Go to www.phi-deltalytics.com and sign up for a FREE trial today!
Let us know if you have any questions or recommendations. We are here for your success!
Disclaimer:
It should not be assumed that the methods, techniques, or indicators presented will be profitable or that they will not result in losses. Past results are not necessarily indicative of future results. This is not a solicitation of any order to buy or sell.

PD Crypto Performer (Backtest)Description:
This is the backtesting version of the PD Crypto Performer (Alert) . The strategy assumes the same capital amount invested ($10,000) each trade. You can also see how your capital grows over time by enabling the reinvesting proceeds option. For details, please check out this tutorial . The backtesting results could be easily improved in live trading by following the recommended methods of use below.
To assist the decision-making process, the code currently references BTCUSD. As a result, it is only suitable for crypto traders. However, we are working on the stock and forex versions, and the Performer will have these compatibilities soon.
Most importantly, our signals DO NOT REPAINT !
Recommended Use:
- Time Frame: 1HR
- Asset: Large cap crypto assets.
For lower risk tolerance, we recommend using the indicator on ETHUSD. For maximizing profits, we recommend using the indicator on BCHUSD.
- Always set stop loss according to your own risk tolerance
- Take profits along the way.
Recommended Use for Advanced Traders:
- Position sizing:
Larger position if the 1HR signal is in the same direction compared to the 4HR trend.
Smaller position if the 1HR signal is in the opposite direction compared to the 4HR trend.
- Better entry/exit points:
Track the 1HR signal for the asset you are trading on other exchanges along with the BTCUSD 1HR signal. Sometimes, the signals from different exchanges occur with a 1-2 hour difference. You could use these earlier signals along with a lower time frame (eg. 15min) entry confirmation from your own exchange for better entry / exit points.
Go to www.phi-deltalytics.com and sign up for a FREE trial today!
Let us know if you have any questions or recommendations. We are here for your success!
Disclaimer:
It should not be assumed that the methods, techniques, or indicators presented will be profitable or that they will not result in losses. Past results are not necessarily indicative of future results. This is not a solicitation of any order to buy or sell.

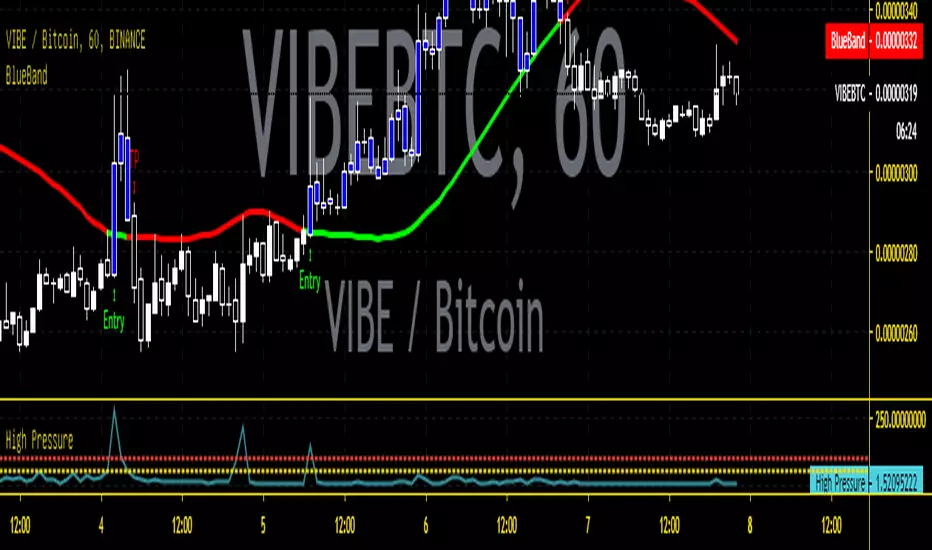
PD Crypto Performer (Alert)Description:
This indicator includes a trend-identifying swing strategy. For decision making, the Performer strategy mainly uses smoothed Simple Moving Averages (SMA) and divergences in Relative Strength Index (RSI), Moving Average Convergence Divergence (MACD), and histogram. A leading indicator (eg. BTCUSD for crypto) is also used for more accurate and timely market identification.
To assist the decision-making process, the code currently references BTCUSD. As a result, it is only suitable for crypto traders. However, we are working on the stock and forex versions, and the Performer will have these compatibilities soon.
Most importantly, our signals DO NOT REPAINT !
Recommended Use:
- Time Frame: 1HR
- Asset: Large cap crypto assets.
For lower risk tolerance, we recommend using the indicator on ETHUSD. For maximizing profits, we recommend using the indicator on BCHUSD.
- Always set stop loss according to your own risk tolerance
- Take profits along the way.
Recommended Use for Advanced Traders:
- Position sizing:
Larger position if the 1HR signal is in the same direction compared to the 4HR trend.
Smaller position if the 1HR signal is in the opposite direction compared to the 4HR trend.
- Better entry/exit points:
Track the 1HR signal for the asset you are trading on other exchanges along with the BTCUSD 1HR signal. Sometimes, the signals from different exchanges occur with a 1-2 hour difference. You could use these earlier signals along with a lower time frame (eg. 15min) entry confirmation from your own exchange for better entry / exit points.
Go to www.phi-deltalytics.com and sign up for a FREE trial today!
Let us know if you have any questions or recommendations. We are here for your success!
Disclaimer:
It should not be assumed that the methods, techniques, or indicators presented will be profitable or that they will not result in losses. Past results are not necessarily indicative of future results. This is not a solicitation of any order to buy or sell.

PD Crypto Performer PRO (Alert)Description:
This indicator includes two strategies for crypto assets, a trend-identifying swing strategy and a low risk scalping strategy. For decision making, the Performer strategy mainly uses smoothed Simple Moving Averages (SMA) and divergences in Relative Strength Index (RSI), Moving Average Convergence Divergence (MACD), and histogram. A leading indicator (eg. BTCUSD for crypto) is also used for more accurate and timely market identification.
To assist the decision-making process, the code currently references BTCUSD. As a result, it is only suitable for crypto traders. However, we are working on the stock and forex versions, and the Performer will have these compatibilities soon.
Most importantly, our signals DO NOT REPAINT !
Recommended Use:
- Time Frame: 1HR
- Asset: Large cap crypto assets.
For lower risk tolerance, we recommend using the indicator on ETHUSD. For maximizing profits, we recommend using the indicator on BCHUSD.
- Always set stop loss according to your own risk tolerance
- Take profits along the way. Check out this video tutorial for when to reenter after our take profit signals.
Recommended Use for Advanced Traders:
- Position sizing:
Larger position if the 1HR signal is in the same direction compared to the 4HR trend.
Smaller position if the 1HR signal is in the opposite direction compared to the 4HR trend.
- Better entry/exit points:
Track the 1HR signal for the asset you are trading on other exchanges along with the BTCUSD 1HR signal. Sometimes, the signals from different exchanges occur with a 1-2 hour difference. You could use these earlier signals along with a lower time frame (eg. 15min) entry confirmation from your own exchange for better entry / exit points.
- Use “Take Profit” signals for counter trend scalps. Recover at the reentering opportunities . This works best with candlestick pattern confirmations.
Never use this if you suspect a flag / inverted flag pattern is forming.
Go to www.phi-deltalytics.com and sign up for a FREE trial today!
Let us know if you have any questions or recommendations. We are here for your success!
Disclaimer:
It should not be assumed that the methods, techniques, or indicators presented will be profitable or that they will not result in losses. Past results are not necessarily indicative of future results. This is not a solicitation of any order to buy or sell.

Modiied Elder Ray Index(Bull or Bear)Here's a modified version of the Elder Ray Index created by the famed Dr.Alexander Elder. This indicator has proven to be especially helpful lately given the crazy state of crypto.
Slow Moving Average :
The top chart shows the moving average used to filter trends. I recommend using a higher window length(can be adjusted with the 'lenSlowMA' input option). I wanted this to be a very smooth moving average, so I used the following formula:
slow MA = ema(vwma(close, 64), 64)
This resulted in a pretty smooth line that still detects major price movements very well.
-The background and bar colors both change in response to the Slow MA's value. The background and bars change to green when a bullish trend is detected and red when bearish.
Bear and Bull Power :
To balance things out a little, I included two histogram's based on Elder's Ray. Here, a more responsive EMA with a shorter window length is used to calculate the bull and bear power values and track short-term price fluctuations.
NOTE: The length of the EMA used here can be adjusted in the input menu.
Bull Power = current high - EMA(close, 13)
Bear Power = current low - EMA(close, 13)

Savitzky-Golay Smoothing FilterThe Savitzky-Golay Filter is a polynomial smoothing filter.
This version implements 3rd degree polynomials using coefficients from Savitzky and Golay's table, specifically the coefficients for a 5-, 7-, 9-, 15- and 25-point window moving averages.
The filters are offset to the left by the number of coefficients (n-1)/2 so it smooths on top of the actual curve.
You can turn off some of the smoothing curves, as it can get cluttered displaying all at once.
Any feedback is very welcome.

SSEMA cross VMAGreen line BUY
Red line SELL
Important: Follow the major trend
Is a good indicator for stay until color change

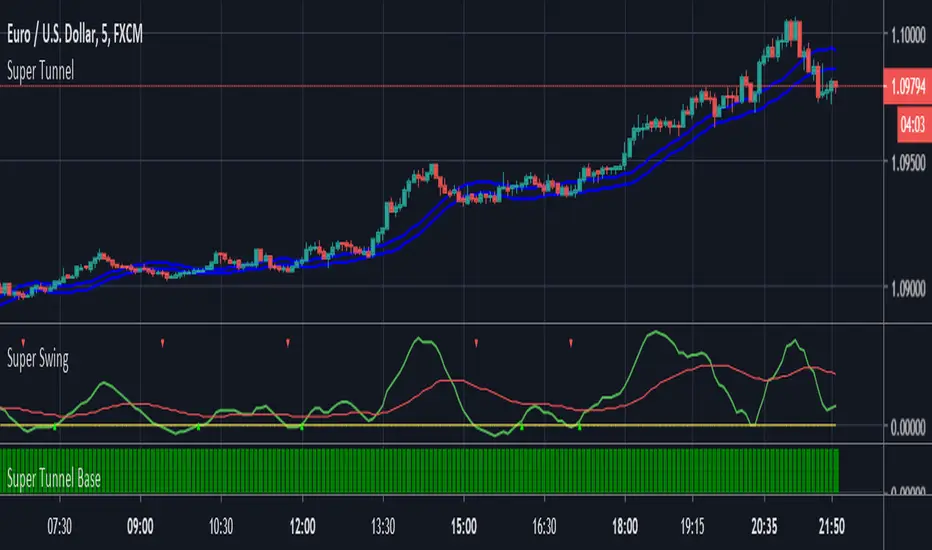
Super Tunnel by JP Goswami
One of the most accurate trend following indicator I have used till now. You yourself can test it by using on multiple charts and time frame. However, I have found it more accurate on intraday charts, may be 5 min & 15 min TF.
Highlights are:
> High Prediction rates
> Non repainting
> Can be used on MTF
> Simplicity
> Give stoploss levels
Disadvantage:
> Just like any other trend following indicator, volatility and spikes are enemy of this indicator
How to Use
Long:
When Price closes above the tunnel & background is Lime
Stoploss: Just below lower line of the tunnel
Short: When price closes below the tunnel & background is yellow
Stoploss: Just above upper line of the tunnel
No trades: When background doesn't have any colors
Reentry: if Price moves back to long and short rules
All the best
© JP Goswami
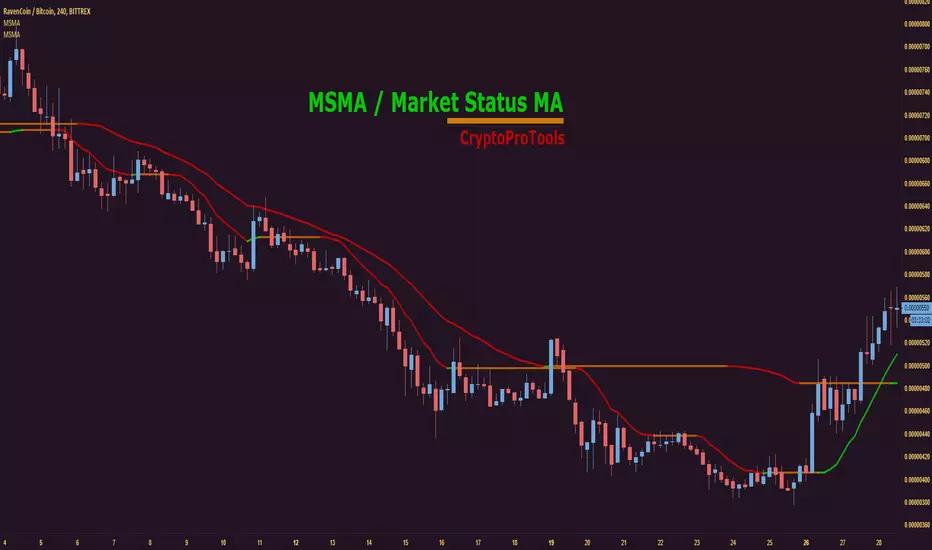
Market Status Moving AverageGet a quick easy view of the current market status.
Examples used above are lengths 6 and 15, but you can tweak to your liking.
Want to stop sweating the small stuff and see the bigger picture? Try increasing the length to 50, 100 etc
Green = Bullish
Orange = Consolidation / Flat
Red = Bearish
--------------------------------------------------------------------
--------------------------------------------------------------------
Check out some of our other recent releases below :
Alto Basso Swing Pivots + Barry Support Resistance Levels2 indicators, 1 script: swing pivots and Barry support resistance levels
Alto
high swing pivot
Basso
low swing pivot
Dal Segno
lookback period length for swing pivots
Barry Length
length for support resistance calculation
--------------------------------------------------------------------------------------------------------------------------------------------------------------------------------------------
Use swing pivots for confirmation of new structure levels on short term
Barry support resistance levels in proximity to standard pivots or Fibonacci levels may indicate greater strength
credit to BacktestRookies and likebike
stay ♯
Example: Dal Segno 13, Barry Length 21

SMMA FIB S/R + EMA Cloud - 6 Hour Swing - THE OASIS GROUP
This is a Swing Trade Chart Based on the 3EMA / 21 EMA / 55 EMA Cross Clouds.
The 4 Hour and the 6 Hour are the preferred Time Frames, mainly on the 6 Hour.
Aqua signifies Bulls and the 2 toned Aqua signifies a strong up trend.
Fuchsia signifies Bears and the 2 toned Fuchsia signifies a strong down trend.
Black Cross - Death Cross
Blue Cross - Golden Cross
We use SMMA as the support and resistances.
Fibonacci numbers are used here to mimic natural movement and to
have cleaner Moving Averages.
These moving averages can be used on any time frame.
Just check off the EMA Clouds.
Fuchsia - 21 SMMA
Lime - 55 SMMA
Blue - 144 SMMA
Red - 233 SMMA
Orange - 377 SMMA
Black - 55 EMA
Aqua/Fuchsia - 21 EMA (this EMA switches colors as it crosses the 55 EMA)
When the crosses occur always remember to keep proper stop losses and move them up according to your profit taking plan.
Crosses are meant to indicate a possible direction change, so use proper TA to analyze your positions and possible entries.
This is not a foolproof plan, but a great swing trader tool if you begin to know and understand it.
Exclaimer:
We don't give any Financial advice, this is pure entertainment value and should be taken as such. Enjoy!
THE OASIS GROUP

Anti-flat MAExperimental MA attempting to reduce whipsaw, minimizing crosses and associated commissions.

Reap Hull SMA CrossoverHi this is my first script, it is a HMA 144 crossover with SMA 5 changes background (still needs work), provides alerts for crossover

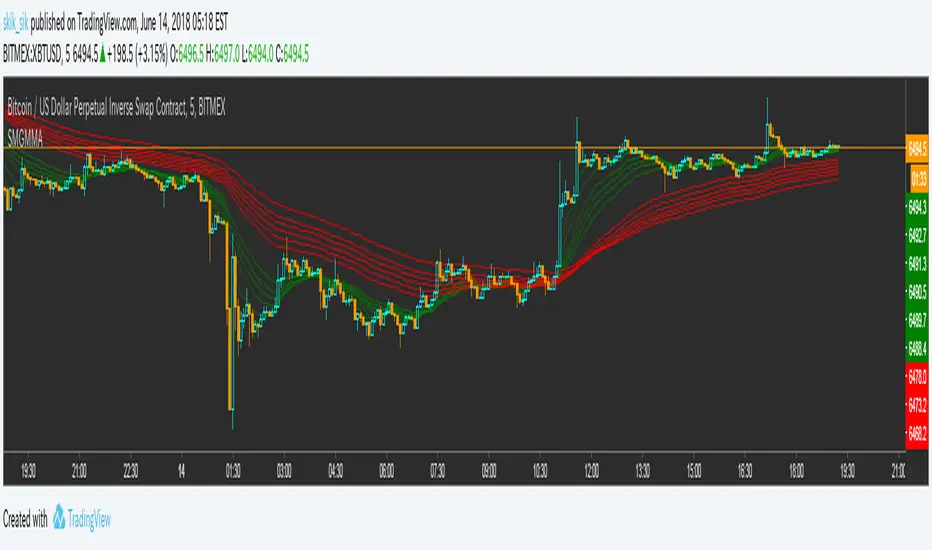
Smoothed Guppy Multiple Moving Average名前のとおり
GMMAの説明は自分でお探しくだいさい
As the name implies
Please explain GMMA by yourself
Single_Timeframe_3EMA + Current_Timeframe_3SMMAPlots 3 EMA from a larger timeframe (day, week) and 3 SMMA from the current one.
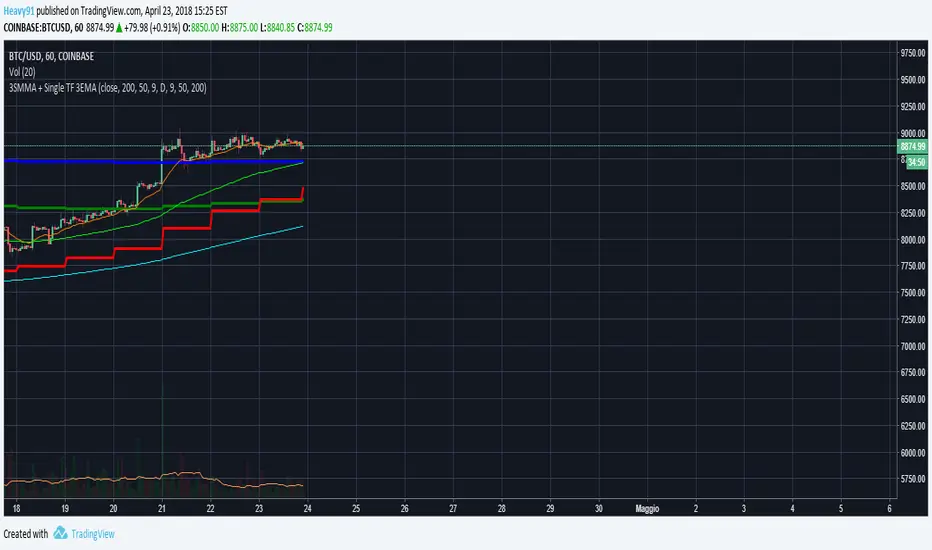
Single Timeframe 3EMA + Current Timeframe 3SMMA
Plots 3 exponential moving averages from a bigger timeframe (Day, Week) and 3 smoothed moving averages from the current timeframe.

XBTUSD for BitMEX [ BB Long term strategy ]XBTUSD for BitMEX
『おすすめストラテジーSS1』(BitMEXビットコイン用Pineスクリプト)自動売買のアイデアに!

SMMA Analyses - Buy / Sell signals and close position signals This script combines the usage of the SMMA indicator in order to provide signals for opening and closing trades, either buy or sell signals.
It uses two SMMA , a fast and a slow one, both configurable by the users.
The trigger of Buy and Sell Signals are calculated through the SMMA crosses:
Buy Signals : The fast SMMA crosses over the slow SMMA . They are highlighting by a green area and a "B" label.
Sell Signals : The fast SMMA crosses under the slow SMMA . They are highlighting by a red area and a "S" label
The trigger of Close Buy and Close Sell Signals are calculated through the close price crosses with the fast SMMA:
Close Buy Signals : The fast SMMA crosses under the close price and at the same time the trend is bullish , so the fast SMMA is greater than the slow SMMA . They are highlighted by a lighter green area
Close Sell Signals : The fast SMMA crosses over the close price and at the same time the trend is bearish , so the fast SMMA is lower than the slow SMMA . They are highlighted by a lighter red area
Few important points about the indicator and the produced signals :
This is not intended to be a strategy, but an indicator for analyzing the SMMA conditions. It gives you the triggers depending on the real time analysis of the SMMA and prices, but not being a proper strategy, pay attention about "fake signals" and add always a visual analysis to the provided signals
Following this indicator, the trade positions should be opened only when a cross happens. Either in this case, analyse the chart in order to see if the signals are a "weak" ones, due to "waves" around the SMMA . In these cases, you might wait for the next confirmation signals after the waves, when the trend will be better defined
The close trade signals are provided in order to help to understand when you should close the buy or sell trades. Even in this case, always add a visual analysis to the signals, and pay attention to the support/resistance areas. Sometimes, you can have the close signals in correspondence to support/resistance areas: in these cases wait for the definition of the trend and eventually for the next close trade signals if they will be better defined
