Call Bear Spread indicatorCall bear spread indicator developed by Chobotaru Brothers.
You need to have basic knowledge in option trading to use this indicator!
This spread is a CREDIT SPREAD.
The indicator shows P&L lines of the options strategy. Use only for stocks since the mathematical model of options for Future instruments is different from stocks. Plus, the days' representation in futures is also different from stocks (stocks have fewer days than futures ).
***Each strategy in options is based on different mathematical equations, use this indicator only for the strategy in the headline.***
What does the indicator do?
The indicator is based on the Black-Scholes model, which uses partial differential equations to determine the option pricing. Due to options non-linear behavior, it is hard to visualize the option price. The indicator calculates the solutions of the Black-Scholes equation and plots them on the chart so traders can view how the option pricing will behave.
How the indicator does it?
The indicator uses five values (four dominants and one less dominant) to solve the Black-Scholes equation. The values are stock price, the strike price of the option, time to expiration, risk-free interest rate, and implied volatility .
How the indicator help the users?
-View the risks and rewards so you can know the profit targets in advance which means you can compare different options in different strikes.
-View the volatility change impact so you can know the risk and the P&L changes in case of a change in the volatility over the life of the option before you enter the trade.
-View the passage of time impact so you can know where and when you could realize a profit.
-Multi-timeframes so you can stay on the same chart (Daily and below).
All these features are to help the user improve his analysis while trading options.
How to use it?
The user needs to obtain from the “option chain” the following inputs:
- Call spread price (Credit): The credit received for one unit of options strategy.
-Instrument price when entered spread: the stock price when you enter the options strategy.
-Upper strike price: the upper strike price of the options strategy.
-Lower strike price: the lower strike price of the options strategy.
-Interest rate: find the risk-free interest rate from the U.S. DEPARTMENT OF THE TREASURY. Example: for 2% interest rate, input: 0.02.
-Days to expire: how many days until the option expires.
-Volatility: the implied volatility of the option bought/sold. Example: for 45% implied volatility , input: 0.45.
-Day of entry: A calendar day of the month that the option bought/sold.
-Month of entry: Calendar month the option bought/sold.
-Year of entry: Calendar year the option bought/sold.
-% of Max Profit/Loss: Profit/loss line defined by the user. Minimum input (-0.95) ; maximum input (0.95).
Example: In this spread, -0.95 means, 95% of the options strategy maximum loss is reached and, 0.95 means, 95% of the options strategy maximum profit is reached.
After entering all the inputs, press Ok and you should see “Calculation Complete” on the chart.
The user should not change the entry date and days to expire inputs as time passes after he entered the trade.
How to access the indicator?
Use the link below to obtain access to the indicator
Spread

Call bull spread indicatorCall bull spread indicator developed by Chobotaru Brothers.
You need to have basic knowledge in option trading to use this indicator!
This spread is a DEBIT SPREAD.
The indicator shows P&L lines of the options strategy. Use only for stocks since the mathematical model of options for Future instruments is different from stocks. Plus, the days' representation in futures is also different from stocks (stocks have fewer days than futures ).
***Each strategy in options is based on different mathematical equations, use this indicator only for the strategy in the headline.***
What does the indicator do?
The indicator is based on the Black-Scholes model, which uses partial differential equations to determine the option pricing. Due to options non-linear behavior, it is hard to visualize the option price. The indicator calculates the solutions of the Black-Scholes equation and plots them on the chart so traders can view how the option pricing will behave.
How the indicator does it?
The indicator uses five values (four dominants and one less dominant) to solve the Black-Scholes equation. The values are stock price, the strike price of the option, time to expiration, risk-free interest rate, and implied volatility .
How the indicator help the users?
-View the risks and rewards so you can know the profit targets in advance which means you can compare different options in different strikes.
-View the volatility change impact so you can know the risk and the P&L changes in case of a change in the volatility over the life of the option before you enter the trade.
-View the passage of time impact so you can know where and when you could realize a profit.
-Multi-timeframes so you can stay on the same chart (Daily and below).
All these features are to help the user improve his analysis while trading options.
How to use it?
The user needs to obtain from the “option chain” the following inputs:
- Call spread price (Debit): The debit paid for one unit of options strategy.
-Instrument price when entered spread: the stock price when you enter the options strategy.
-Upper strike price: the upper strike price of the options strategy.
-Lower strike price: the lower strike price of the options strategy.
-Interest rate: find the risk-free interest rate from the U.S. DEPARTMENT OF THE TREASURY. Example: for 2% interest rate, input: 0.02.
-Days to expire: how many days until the option expires.
-Volatility: the implied volatility of the option bought/sold. Example: for 45% implied volatility , input: 0.45.
-Day of entry: A calendar day of the month that the option bought/sold.
-Month of entry: Calendar month the option bought/sold.
-Year of entry: Calendar year the option bought/sold.
-% of Max Profit/Loss: Profit/loss line defined by the user. Minimum input (-0.95) ; maximum input (0.95).
Example: In this spread, -0.95 means, 95% of the options strategy maximum loss is reached and, 0.95 means, 95% of the options strategy maximum profit is reached.
After entering all the inputs, press Ok and you should see “Calculation Complete” on the chart.
The user should not change the entry date and days to expire inputs as time passes after he entered the trade.
How to access the indicator?
Use the link below to obtain access to the indicator

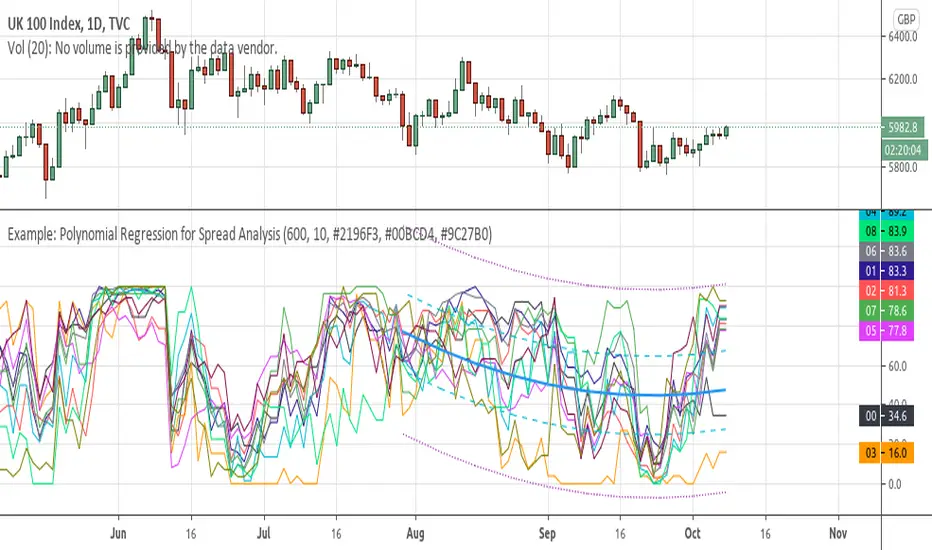
Example: Polynomial Regression for Spread AnalysisExample of applying polynomial regression channel to spreads or hedges between 2 assets.
Libor-EFFRThis is the 3-month Libor minus effective federal funds rate. Traders watch certain spreads for a wider spread to indicate a bad economy.
This is a conceptual indicator that tries to make sense of how important a FRA-OIS spread can be, in this case the Libor-EFFR. It may be completely wrong in calculation and understanding :)
en.wikipedia.org
www.investopedia.com
Libor was derived from the TED Spread less 3-month treasury bills due to Quandl missing updated Libor data.
fred.stlouisfed.org
fred.stlouisfed.org
For the OIS, EFFR is used because it has long historical data and is one of (maybe) the rates used for spread. SOFR was not available at the time but it appears that is what is more common nowadays.
A possible derivative of this indicator would be taking Libor and putting it against something else.

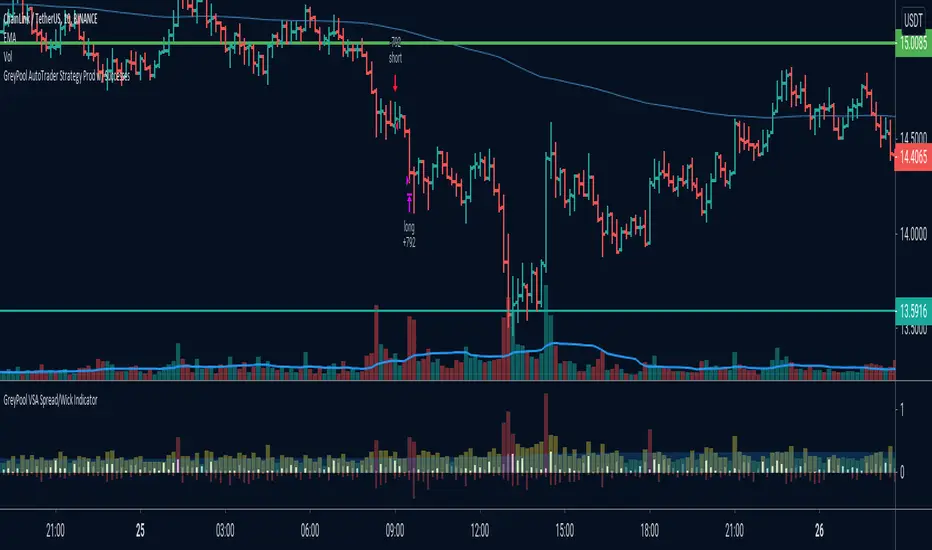
GreyPool VSA Spread/Wick Divergence IndicatorThe purpose of this indicator is to determine the distance between the spread of a bar/candle and the wick at a glance (Spread is defined as the range between the open and close and the wick is any part of the bar/candle that is beyond that range).
Climactic action bars typically have large spreads and a pronounced wick which indicates hidden buying or selling.
Definitions of Colors:
Light Blue Area - Average spread size of the last x bars where x is the set MA period
Red Column - Indicates a very high spread that is far beyond the average
Yellow Column - Indicates spreads that are at the average line or just above it
Green Column - Indicates a very low spread
Thin Red Histogram - Indicates the size of the bottom wick (Either the distance between the close and low of down bars or the open and low or up bars)
Thin Blue Histogram - Indicates the size of the top wick (Either the distance between the open and high for down bars or the close and high for up bars)
*** Please Click The LIKE Button to Support Us, Thank You ***
Spread by//Every spread & central tendency measure in 1 script with comfortable visualization, including scrips's status line.
Spread measures:
- Standard deviation (for most cases);
- Average deviation (if there are extreme values);
- GstDev - Geometric Standard Deviation (exclusively for Geometric Mean);
- HstDev - Harmonic Deviation (exclusively for Harmonic Mean).
These modified functions will calculate everything right, they will take source, length, AND basis of your choice, unlike the ones from TW.
Central tendency measures:
- Mean (if everything's cool & equal);
- Median (values clustering towards low/high part of the rolling window);
- Trimean (3/more distinguishable clusters of data);
- Midhinhe (2 distinguishable clusters of data);
- Geometric Mean ( |low.. ... ... .. .... ... . . . . . . . . . . . .high| this kinda data); <- Exp law
- Harmonic Mean { |low. . . . . . . . . . . . . . .. . . .high| kinda data). <- Reciprocal law
Listen:
1) Don't hesitate using Standard Deviation with non-mean, like "Midhinge Standard Devition", despite what ol' stats gurus gonna say, it works when it's appropriate;
2) Don't check log space while using Geometric Mean & Geometric Standard Deviation, these 2 implement log stuff by design, I mean unless u wanna make it double xd
3) You can use this script, modify it how you want, ask me questions whatever, just make money using it;
4) Use Midrange & Midpoints in tandem when data follows ~addition law (like this . . . . . . . . . . . . . . . . . . . . .). <- just addition law
Look at the data, choose spread measure first, then choose central tendency measure, not vice versa.
!!!
Ain't gonna place ® sign on standard deviations like one B guy did in 1980s lmao, but if your wanna use Harmonic Deviations in science/write about/cite it/whatever, pls give me a lil credit at least, I've never seen it anywhere and unfortunately had to develop it by myself. it's useful when your data develops by reciprocals law (opposite to exponential).
Peace TW

Horus Spreadmaster
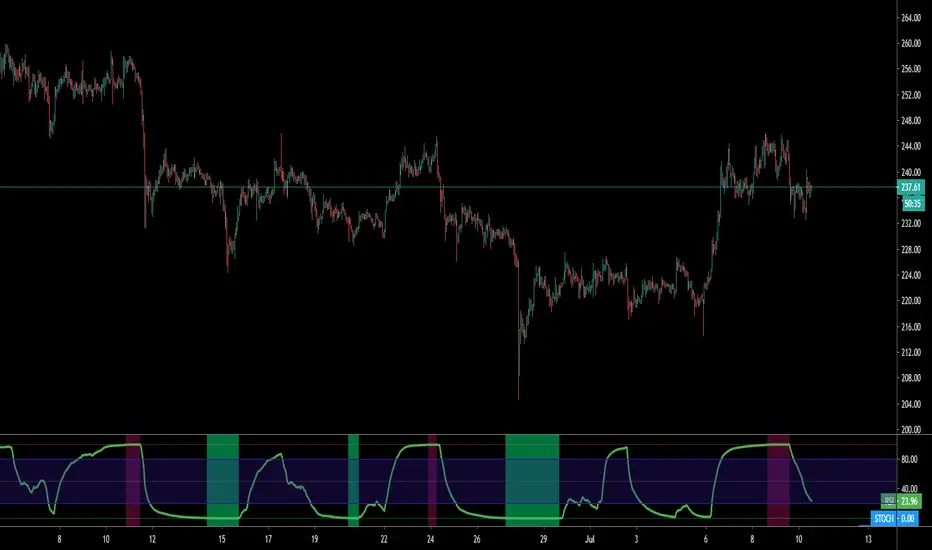
Hello Traders,
Horus Spreadmaster is an oscillator based on the spread of two tickers and may indicate oversold / overbought conditions compared to one or the other . You can also setup an other time frame.
How it works?
- Setup the tickers
- Check the invert box if you have the correct ticker order
- Setup any time frame you want
- Display Stochastic
- Display StochRSI
If its indicated overbought, this does not mean it can't go higher. Same the other way around.
Use other indicators and PA for more confluence.
Wuuzzaa
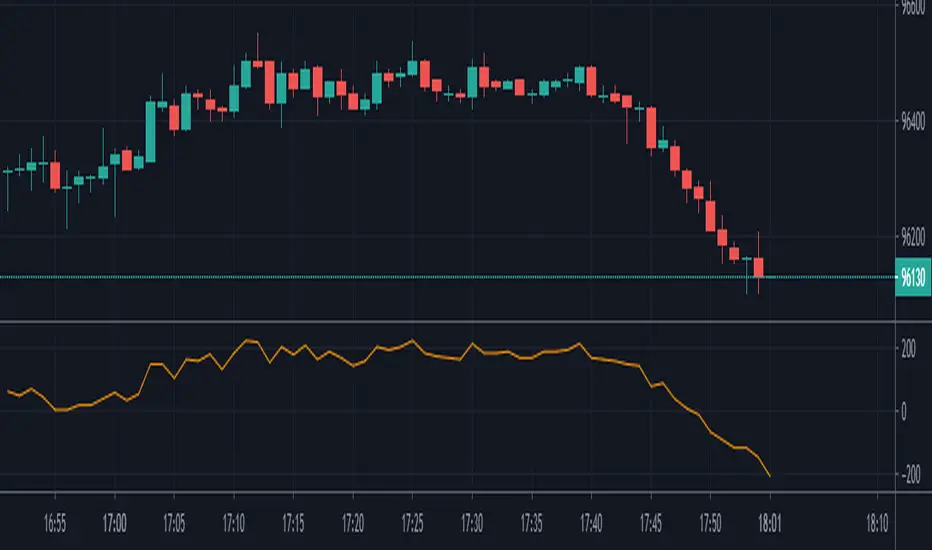
Arbitrage B3's IBOV FuturesThis indicator was made to calculate and show the spread between the B3's Ibovespa Futures and B3's Ibovespa Index increased by the Interest until the contract expiration date.
The orange line "Arbitrage" is the spread.
Inputs:
Annual Interest Rate (%) -> Interest Rate that you want to be used to calculate the Interest of B3's IBOV Index.
Working Days Until Contract Expires -> How many business days you have between your actual date and the expiration date of the Futures.
Recommended TimeFrame to evaluate the "Arbitrage": 1 MIN
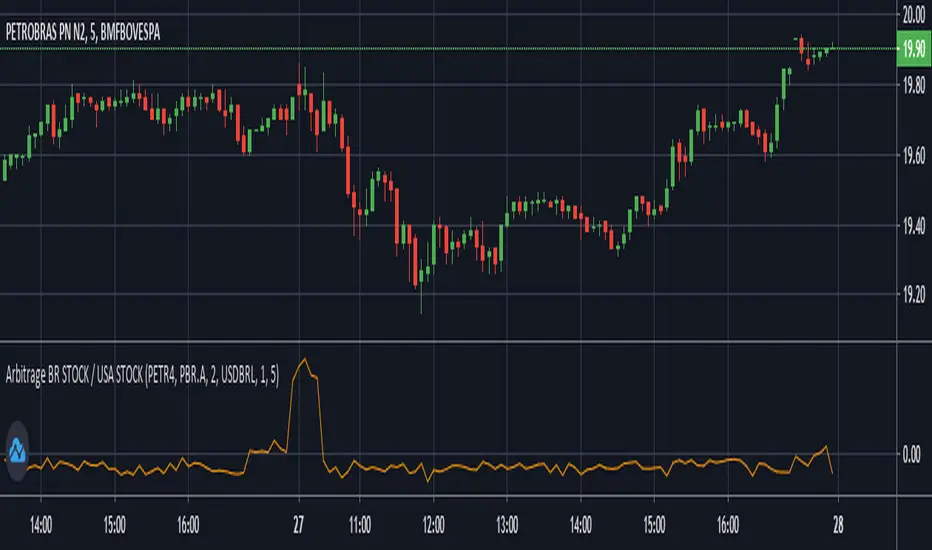
Arbitrage BR STOCK / USA STOCKThis Indicator was made to show the BRL difference between an Stock in Brazil's B3 and it's respective ADR traded in the USA.
By default, it will show the spread between PETR4 and it's ADR PBR.A using the USD-BRL pair from Forex.
You can personalize this indicator to any Stock of your preference, and also change to any USD-BRL pair negotiated that you want. You'll have the following options to do so:
B3's Stock Ticker -> Ticker negotiated at B3.
USA's Stock Ticker -> The respective ADR of the first option.
ADR's Multiplicative Factor -> How many B3's Stocks are equivallent to the USA Stock (found at the name of the ADR on Trade View).
BRL/USD Market of Preference -> Which market you want to use to transform the price of the ADR from USD to BRL.
Dollar Divisor -> The BRL must be equivallent to 1 Dollar for the script to work. So, if you want to use a USD/BRL market that does not represent this relation, you must divide it by some number to do so. For example, if you want to use B3's DOLFUT, than you must set this parameter to 1000 (because the points show at B3's DOLFUT are the amount of BRL equivallent to 1000 Dollars). Also, if you are using a market that trades Dollar equivalent to 1 BRL (Globex's 6LFUT, for example), then set this parameter to 0.
Timeframe -> Recommended to be the same of the chart to better visualisation.
Arbitrage DOL BR / DOL USAThis indicator is made to calculate and show the spread between the currency pair USD-BRL being negotiatied in Brasil's B3 and in USA's CME Globex.
The orange line "Arbitrage" is the spread.
The red/green line is the "Stop Loss" recommended for the strategy. If the line is green, it means that the reward/tisk ratio is above 1.
IMPORTANT: MAKE SURE TO BE USING THE SAME TIMEFRAME ON BOTH THE INDICATOR AND THE CHART.

Bitcoin SpreadThis indicator display the current lowest and the highest value of btc on a set of exchanges for a define type of market.
Bitcoin Spread was originally made by @DayTradingItalia, i have bring his indicator to pine v4, add add some stuff to it:
5 Type of BTC Market : USDT Swap, USD and Futures (current/next contract)
Spread value

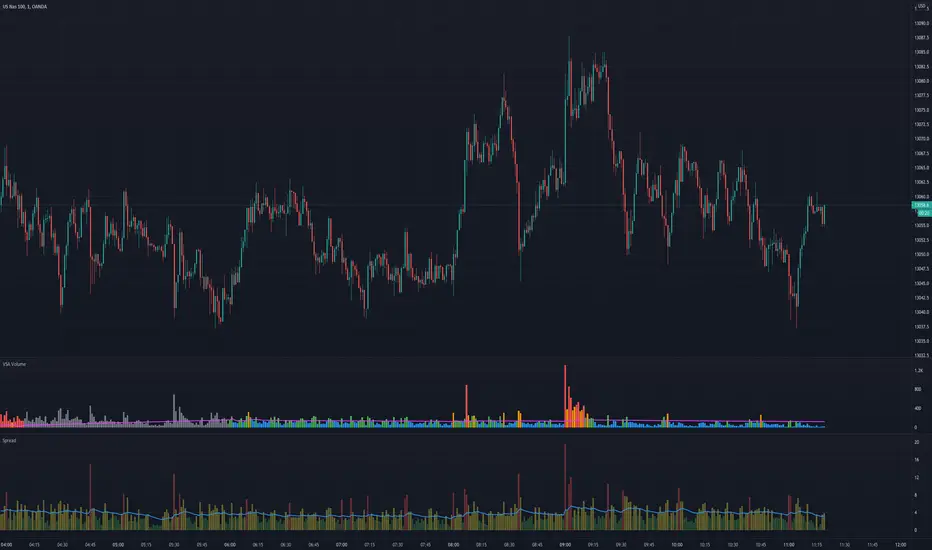
VSA VolumeVolume indicator judging level of volume per bar accordingly to Volume Spread Analysis rules. It allows either to set static volume levels or dynamic ones based on ratio comparable to Moving Average. Bars are coloured based on ratio or static levels, visually presenting level of Volume (low, average, high, ultra high).

VSA SpreadMeasures spread of the candle, useful especially for Volume Spread Analysis (VSA) and to measure trend strength. Spread is coloured based on level comparable to Moving Average.
Spread PercentThis indicator shows the percent change between the highs and the lows (or optionally the open and close) of each candle. You may also set a low and a high percent threshold to better highlight the candles that exceed your desired spread percent. Red signifies low spread, green is high spread - these are unrelated to the color of the candle body. There is also the option to display a moving average of the spread percent at your desired length which is a representation of volatility over time.
This is not only helpful for historical analysis over time, but this can also be a time saver if you are trying to calculate the measured distance of a move. Save clicks - no more needing to use the measuring tool.
The settings of the indicator on the chart above are:
- Measure Candle Body Only? - No
- Highlight Thresholds? - Yes
- Thresholds Based on Moving Averages? - Yes
- Low Percent Threshold - 3.0
- High Percent Threshold - 7.0
- Show Moving Average? - Yes
- Moving Average Length - 5

SpreadTrade - Distance (ps4 ver. 2)This script implements a rebrushed distance-based pair trading strategy. In this strategy, normally they trade the difference between the prices of two instruments. This difference is also called spread. Here, however we’ll trade the difference between two time frames of one instrument. And that's the main trick. Common procedure consists of the following steps:
1. Select two CORRELATED stocks. Here we'll use the same instrument in different TFs.
2. Generate the spread by calculating the difference between the prices/instruments. For distance based pair trading, we need to (rescale the data first and then) check the distance between them.
3. Define the logic to trade the spread and generate the trading signals. In this example we’ll calculate the rolling mean and rolling standard deviation of the spread. Whenever the spread goes above a rolling mean by one standard deviation, we’ll short the spread expecting the mean reversion behavior to hold true. And whenever the spread goes below its rolling mean by one standard deviation, we’ll go long on the spread.
Mind that the meaning of the orange and blue signals depends on whether tf variable is smaller or larger than the built-in timeframe.multiplier variable, i.e. tf of the chart.
For details see analyticsprofile.com
Donate: PayPal (paypal.me)

Calendar Spread - OldinvestorSimply choose what two securities (symbols) you want to compare. The study will subtract Open, High, Low, and Close of second input from the first. You may also move the plot line wherever you choose. It may be necessary to move the plot line in order for some charts to look right.
Price Spread Momentum‴ | Price Spread Momentum HistogramPrice Spread Momentum‴ is a Price Spread oscillator that allows you to have a better understanding and interpretation of its behavior once you are able to see it through an histrogram.
It has extreme zones such as overspreaded and underspreaded, but these zones start, respectively, from above 100% and from under -100%, with a mid line at 0%.
What is the best is that you can use it with any kind of graphic that it will always considere the real open, close, high and low trading values.
To have access to this indicator, please contact me at: contato @ moneywise . com . br
Believe me, this indicator will make your life much easier!


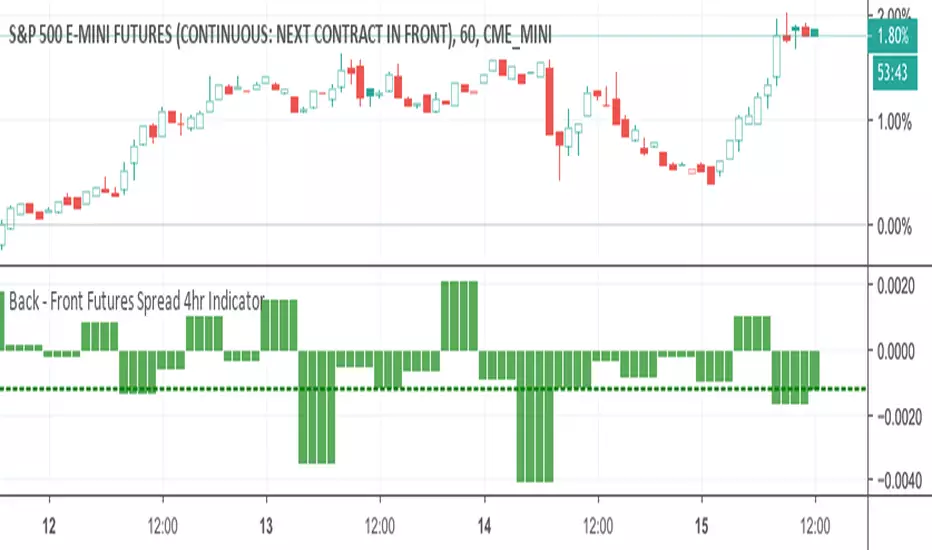
Back - Front Futures Spread 4hr IndicatorThis puts a normalized back - front spread based on the close price.
Objective Analysis of Spread (VSA)Note: Pardon for a busy chart. It really is irrelevant for this indicator. Just look at the bottom part of the chart for the indicator (SpAn).
This script is meant to add objectivity to the estimation of spread in VSA. This is best used with a similar volume indicator that measures volume in the same fashion, but a simple rule of "higher/lower than the previous 2 bars" for estimation of volume size can be used as well in conjunction with this indicator.
A 30-period (adjustable) SMA difference between the high and the close is used to estimate average spread. This value is used to plot bands of 0.8 and lower (blue) standard deviation for narrow spread, 0.8-1.3 (yellow) for medium spread, 1,3-1.8 (green) for wide spread, 1.8-3 (red) for ultra-wide spread. Anything above 3 (no color) is plain crazy. =)
How to use:
A histogram of each bar spread is plotted as well. See where each histogram bar ends. For example, if it ends in the green area, this bar has a wide spread.
Added indicator:
An ATR (14-period, adjustable) is plotted as a black line for your reference. May be used for stops. Otherwise, it is not necessary for VSA.
Feedback and suggestions for improvement are welcome.


SpreadTrade - CorrelationCorrelation Based Pair Trading Strategy (Trading the spread)
There are three popular styles of Pair trading:
* Distance based pair trading
* Correlation based pair trading
* Cointegration based pair trading
The correlation based strategy is to short the outperforming instrument and go long on the underperforming one
whenever the temporary correlation weakens which means one instrument going up and another going down.
Here, instead of two different instruments two timeframes of the same instrument are used, lower and higher.
In order to calculate the trade size, we would need to calculate hedge_ratio,
which is simply the ratio of the closing price of the instrument in the current tf to the higher tf.
So whenever we want to go short on spread we’ll short 1 unit of current tf and go long on hedge ratio times units of higher tf.
In order to generate trading signals, we need to define our trading logic.
So, we’ll go long on the spread when the hedge ratio goes below its p rolling mean by mult times of its
rolling standard deviation and vice versa.
Note that both p and mult can be changed as per your selection of instruments.
See: analyticsprofile.com
NOTE:
There is a minor problem to it in Pinescript. After a while the signal line goes horizontal and the two bounds, upper and lower, converge unless you update the time frame.
Kepp me in the know if you find a solution to this problem)
