Stochastic RSI (STOCH RSI)


Ulysses Indicator by ZekisThis script is based on multiple indicators:
- Stochastic Momentum Index
- Anchored Momentum
- Bollinger Bands
- Stochastic RSI
- EMA
When all criterias are met, a signal is triggered:
- green label - the trend is change to bullish (teal background)
- red label - the trend is change to bearish (red background)
- green triangle - enter long (lime bar color)
- red triangle - enter short (red bar color)
This strategy works with med-high time frames.
Play with values till you find what you need.
Enjoy!
@Zekis

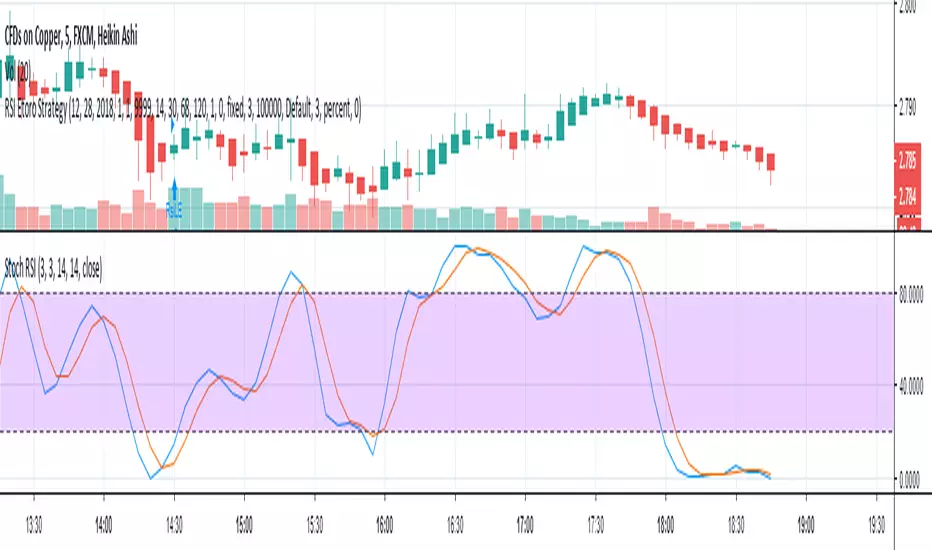
RSI Etoro StrategyTmp (WIP) just for my bro Manu ;)
BTW "Used" on COPPER
Not Good because only one indicator: miss several phenomenon so go to SL stupidly... And fine tuning of parameters is too sensible: it should be adjusted following feedback from other indicators...
Good thing is it takes into account the etoro context (SL at 50%, spread of 3 ticks) and you can back test with any period you want (usefull because parameters depends on "moods")

rsi_with_stochrsi_[j15] v2This is version 2 of the combined indicator RSI and Stochastic RSI. Added intersection of lines k and d, as well as suppression of the upper and lower lines

Absolute Strength HistogramThe Absolute Strength Histogram
Absolute Strength Histogram is composed of two separate signals - Bulls and Bears. Both signals are plotted on the same graph. By doing so we can see the strength of the buyers and sellers in comparison to one another. When the Bulls Signal is above the Bears Signal, the histogram is blue and the market tends to be trending up (go long). When the Bears Signal is above the Bulls Signal, the Histogram turns red and the market tends to be trending down (go short).
There are two methods for calculation, the RSI and the Stochastic, and both have their merits.
There are also several smoothing algorithms added that you can select from the drop-down. Note that higher smoothing will notify you of trend changes later. Lower smoothing will give you quicker signals at the cost of more errors (false signals or noise).
Happy Trading :)


Multi-Timeframe Stochs by Tom L.I find it really usefull. Can put 4 different timeframes.
Thanks again to Tom !
PMA4LIFE
RAF3x

RSI & Stochastic RSIRSI and Stochastic RSI Same Chart
Turn on StochRSI crossover signals
Customizable values

Momentum Oscillators [CP]This is collection of 3 Momentum Oscillators:
*RSI
*Stochastic
*SRSI
You can filter each one with the following options:
*SMA
*EMA
*Hull MA
*Linear Regression
*Laguerre
*SuperSmoother
*SuperSmoother

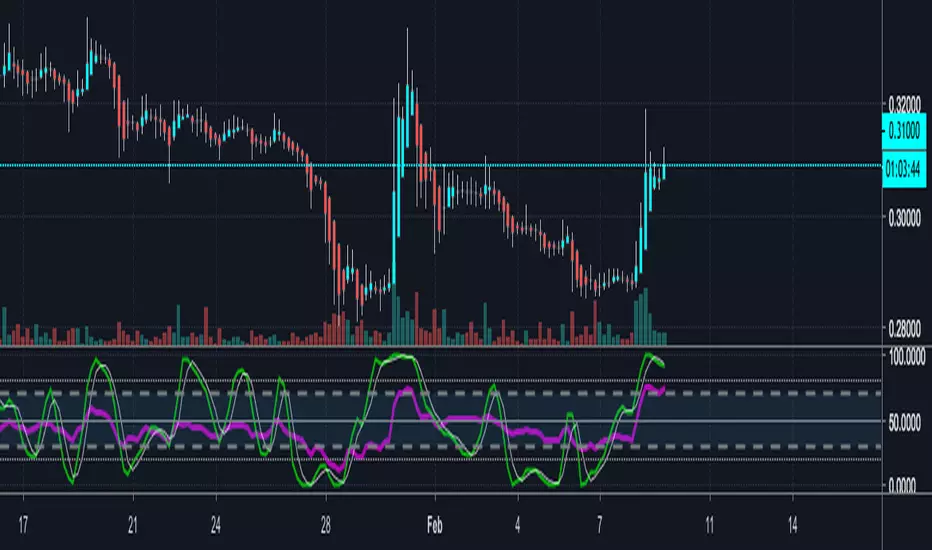
SSR Srategy V2SSR strategy is a strategy evolved from Stochastic RSI fast and slow line crossing strategy and has the advantage of being adjustable with high degree of freedom. The full name of SSR is Smooth Stochastic RSI .
This indicator provides the following three trading mechanisms:
1. Enter each time the D and smooth D lines cross
2. Only enter when the D line and the smooth D line cross outside the threshold, and reverse trade when the next time cross outside the threshold.
3. Only enter when the D line and the smooth D line cross outside the threshold, and close the position at the next cross.
It also provides the following two functions to help u evaluate trading profit:
1. Select specific time test.
2. Stop loss setting.
P.S. If the 'Order’s limit was reached’ message appears, you can use the specific time test function to narrow the test range.

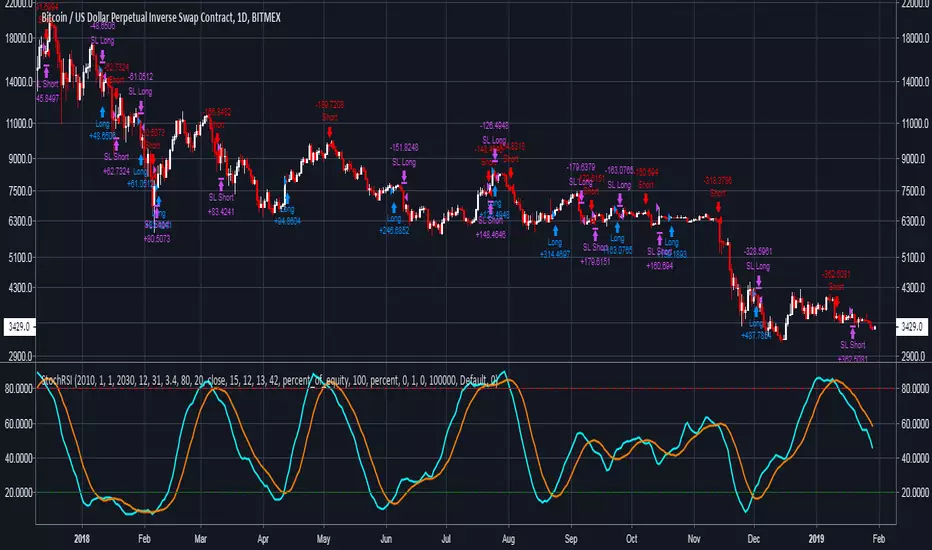
Stochastic RSI SrategyThis strategy is based on Stochastic RSI fast and slow line crossing and has the advantage of being adjustable with high degree of freedom.
This indicator provides the following three trading mechanisms:
1. Enter each time the K and D lines cross
2. Only enter when the K line and the D line cross outside the threshold, and reverse trade when the next time cross outside the threshold.
3. Only enter when the K line and the D line cross outside the threshold, and close the position at the next cross.
It also provides the following two functions to help u evaluate trading profit:
1. Select specific time test.
2. Stop loss setting.
P.S. If the 'Order’s limit was reached’ message appears, you can use the specific time test function to narrow the test range.
Contender 1Directional movement indicator for assessing price direction and strength. DMI tells you when to be long or short, differentiating between strong &weak trends. DMI works on all time frames and applicable to any asset.
DMI is a moving average of range expansion over an input period. The positive directional movement indicator ( +DMI ) measures how strongly price moves upward; the negative directional movement indicator ( -DMI ) measures how strongly price moves downward. The two lines reflect the respective strength of the bulls versus the bears. Which DMI lines is on top is the dominant DMI. The dominant DMI is stronger and more likely to predict the direction of price. For the buyers and sellers to change dominance, the lines must cross over.
Added feature is Bollinger Bands to moderate signals.

TJ-StochFinally I am setting this beast free.
This is one of my favorite indicators and it has everything what there is to Stochastic and Stochastic RSI.
The TJ-Stoch is a heavy mod and merge of Stochastic and Stochastic RSI.
There are some very important modifications on it.
- The green and red line at 40 and 90 points.
The stochastic lines like getting rejected at both lines.
A rejection at the 40 point line, from above or from below, mostly has an impulse move to it.
The same applies to the 90 point line.
The 90 point line nevertheless, has mostly an impulse move, when it is getting crossed down.
The stochastic lines staying above the 90 point line, are an indication for upcoming impulse moves.
- The lines itself
The stochastic lines have their original colors; blue for K , the faster moving line and orange for D the slower moving line.
Nevertheless, you can identify the original colors only, when those are ascending.
When the K and the D line are descending, those turn red, so you can immediately see what move is what and where it is actually descending or ascending.
- The crosses
One of the most important treats that Stochastic and Stochastic RSI have, are the crossovers. Sometimes these are hard to identify.
Therefore, a crossover is marked with a green cross at the top. A cross-down is marked with a red cross at the top.
Like and Follow me and you will find this page interesting because I am a TA expert and professional day trader in crypto since 2012 that does daily updates and new posts about the hottest and most discussed coins.
Cheers, TJ

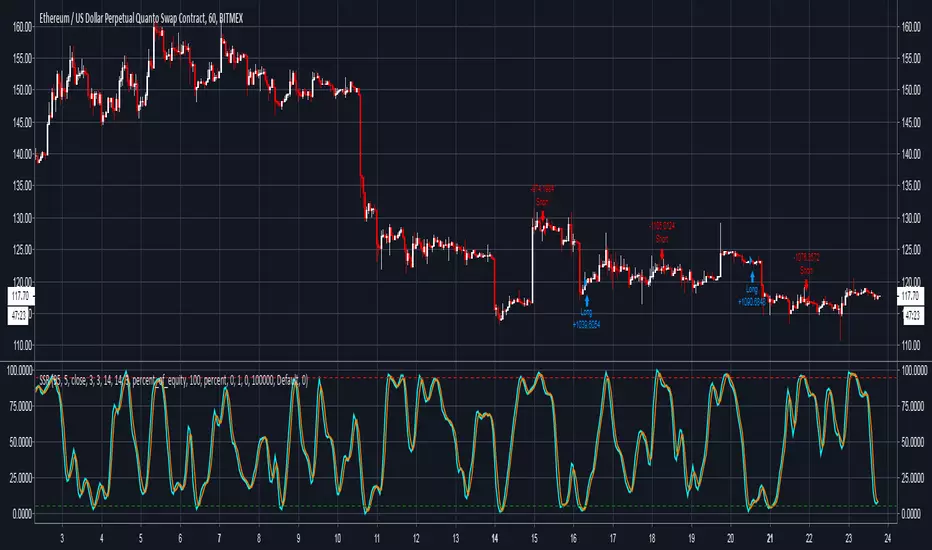
Lysergik's Stochastic SynergyThis indicator shows the average Stochastic RSI output of the 15m, 1h, 2h, 4h, and Daily Stochastic RSI. It will change in its behavior depending on the time-frame you're using, but for many markets it works best on the 30m time-frame and the daily time-frame.
It is best used along with Lysergik's Fib Cross, which will allow you to avoid false signals in the stochastic synergy indicator. If your MA cross (50, 200) indicates a direction change opposite of the stochastic RSI synergy indicator then that is a signal to wait for more price action to determine your entry/exit points.
Using the Lysergik's Fib Cross, the same applies, but remember that a golden cross (white cross symbol) followed directly by a golden ratio cross (gold cross symbol) is even further indication that the stochastic RSI needs more breathing room before reversing.
This indicator is fully adjustable for you to back-test against charts and refine the indicator to your market.
The inputs in respective order are as follows:
RSI Length, Stoch Length, Smooth K, Smooth D, Upper Limit, Lower Limit, Basis
Enjoy and remember only make trades on your own terms.
Happy trading/investing! :)

RSI and Stoch RSI Midline Crossover ArrowsPuts arrows on chart when RSI crosses over 52 and also when Stoch RSI crosses up 52 based on Warsnop strategy.


Mby_test straegythis indicator based on Mby_stoch and CCI flow +etc
this indicator got about 66% benefits.

RSI + Stochastic RSI Indicator CombinedFree to use RSI and Stochastic RSI, combined within one indicator.
The RSI and Stochastic RSI are two of the most commonly used and respected indicators in trading technical analysis. By placing them on top of each other you can save valuable space on your chart and stay more easily within your TradingView indicator limit.
The RSI is bright blue, with the "neutral" 30-70 chart area shaded blue.
The Stoch RSI is red and blue, with the "neutral" 20-80 chart area shaded purple.
None of the other annotations shown above will appear, they are only to demonstrate how they can be interpreted.
So what does the RSI do?
Broadly speaking, the Relative Strength Index measures the strength and movements of a market.
Above 70 the RSI is considered oversold = an increased likelihood of an incoming price drop.
Below 30 the RSI is considered undersold = an increased likelihood of an incoming price rise.
What does the Stochastic RSI do?
Broadly speaking, the Stochastic RSI measures the momentum of a market. It does this by measuring the RSI relative to its own high/low over the previous period.
Above 80 the Stoch RSI is considered oversold = an increased likelihood of an incoming price drop.
Below 20 the Stoch RSI is considered undersold = an increased likelihood of an incoming price rise.
Look for when the two Stoch RSI lines cross over - it is an important signal.
When the blue line is on top we have momentum driving the price up; when the red line is on top we have momentum driving the price down.
The key here is to look for periods where both the RSI and Stoch RSI are both low at the same time (especially on the daily chart) = an extremely promising entry point to catch a move up. Equally, looking for periods where both the RSI and Stoch RSI are very high is likely a good exit point (or at least a time to make absolutely certain you have a suitable stop-loss in place), because a price drop is likely not far away.
Remember: the Stoch RSI does not always fluctuate cleanly between the top and bottom. At any time it can change direction to reflect market conditions, which is why a stop loss is essential at all times. Equally, just because the RSI or Stoch RSI is at 100, it is still possible for it to keep going up due to whale action or traders FOMOing in. The same applies at low levels. Both these indicators represent historical data and therefore are not strictly predictive in nature, but show trends that may be in action.
Please give me a thumbs up and follow me if you found this useful. This tool is for educational purposes only and not a recommendation to buy or sell. Always do your own research before trading. Make sure to add this to your favourite scripts.
Best wishes,
BCryptological
ps - combine this powerful indicator with knowledge of strong support and resistance points with the 50/100/200 Moving Average . This will help you identify likely entry/exit points to maximise the accuracy of your predictions.

3 Oscillator (RSI + Stochastics + MFI) with over bought/soldThis is a combined oscillator indicator which includes:
Relative Strength Index ( RSI )
Money Flow Index ( MFI )
Stochastic or StochasticRSI
In addition there are some advanced features including:
Custom time frame (Have the indicator running 5 minute candles while on a 1 hour chart)
Highlight Overbought/Oversold (The intensity of highlight changes when it is 5% below the threshold to 5% above the threshold)
Moving average trend for highlights (This will prevent the threshold-5 highlight from showing in a uptrend to reduce false signals)
It is important to know that the highlight feature is not designed as a buy/sell signal, it is only there as and oversold/overbought indicator to suggest when a trend change may be approaching.
The highlights are dependent on all three oscillators being above or below their thresholds respectively, this is to provide confluence that the market is indeed oversold and not just a single indicator.
