Liquidity Pool - TradingEDThe use of this indicator is restricted to private use, and it can be used only by invitation. Different functionalities have been added to the original codes, such as alerts and signals that seek to make trading much easier to interpret by any type of trading operator of any experience level, from beginner to intermediate and advanced .
Key components:
• Follow the liquidity levels, as they are going to attract the price sooner or later.
• Never open positions opposite to a liquidity level’s direction.
• During the price movement towards a liquidity level, there appears a high probability to cross that level.
• When a liquidity level is crossed, the reversal movement is quite a frequent consequence, as major players are not interested in a level anymore.
When support and resistance levels are held for a long time, the highest liquidity is cumulated above or below those levels, so this is why "Liquidity pools" occur around key support and resistance, or areas on the chart where a lot of trading activity takes place. If you trade, you need this trading activity to get your order filled. Most retail traders don’t have to worry about liquidity when it comes to getting filled. In fact, even some professional swing or trend traders may not have to worry about it. A string of order types cumulates an asset’s liquidity there. This is why investors drive prices into those areas, creating new liquidity levels.
Main functions of this indicator:
1) The SOURCE for the counts can be determined by the trader (close, open, etc).
2) The MEASURE can be based on a CANDLES count if you are trading OHLC Charts from 1D onwards, or if your trading is intraday, you can also select counts by MINUTES, HOURS or DAYS, depending on your trading style.
3) LENGTH, by default it will be loaded as in the STRATEGY, but considering the previous point, you can modify it according to your convenience.
Tradingedcom

Swing Crossings - TradingEDThis case study is based on different previous studies: ADX Performance , MACD Performance & RSI Performance, with different counts to compare different oscillations of each indicator. Actually, this indicator is complementary to those previously mentioned. The use of this indicator is restricted to private use, and it can be used only by invitation. Different functionalities have been added to the original codes, such as alerts and signals that seek to make trading much easier to interpret by any type of trading operator of any experience level, from beginner to intermediate and advanced .
Key components of the original ADX indicator:
• The DIRECTIONAL MOVEMENT INDEX (DMI) is a technical indicator that measures both the strength and direction of a price movement and is intended to reduce false signals.
• The DMI uses two standard indicators, one negative ( -DI ) and one positive ( +DI ), in conjunction with a third, the AVERAGE DIRECTIONAL INDEX ( ADX ), which is non-directional but shows momentum.
• The larger the spread between the two primary lines, the stronger the price trend. If +DI is way above -DI the price trend is strongly up. If -DI is way above +DI then the price trend is strongly down.
• ADX measures the strength of the trend, either up or down; a reading above 20 indicates a strong trend.
ADX is plotted as a single line with values ranging from a low of zero to a high of 100. ADX is non-directional; it registers trend strength whether price is trending up or down. The indicator is usually plotted in the same window as the two DMI lines, from which ADX is derived. When +DI is above -DI , there is more upward pressure than downward pressure in the price. Conversely, if -DI is above +DI , then there is more downward pressure on the price. This indicator may help traders assess the trend direction. Crossovers between the lines are also sometimes used as trade signals to buy or sell, theay are the main trade signals. A long trade is taken when the +DI crosses above the -DI and an uptrend could be underway. Meanwhile, a sell signal occurs when the +DI instead crosses below the -DI .
Key components of the original RSI indicator:
● The Relative Strength Index ( RSI ) is a popular momentum oscillator developed in 1978.
● The RSI provides technical traders signals about bullish and bearish price momentum, and it is often plotted beneath the graph of an asset's price.
● An asset is usually considered overbought when the RSI is above 70% and oversold when it is below 30%.
It is a momentum indicator used in technical analysis that measures the magnitude of recent price changes to assess overbought or oversold conditions in the price of an asset. The RSI is displayed as an oscillator (a line chart moving between two extremes) and can read from 0 to 100. Overbought does not necessarily mean that the price will reverse lower, just as oversold does not mean that the price will reverse higher. Rather, the overbought and oversold conditions simply alert traders that the RSI is near the extremes of its recent readings.
Key components of the original MACD indicator:
● The Moving Average Convergence Divergence ( MACD ) is calculated by subtracting a long period (26) Exponential Moving Average ( EMA ) from a short (12) period EMA .
● MACD triggers technical signals when it crosses above (to buy) or below (to sell) its signal line.
● The speed of crossovers is also taken as a signal of a market is overbought or oversold.
● MACD helps traders to understand whether the bullish or bearish movement in the price is strengthening or weakening.
It is a momentum indicator that follows the trend and shows the relationship between two moving averages of the price of a security. It can function as a trigger for buy and sell signals, when you cross above (to buy) or below (to sell) your signal line. It helps to understand if the movement is bullish or bearish , if it is getting stronger or weaker. The further the MACD is above or below its baseline, it indicates that the distance between the two EMAs will be growing, often shown with a histogram that graphically represents the distance between the MACD and its signal line, and It is used to identify when the bullish or bearish momentum.
Main functions of this modified indicator:
1) The SOURCE for the counts can be determined by the trader (close, open, etc).
2) In some cases, you can select the type of MOVING AVERAGE, among many available options ( SMA , EMA , DEMA , HMA , etc.)
3) The MEASURE can be based on a CANDLES count if you are trading OHLC Charts from 1D onwards, or if your trading is intraday, you can also select counts by MINUTES, HOURS or DAYS, depending on your trading style.
4) LENGTH, by default it will be loaded as in the STRATEGY, but considering the previous point, you can modify it according to your convenience.
5) You have the option to hide or show a LABEL at the top of the chart, with respect to the signals: BULLISH green, BEARISH red. *
6) You have the option to hide or show INDICATORS or SIGNALS based on EACH OSCILLATION.
Main performance functions of this modified indicator:
I) In the case of the PERFORMANCE that appears at the right of the chart, you have the option to adjust the WIDTH of each box.
II) The TEXT of the PERFORMANCE is not modifiable, but you can customize the default color. *
III) The BACKGROUND of the PERFORMANCE, you can customize the default color. *
IV) You have the option to hide or show a PERFORMANCE that appears at the right of the chart.
Main functions to customize the style of this indicator:
a) For any type of SIGNAL, it is painted as a VERTICAL LINE in the graph, you can change the color that comes by default. *
b) In the case of the LABELS that appear at the top, the text is not modifiable, but you can customize both the type of label and change the default color. *
c) When you have a SHORT SIGNAL or a LONG SIGNAL, you can change the EMOTICON that comes by default. **
* By default, they are marked as red for downtrends and green for uptrends.
** By default, they are marked with an emoticon indicating the possible direction of the price, down if it is bearish or up if it is bullish .

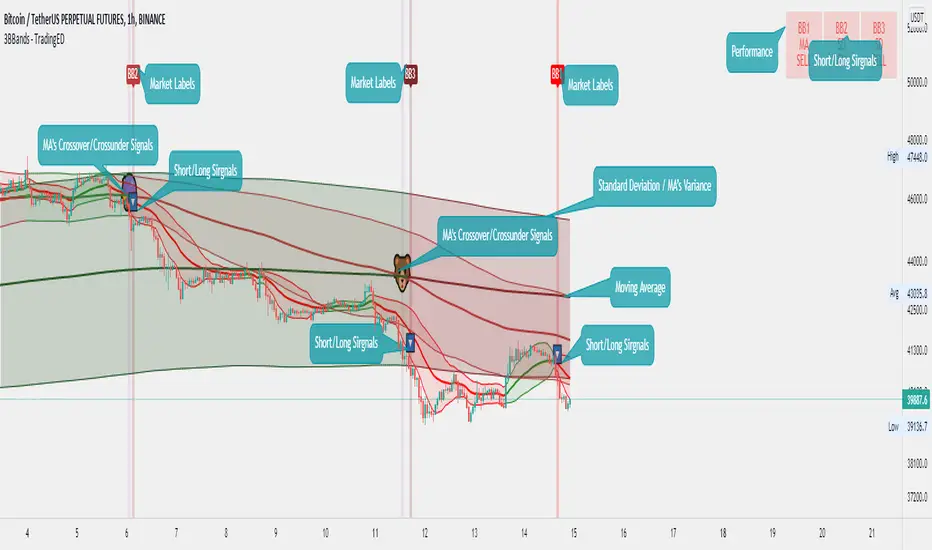
Bollinger Bands Triple - TradingEDThis case study is based on a previous Bollinger Bands study, but with 3 different counts to compare different trends. The use of this indicator is restricted to private use and it can be used only by invitation. Different functionalities have been added to the original code, such as alerts and signals that seek to make trading much easier to interpret by any type of trading operator of any experience level, from beginner to intermediate and advanced .
Key components of the original indicator:
• The Bollinger Bands are a technical analysis tool developed by John Bollinger to generate signals of overbuying and overselling.
• There are three lines that compose Bollinger Bands: one Simple Moving Average (middle band) and an upper and lower band.
• The Upper and Lower Bands are typically used with 2 Standard Deviations +/- of a 20-day Simple Moving Average (or 20 candles) but can be modified.
The use of Bollinger Bands is based on the concept of mean price reversal, assuming that if the price deviates from the Moving Average it will eventually return to the mean price. As recognized by its creator: John Bollinger , " the touches of the bands are just that, touches, not signals ".
So, a touch from the top is not in itself a sell signal and vice versa, a touch below should not be a buy signal either. A trader must look at the general direction of the price and then only take signals that align with the trend. For example, if the trend is down, you should only consider short positions when the lower band is indicated, and in case of an uptrend, take only long positions.
Another important point in the use of this indicator is that the bands will expand and contract as the Price Action becomes volatile (expansion) or is limited in its trading pattern (contraction). After a strong rise or fall in the trend, the market may consolidate, trading closely and crossing over and below the Moving Average until defining a new course, or continuing with the previous direction.
Main functions of this modified indicator:
1) You can select the type of MOVING AVERAGE , among many available options ( SMA , EMA , DEMA , HMA , etc.)
2) The SOURCE for the count can be determined by the trader (close, open, etc).
3) The MEASURE can be based on a CANDLES count if you are trading OHLC Charts from 1D onwards, or if your trading is intraday, you can also select counts by MINUTES , HOURS or DAYS , depending on your trading style.
4) LENGTH , by default it will be loaded as 20 but considering the previous point, you can modify it according to your convenience.
5) STANDARD DEVIATION , by default it will come loaded with 2 deviations, but you can modify it according to your convenience to operate.
6) You have the option to hide or show a LABEL at the top of the chart, with respect to the signals: bullish green, bearish red.
7) You have the option to hide or show SIGNALS based on the MOVING AVERAGE that you have previously chosen.
8) You have the option to hide or show SIGNALS based on the STANDARD DEVIATION that you have previously chosen.
Main functions to customize the style of this indicator:
a) You can select the colors for the UPPER BAND, MOVING AVERAGE and LOWER BAND depending on the trend, whether it is BEARISH or BULLISH , with the colors that best suit you. *
b) When you have a SHORT SIGNAL or a LONG SIGNAL , you can change the EMOTICON that comes by default. **
c) For any type of SIGNAL , it is painted as a VERTICAL LINE in the graph, you can change the color that comes by default. *
d) In the case of the LABELS that appear at the top, the text is not modifiable, but you can customize both the type of label and change the default color. *
e) You can select the colors for the BACKGROUND of the indicator according to the trend, whether it is BEARISH or BULLISH , with the colors that best suit you. *
* By default, they are marked as red for downtrends and green for uptrends.
** By default, they are marked with an emoticon indicating the possible direction of the price, down if it is bearish or up if it is bullish .
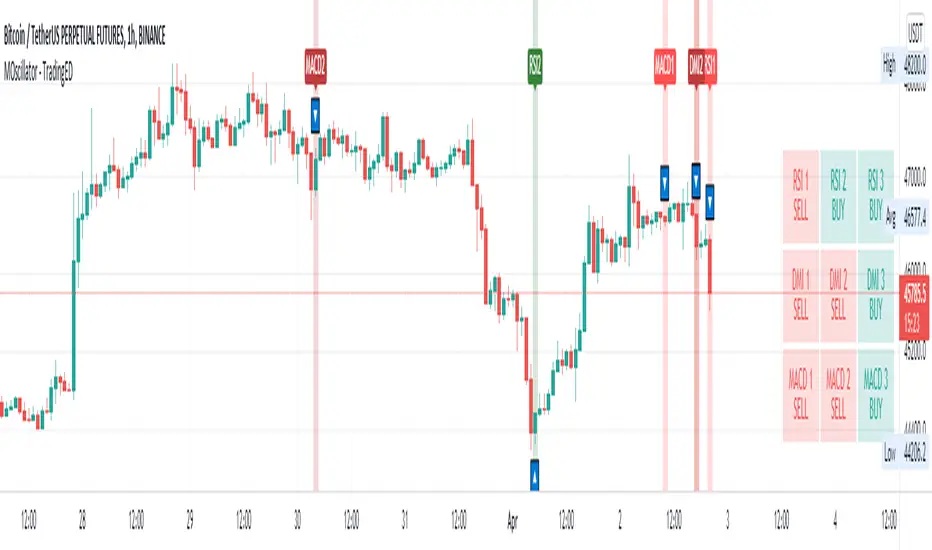
Multiple Oscillator Crossing - TradingEDThis case study is based on different previous studies: ADX Triple , MACD Triple & RSI Triple , with three different counts to compare different oscillations of each indicator. Actually, this indicator is complementary to those previously mentioned . The use of this indicator is restricted to private use, and it can be used only by invitation. Different functionalities have been added to the original codes, such as alerts and signals that seek to make trading much easier to interpret by any type of trading operator of any experience level , from beginner to intermediate and advanced .
Key components of the original ADX indicator:
• The DIRECTIONAL MOVEMENT INDEX (DMI) is a technical indicator that measures both the strength and direction of a price movement and is intended to reduce false signals.
• The DMI uses two standard indicators, one negative ( -DI ) and one positive ( +DI ), in conjunction with a third, the AVERAGE DIRECTIONAL INDEX ( ADX ), which is non-directional but shows momentum.
• The larger the spread between the two primary lines, the stronger the price trend. If +DI is way above -DI the price trend is strongly up. If -DI is way above +DI then the price trend is strongly down.
• ADX measures the strength of the trend, either up or down; a reading above 20 indicates a strong trend.
ADX is plotted as a single line with values ranging from a low of zero to a high of 100. ADX is non-directional; it registers trend strength whether price is trending up or down. The indicator is usually plotted in the same window as the two DMI lines, from which ADX is derived. When +DI is above -DI, there is more upward pressure than downward pressure in the price. Conversely, if -DI is above +DI, then there is more downward pressure on the price. This indicator may help traders assess the trend direction. Crossovers between the lines are also sometimes used as trade signals to buy or sell, theay are the main trade signals. A long trade is taken when the +DI crosses above the -DI and an uptrend could be underway. Meanwhile, a sell signal occurs when the +DI instead crosses below the -DI.
Key components of the original RSI indicator:
● The Relative Strength Index ( RSI ) is a popular momentum oscillator developed in 1978.
● The RSI provides technical traders signals about bullish and bearish price momentum, and it is often plotted beneath the graph of an asset's price.
● An asset is usually considered overbought when the RSI is above 70% and oversold when it is below 30%.
It is a momentum indicator used in technical analysis that measures the magnitude of recent price changes to assess overbought or oversold conditions in the price of an asset. The RSI is displayed as an oscillator (a line chart moving between two extremes) and can read from 0 to 100. Overbought does not necessarily mean that the price will reverse lower, just as oversold does not mean that the price will reverse higher. Rather, the overbought and oversold conditions simply alert traders that the RSI is near the extremes of its recent readings.
Key components of the original MACD indicator:
● The Moving Average Convergence Divergence ( MACD ) is calculated by subtracting a long period (26) Exponential Moving Average ( EMA ) from a short (12) period EMA .
● MACD triggers technical signals when it crosses above (to buy) or below (to sell) its signal line.
● The speed of crossovers is also taken as a signal of a market is overbought or oversold.
● MACD helps traders to understand whether the bullish or bearish movement in the price is strengthening or weakening.
It is a momentum indicator that follows the trend and shows the relationship between two moving averages of the price of a security. It can function as a trigger for buy and sell signals, when you cross above (to buy) or below (to sell) your signal line. It helps to understand if the movement is bullish or bearish , if it is getting stronger or weaker. The further the MACD is above or below its baseline, it indicates that the distance between the two EMAs will be growing, often shown with a histogram that graphically represents the distance between the MACD and its signal line, and It is used to identify when the bullish or bearish momentum.
Main functions of this modified indicator:
1) The SOURCE for the counts can be determined by the trader (close, open, etc).
2) In some cases, you can select the type of MOVING AVERAGE , among many available options ( SMA , EMA , DEMA , HMA , etc.)
3) The MEASURE can be based on a CANDLES count if you are trading OHLC Charts from 1D onwards , or if your trading is intraday, you can also select counts by MINUTES , HOURS or DAYS , depending on your trading style.
4) LENGTH , by default it will be loaded as in the STRATEGY , but considering the previous point, you can modify it according to your convenience.
5) You have the option to hide or show a LABEL at the top of the chart, with respect to the signals: BULLISH green, BEARISH red. *
6) You have the option to hide or show INDICATORS or SIGNALS based on EACH OSCILLATION .
Main performance functions of this modified indicator:
I) In the case of the PERFORMANCE that appears at the right of the chart, you have the option to adjust the WIDTH of each box.
II) The TEXT of the PERFORMANCE is not modifiable, but you can customize the default color. *
III) The BACKGROUND of the PERFORMANCE , you can customize the default color. *
IV) You have the option to hide or show a PERFORMANCE that appears at the right of the chart.
Main functions to customize the style of this indicator:
a) For any type of SIGNAL , it is painted as a VERTICAL LINE in the graph, you can change the color that comes by default. *
b) In the case of the LABELS that appear at the top, the text is not modifiable, but you can customize both the type of label and change the default color. *
c) When you have a SHORT SIGNAL or a LONG SIGNAL , you can change the EMOTICON that comes by default. **
* By default, they are marked as red for downtrends and green for uptrends.
** By default, they are marked with an emoticon indicating the possible direction of the price, down if it is bearish or up if it is bullish .
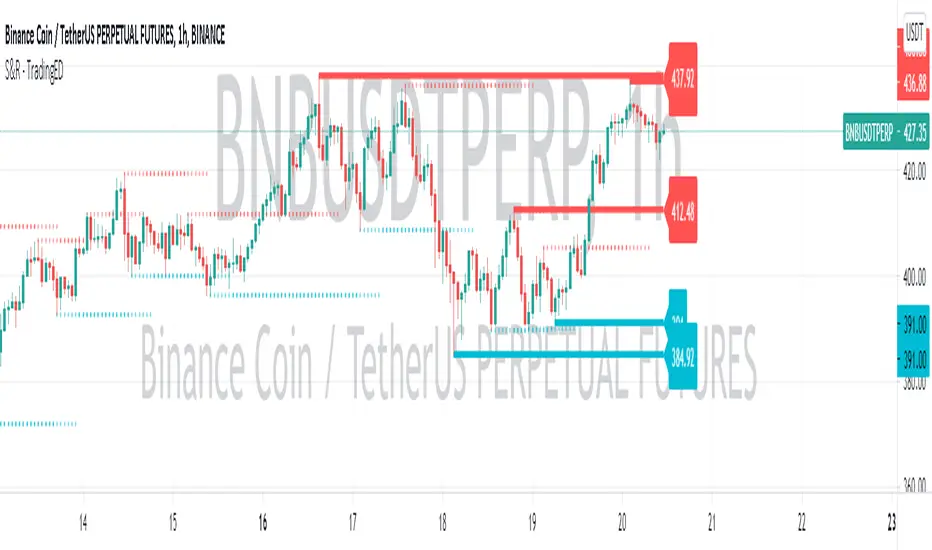
Support & Resistance - TradingEDThe use of this indicator is restricted to private use, and it can be used only by invitation. Different functionalities have been added, such as alerts and signals that seek to make trading much easier to interpret by any type of trading operator of any experience level, from beginner to intermediate and advanced.
This indicator will help you identify support and resistance levels over a previously determined range, whether from a count by candles , by minutes , hours or days . These support and resistance levels are calculated thanks to the highest and lowest points that will be painted along the chart, from the levels that you have previously selected .
You will even have a way to identify the most recent levels , thanks to the fact that they will be painted in a darker tone , as well as some price labels to quickly identify each of the levels on the chart . Identifying these levels sometimes seems like a pretty difficult task, but with this indicator you will discover that it will be much easier than you think to be able to master these levels.
As part of the analysis of chart patterns, traders use these price levels on charts that tend to act as barriers, preventing the price of an asset from being pushed in a certain direction. Support and resistance levels serve to identify the points where the price can favor certain probabilities for a stagnation or reversal of a prevailing trend.
Main functions of this indicator:
1) The MEASURE can be based on a CANDLES count if you are trading OHLC Charts from 1D onwards , or if your trading is intraday, you can also select counts by MINUTES , HOURS or DAYS , depending on your trading style.
2) LENGTH , by default it will be loaded as in the STRATEGY , but considering the previous point, you can modify it according to your convenience.
3) You have the option to hide or show the EXTENDED LEVELS the way to identify the most recent levels.
4) You have the option to hide or show a LABEL at the right of the chart, with respect to the price levels.
Main functions to customize the style of this indicator:
a) You can select the COLOR for Support and for Resistance, with the colors that best suit you.
b) In the case of the LABELS that appear at the right, the text, type of label and default color is not modifiable.
ADX Triple - Average Directional Movement Index - TradingEDThis case study is based on a previous ADX + DM study, but with three different counts to compare different trends. The use of this indicator is restricted to private use, and it can be used only by invitation. Different functionalities have been added to the original code, such as alerts and signals that seek to make trading much easier to interpret by any type of trading operator of any experience level, from beginner to intermediate and advanced.
Key components of the original indicator:
• The DIRECTIONAL MOVEMENT INDEX (DMI) is a technical indicator that measures both the strength and direction of a price movement and is intended to reduce false signals.
• The DMI uses two standard indicators, one negative (-DI) and one positive (+DI), in conjunction with a third, the AVERAGE DIRECTIONAL INDEX (ADX), which is non-directional but shows momentum.
• The larger the spread between the two primary lines, the stronger the price trend. If +DI is way above -DI the price trend is strongly up. If -DI is way above +DI then the price trend is strongly down.
• ADX measures the strength of the trend, either up or down; a reading above 20 indicates a strong trend.
ADX is plotted as a single line with values ranging from a low of zero to a high of 100. ADX is non-directional; it registers trend strength whether price is trending up or down. The indicator is usually plotted in the same window as the two DMI lines, from which ADX is derived. When +DI is above -DI , there is more upward pressure than downward pressure in the price. Conversely, if -DI is above +DI , then there is more downward pressure on the price. This indicator may help traders assess the trend direction. Crossovers between the lines are also sometimes used as trade signals to buy or sell, theay are the main trade signals. A long trade is taken when the +DI crosses above the -DI and an uptrend could be underway. Meanwhile, a sell signal occurs when the +DI instead crosses below the -DI .
Main functions of this modified indicator:
1) You can select the type of MOVING AVERAGE , among many available options (SMA, EMA, DEMA, HMA, etc.)
2) The SOURCE for the counts can be determined by the trader (close, open, etc).
3) The MEASURE can be based on a CANDLES count if you are trading OHLC Charts from 1D onwards , or if your trading is intraday, you can also select counts by MINUTES , HOURS or DAYS , depending on your trading style.
4) LENGTH , by default it will be loaded as in the STRATEGY , but considering the previous point, you can modify it according to your convenience.
5) You have the option to hide or show a LABEL at the top of the chart, with respect to the signals: BULLISH green, BEARISH red.
Main performance functions of this modified indicator:
I) In the case of the PERFORMANCE that appears at the right of the chart, you have the option to adjust the WIDTH of each box.
II) The TEXT of the PERFORMANCE is not modifiable, but you can customize the default color. *
III) The BACKGROUND of the PERFORMANCE , you can customize the default color. *
IV) You have the option to hide or show a PERFORMANCE that appears at the right of the chart.
Main functions to customize the style of this indicator:
a) You can select the color for ADX and for DMI , with the colors that best suit you.
b) The CROSSOVER/CROSSUNDER signal between DI+ and DI- can also be customized. *
c) For any type of SIGNAL , it is painted as a VERTICAL LINE in the graph, you can change the color that comes by default. *
d) In the case of the LABELS that appear at the top, the text is not modifiable, but you can customize both the type of label and change the default color. *
e) You can select the colors for the BACKGROUND of the indicator according to the trend, whether it is BEARISH or BULLISH , with the colors that best suit you. *
* By default, they are marked as red for downtrends and green for uptrends.

MACD Triple - Moving Average Convergence Divergence - TradingEDThis case study is based on a previous MACD study, but with three different counts to compare different trends. The use of this indicator is restricted to private use, and it can be used only by invitation. Different functionalities have been added to the original code, such as alerts and signals that seek to make trading much easier to interpret by any type of trading operator of any experience level, from beginner to intermediate and advanced.
Key components of the original indicator:
● The Moving Average Convergence Divergence (MACD) is calculated by subtracting a long period (26) Exponential Moving Average (EMA) from a short (12) period EMA.
● MACD triggers technical signals when it crosses above (to buy) or below (to sell) its signal line.
● The speed of crossovers is also taken as a signal of a market is overbought or oversold.
● MACD helps traders to understand whether the bullish or bearish movement in the price is strengthening or weakening.
It is a momentum indicator that follows the trend and shows the relationship between two moving averages of the price of a security. It can function as a trigger for buy and sell signals, when you cross above (to buy) or below (to sell) your signal line. It helps to understand if the movement is bullish or bearish, if it is getting stronger or weaker. The further the MACD is above or below its baseline, it indicates that the distance between the two EMAs will be growing, often shown with a histogram that graphically represents the distance between the MACD and its signal line, and It is used to identify when the bullish or bearish momentum.
Main functions of this modified indicator:
1) You can select the type of MOVING AVERAGE , among many available options (SMA, EMA, DEMA, HMA, etc.)
2) The SOURCES for the counts can be determined by the trader (close, open, etc).
3) The MEASURE can be based on a CANDLES count if you are trading OHLC Charts from 1D onwards , or if your trading is intraday, you can also select counts by MINUTES , HOURS or DAYS , depending on your trading style.
4) LENGTH , by default it will be loaded as in the STRATEGY , but considering the previous point, you can modify it according to your convenience.
5) You have the option to hide or show the HISTOGRAM or even the MACD if you want to see one of them.
6) You have the option to hide or show a LABEL at the top of the chart, with respect to the signals: BULLISH green, BEARISH red.
Main performance functions of this modified indicator:
I) In the case of the PERFORMANCE that appears at the right of the chart, you have the option to adjust the WIDTH of each box.
II) The TEXT of the PERFORMANCE is not modifiable, but you can customize the default color. *
III) The BACKGROUND of the PERFORMANCE , you can customize the default color. *
IV) You have the option to hide or show a PERFORMANCE that appears at the right of the chart.
Main functions to customize the style of this indicator:
a) You can select the colors for the FAST LENGTH , SLOW LENGTH AND HISTOGRAM with the colors that best suit you. * **
b) For any type of SIGNAL , it is painted as a VERTICAL LINE in the graph, you can change the color that comes by default. *
c) In the case of the LABELS that appear at the top, the text is not modifiable, but you can customize both the type of label and change the default color. *
d) You can select the colors for the BACKGROUND of the indicator according to the trend, whether it is BEARISH or BULLISH , with the colors that best suit you. *
e) You can select the color for the ZERO LEVEL , with the colors that best suit you.
* By default, they are marked as red for downtrends and green for uptrends.
** By default, they are marked as orange for downtrends and blue for uptrends.

RSI - Relative Strength Index Triple - TradingEDThis case study is based on a previous RSI study, but with three different counts to compare different trends. The use of this indicator is restricted to private use, and it can be used only by invitation. Different functionalities have been added to the original code, such as alerts and signals that seek to make trading much easier to interpret by any type of trading operator of any experience level, from beginner to intermediate and advanced.
Key components of the original indicator:
● The Relative Strength Index (RSI) is a popular momentum oscillator developed in 1978.
● The RSI provides technical traders signals about bullish and bearish price momentum, and it is often plotted beneath the graph of an asset's price.
● An asset is usually considered overbought when the RSI is above 70% and oversold when it is below 30%.
It is a momentum indicator used in technical analysis that measures the magnitude of recent price changes to assess overbought or oversold conditions in the price of an asset. The RSI is displayed as an oscillator (a line chart moving between two extremes) and can read from 0 to 100. Overbought does not necessarily mean that the price will reverse lower, just as oversold does not mean that the price will reverse higher. Rather, the overbought and oversold conditions simply alert traders that the RSI is near the extremes of its recent readings.
Main functions of this modified indicator:
1) The SOURCE for the counts can be determined by the trader (close, open, etc).
2) You can select the type of MOVING AVERAGE , among many available options ( SMA , EMA , DEMA , HMA , etc.)
3) The MEASURE can be based on a CANDLES count if you are trading OHLC Charts from 1D onwards , or if your trading is intraday, you can also select counts by MINUTES, HOURS or DAYS , depending on your trading style.
4) LENGTH , by default it will be loaded as in the STRATEGY , but considering the previous point, you can modify it according to your convenience.
5) You have the option to hide or show a LABEL at the top of the chart, with respect to the signals: BULLISH green, BEARISH red.
Main performance functions of this modified indicator:
I) In the case of the PERFORMANCE that appears at the right of the chart, you have the option to adjust the WIDTH of each box.
II) The TEXT of the PERFORMANCE is not modifiable, but you can customize the default color. *
III) The BACKGROUND of the PERFORMANCE , you can customize the default color. *
IV) You have the option to hide or show a PERFORMANCE that appears at the right of the chart.
Main functions to customize the style of this indicator:
a) You can select the color for the ADJUSTED LEVEL and for the MOVING AVERAGE , with the colors that best suit you.
b) The CROSSOVER/CROSSUNDER signal between the MOVING AVERAGE and the ADJUSTED LEVEL can also be customized. *
c) For any type of SIGNAL , it is painted as a VERTICAL LINE in the graph, you can change the color that comes by default. *
d) In the case of the LABEL that appear at the top, the text is not modifiable, but you can customize both the type of label and change the default color. *
e) You can select the color for OVERVALUED and for UNDERVALUED levels, with the colors that best suit you.
f) You can select the colors for the BACKGROUND of the indicator according to the trend, whether it is BEARISH or BULLISH , with the colors that best suit you. *
* By default, they are marked as red for downtrends and green for uptrends.

Bollinger Bands Double - TradingEDThis case study is based on a previous Bollinger Bands study, but with two different counts to compare different trends. The use of this indicator is restricted to private use and it can be used only by invitation. Different functionalities have been added to the original code, such as alerts and signals that seek to make trading much easier to interpret by any type of trading operator of any experience level, from beginner to intermediate and advanced.
Key components of the original indicator:
• The Bollinger Bands are a technical analysis tool developed by John Bollinger to generate signals of overbuying and overselling.
• There are three lines that compose Bollinger Bands: one Simple Moving Average (middle band) and an upper and lower band.
• The Upper and Lower Bands are typically used with 2 Standard Deviations +/- of a 20-day Simple Moving Average (or 20 candles) but can be modified.
The use of Bollinger Bands is based on the concept of mean price reversal, assuming that if the price deviates from the Moving Average it will eventually return to the mean price. As recognized by its creator: John Bollinger, "the touches of the bands are just that, touches, not signals" .
So, a touch from the top is not in itself a sell signal and vice versa, a touch below should not be a buy signal either. A trader must look at the general direction of the price and then only take signals that align with the trend. For example, if the trend is down, you should only consider short positions when the lower band is indicated, and in case of an uptrend, take only long positions.
Another important point in the use of this indicator is that the bands will expand and contract as the Price Action becomes volatile (expansion) or is limited in its trading pattern (contraction). After a strong rise or fall in the trend, the market may consolidate, trading closely and crossing over and below the Moving Average until defining a new course, or continuing with the previous direction.
Main functions of this modified indicator:
1) You can select the type of MOVING AVERAGE , among many available options (SMA, EMA, DEMA, HMA, etc.)
2) The SOURCE for the count can be determined by the trader (close, open, etc).
3) The MEASURE can be based on a CANDLES count if you are trading OHLC Charts from 1D onwards, or if your trading is intraday, you can also select counts by MINUTES , HOURS or DAYS , depending on your trading style.
4) LENGTH , by default it will be loaded as 20 but considering the previous point, you can modify it according to your convenience.
5) STANDARD DEVIATION , by default it will come loaded with 2 deviations, but you can modify it according to your convenience to operate.
6) You have the option to hide or show a LABEL at the top of the chart, with respect to the signals: bullish green, bearish red.
7) You have the option to hide or show SIGNALS based on the MOVING AVERAGE that you have previously chosen.
8) You have the option to hide or show SIGNALS based on the STANDARD DEVIATION that you have previously chosen.
Main functions to customize the style of this indicator:
a) You can select the colors for the UPPER BAND , MOVING AVERAGE and LOWER BAND depending on the trend, whether it is BEARISH or BULLISH , with the colors that best suit you. *
b) When you have a SHORT SIGNAL or a LONG SIGNAL , you can change the EMOTICON that comes by default. **
c) For any type of SIGNAL , it is painted as a VERTICAL LINE in the graph, you can change the color that comes by default. *
d) In the case of the LABELS that appear at the top, the text is not modifiable, but you can customize both the type of label and change the default color. *
e) You can select the colors for the BACKGROUND of the indicator according to the trend, whether it is BEARISH or BULLISH , with the colors that best suit you. *
* By default, they are marked as red for downtrends and green for uptrends.
** By default, they are marked with an emoticon indicating the possible direction of the price, down if it is bearish or up if it is bullish.
