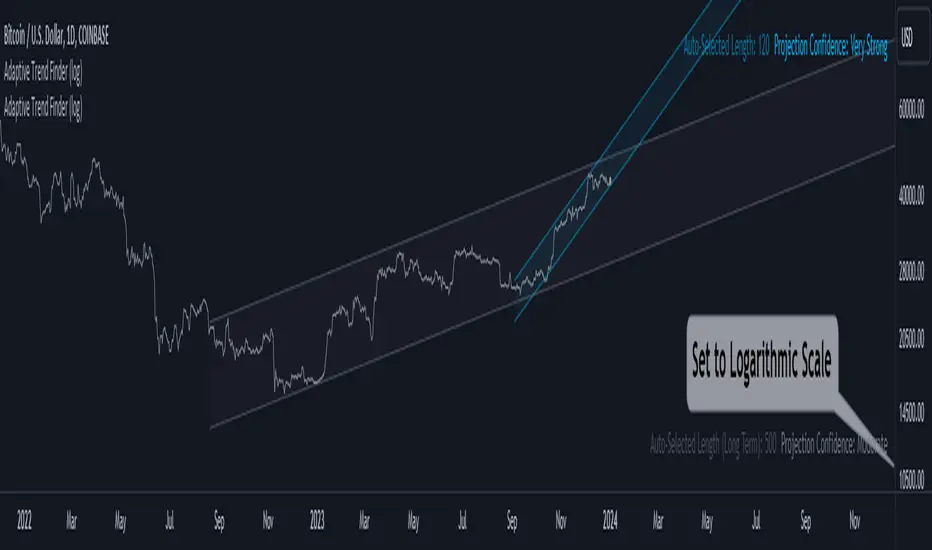
Adaptive Trend Finder (log)In the dynamic landscape of financial markets, the Adaptive Trend Finder (log) stands out as an example of precision and professionalism. This advanced tool, equipped with a unique feature, offers traders a sophisticated approach to market trend analysis: the choice between automatic detection of the long-term or short-term trend channel.
Key Features:
1. Choice Between Long-Term or Short-Term Trend Channel Detection: Positioned first, this distinctive feature of the Adaptive Trend Finder (log) allows traders to customize their analysis by choosing between the automatic detection of the long-term or short-term trend channel. This increased flexibility adapts to individual trading preferences and changing market conditions.
2. Autonomous Trend Channel Detection: Leveraging the robust statistical measure of the Pearson coefficient, the Adaptive Trend Finder (log) excels in autonomously locating the optimal trend channel. This data-driven approach ensures objective trend analysis, reducing subjective biases, and enhancing overall precision.
3. Precision of Logarithmic Scale: A distinctive characteristic of our indicator is its strategic use of the logarithmic scale for regression channels. This approach enables nuanced analysis of linear regression channels, capturing the subtleties of trends while accommodating variations in the amplitude of price movements.
4. Length and Strength Visualization: Traders gain a comprehensive view of the selected trend channel, with the revelation of its length and quantification of trend strength. These dual pieces of information empower traders to make informed decisions, providing insights into both the direction and intensity of the prevailing trend.
In the demanding universe of financial markets, the Adaptive Trend Finder (log) asserts itself as an essential tool for traders, offering an unparalleled combination of precision, professionalism, and customization. Highlighting the choice between automatic detection of the long-term or short-term trend channel in the first position, this indicator uniquely caters to the specific needs of each trader, ensuring informed decision-making in an ever-evolving financial environment.
Pine Script® indicator