Breakout Trend Trading Strategy - V2This is an alternate version of Breakout Trend Trading Strategy - V1
Only difference is, this strategy places stop orders based on calculated targets whereas V1 waits for price to close target levels and then places market orders. Hence, you will receive the target prices before trade executes in strategy.
Parameters are same as that of Breakout Trend Trading Strategy - V1
There is one additional parameter on Trade Type - which permits user to allow only breakout, pullback or reverse trading or combination of all.
Backtesting parameters remain same :
Capital and position sizing : Capital and position sizing parameters are set to test investing 2000 wholly on certain stock without compounding.
Initial Capital : 2000
Order Size : 100% of equity
Pyramiding : 1
Test cases remain same :
Positive : AAPL , AMZN , TSLA , RUN, VRT , ASX:APT
Negative Test Cases: WPL , WHC , NHC , WOW, COL, NAB (All ASX stocks)
Special test case: WDI
Negative test cases still show losses in back-testing. I have attempted including many conditions to eliminate or reduce the loss. But, further efforts has resulted in reduction in profits in positive cases as well. Still experimenting. Will update whenever I find improvements. Comments and suggestions welcome :)
Trendtrading

Breakout Trend Trading Strategy - V1Strategy in nutshell:
This strategy is made to be used in daily time-frames. Works better on trending instruments where volume is available. Hence, this is more suitable for trending shares rather than currencies, commodities and indexes where volume data is either not present or not reliable.
Breakout signifies the continuation of trend. Hence, trade in the direction of breakouts. Breakouts are calculated based on high volume and price movement in a day. This will be combined with few other conditions to generate buy and sell signals along with stop and compound targets. Supertrend is used for trend bias. Our buy and sell targets do not directly depend on the bias. But, entry criteria in opposite trend is made much difficult than that of trend direction. Further explanation of method and input parameters are explained below.
Backtesting parameters :
Capital and position sizing : Capital and position sizing parameters are set to test investing 2000 wholly on certain stock without compounding.
Initial Capital : 2000
Order Size : 100% of equity
Pyramiding : 1
ExitOnSignal : If unchecked exit is triggered solely on trailing stop
Trade Direction : Long, Short or All. Short condition is riskier than long conditions and often results in losses as per my observation. On most of the stocks trending up, strategy will not generate any short signals. This is achieved by comparing yearly high lows to previous two years to decide whether to allow short or long entries.
allowImmediateCompound : Applicable only if compounding/pyramiding is enabled in trade. If checked allows to place compounding orders immediately. If unchecked, it waits for stopline to cross order price before placing next compound.
Display Mode :
Targets : Whenever breakout happens, show marker for upTarget and downTarget
TargetChannel : Show up target and downtarget as a channel
Target With Stop : Along with targets, show also stop levels for breakouts
Up Channel : Channel created from UpTarget and respective stops
Down Channel : Channel created from DownTarget and respective stops
ShowTrailingStop : Shows trailing stop and compound lines when there is a trading position.
ShowTargetLevels : Shows Buy Sell target levels along with stop and compound lines. Trades are done as market orders. Hence, target levels are displayed after strategy makes the trade. Since only one order allowed per side without compounding, target, stop and compound levels are shown sometimes even without trade being made. These can be considered as entry levels if there is no existing position.
ShowPreviousLevels : Shows previous buy/sell target levels. When enabled, layout can look messy.
StopMultiplyer: To Set trailing stop loss.
BacktestYears: Number of years to include in backtest
So far my test cases are:
Positive : AAPL, AMZN, TSLA, RUN, VRT, ASX:APT
Negative Test Cases: WPL, WHC, NHC, WOW, COL, NAB (All ASX stocks)
Special test case: WDI
Negative test cases still show losses in backtesting. I have attempted including many conditions to eliminate or reduce the loss. But, further efforts has resulted in reduction in profits in positive cases as well. Still experimenting. Will update whenever I find improvements. Comments and suggestions welcome :)

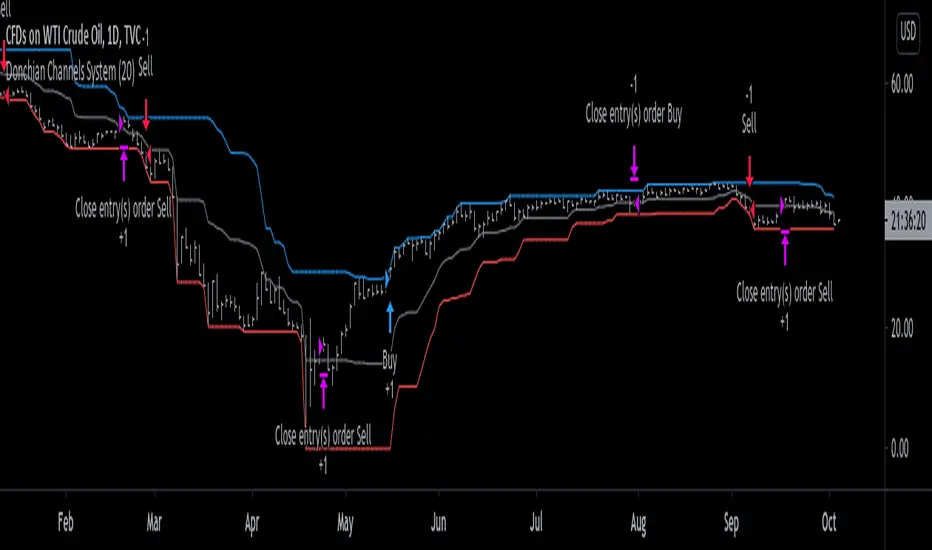
Donchian Channels System [racer8]Donchian Channels was developed by Richard Donchian in 1949. They have been used with great success by the Turtles, a group of traders in the 1980s who managed to obtain returns of 80% annually. Truly incredible story.
This particular indicator is a trend trading system I coded that shows you when to enter long or short and when to exit those longs or shorts.
In addition, this indicator shows the past performance results that are incredibly valuable information for backtesting this system.
The high, mid, and low lines have been plotted to show how this system works. The blue line is the high line. The gray line is the mid line. The red line is the low line.
Entry signals are generated when the current close closes above the highest price for a long trade or below the lowest price for a short trade over n periods.
Exit signals are generated when the current close crosses the mid-line (aka. baseline) and closes.
Baseline = (highest price + lowest price)/2
I encourage you to play around with the settings, although I reccomend avoiding any period below 14.
This system is no bullshit, it's the real deal.
Good luck traders, and enjoy ;)
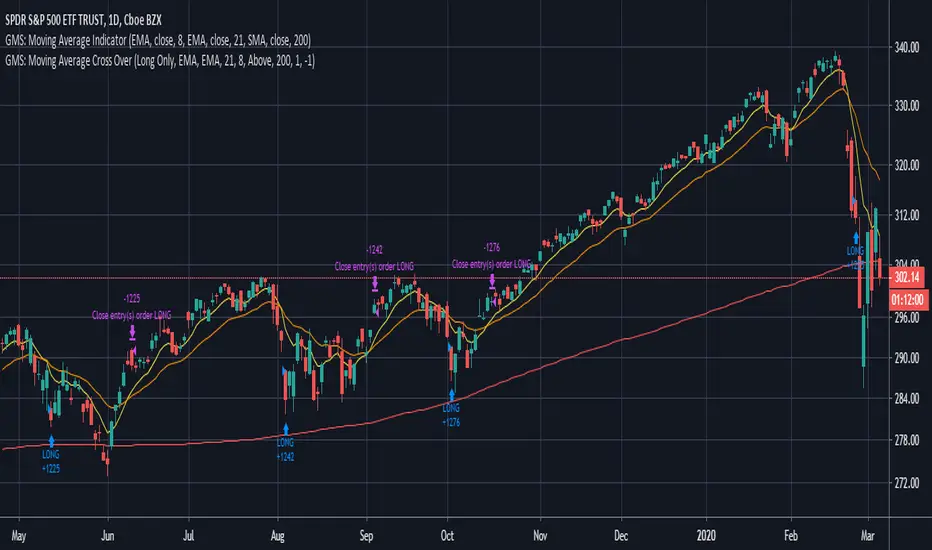
GMS: Moving Average Crossover StrategyThis is a moving average crossover system built the way I would want it to be.
- The moving averages included are SMA, EMA, WMA, VWMA.
- You can select either for the first moving average or the second moving average.
- You can also select to see the Long trades, Short trades, or both at the same time.
- There is also a simple moving average trend filter. When this is selected, it only applies to the entries of a trade and not the exit. There are situations where the entry is above the trend filter and the exit is below.
The source code should be open so feel free to adapt it, make it more efficient, or take some part for your own project!
I hope it helps,
Andre
GMS: RSI & ROC StrategyThis is a basic strategy like the RSI one I posted. This one adds in the Rate of Change indicator as well.
You can separate the two for RSI only and ROC only. Everything else is the same as the RSI strategy.
- Simple moving average trend filter.
- Simple moving average trade exit.
- Both long and short or each on it's own.
The source code should be open if you want to see it or modify it for your own project. I hope it helps!
Andre
Global Market Signals

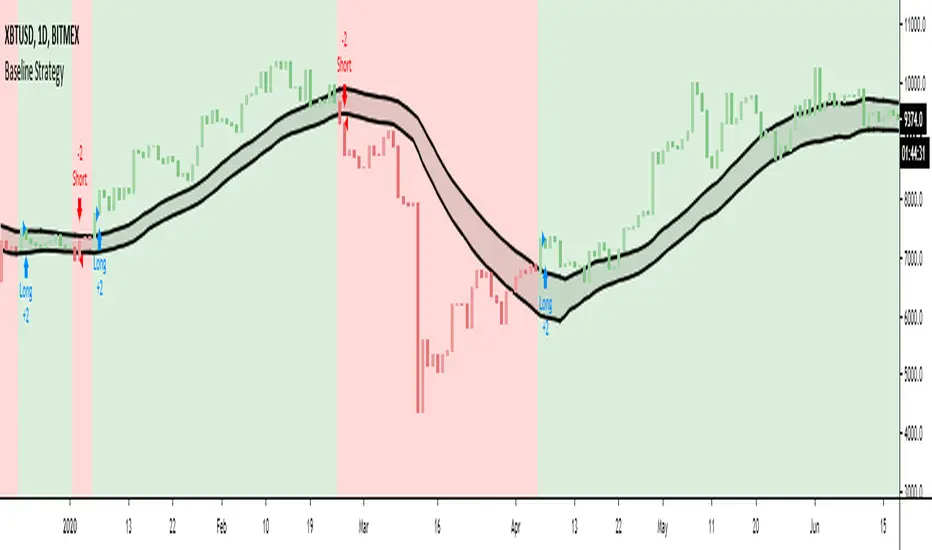
Trend Following or Mean RevertingThe strategy checks nature of the instruments. It Buys if the close is greater than yesterday's high, reverse the position if the close is lower than yesterday's low and repeat the process.
1. If it is trend following then the equity curve will be in uptrend
2. If it is mean reverting then the equity curve will be downtrend
Thanks to Rayner Teo.

Pivot Reversal Strategy - FIGS & DATES 2.0Simple Pivot Reversal Strategy with some adding settings.
Date Range: To test over specific market conditions.
Initial Capitol: $10K - This is a more realistic representation of funds used this strategy (for me anyway). The default of $100K can give different results (usually better) than when using a smaller balance.
Order Size: 100% Equity - These trend following strategies typically used this way, going all in each direction.
Commission: .075% - It's always disheartening to think you've found a ridiculously good setting, and then realize you forgot to add the commission.
All of these settings can be changed, but it's easier for me (and more fool proof) to have them set as default.

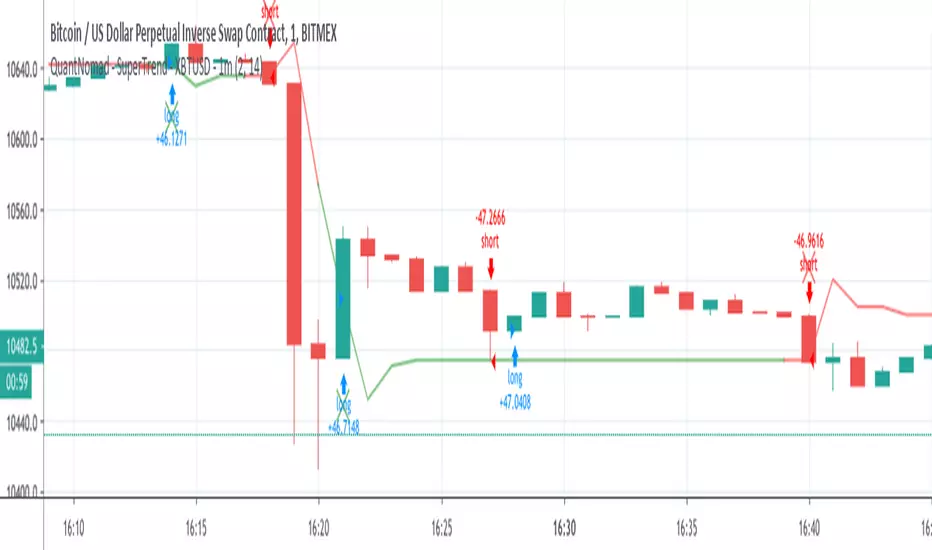
QuantNomad - SuperTrend - XBTUSD - 1mInteresting performance for Super Trend strategy for XBTUSD 1m chart.
Params: ST Mult: 2, ST Period 14.
Performance: 144% profit, 1988 trades, only 41% prof, 2.04% dd , 2.51 Sharpe.
On its own, it might be not a very good strategy, but the big amount of trades allows you to add more filters and improve it.
And remember:
Past performance does not guarantee future results.
QuantNomad - SuperTrend - TSLA - 1mInteresting performance for Super Trend strategy for Tesla ( TSLA ) 1m chart.
Params: ST Mult: 3, ST Period 120.
Performance:61% profit, 637 trades, only 33% prof, 4.84% dd , 0.4 Sharpe.
On its own, it might be not a very good strategy, but the big amount of trades allows you to add more filters and improve it.
The strategy is not bad both with "when" params when strategy executed on open of next bar and with stop orders when strategy enters on exact Super Trend level.
You can comment/uncomment lines in the code and switch from one approach to another.
And remember:
Past performance does not guarantee future results.

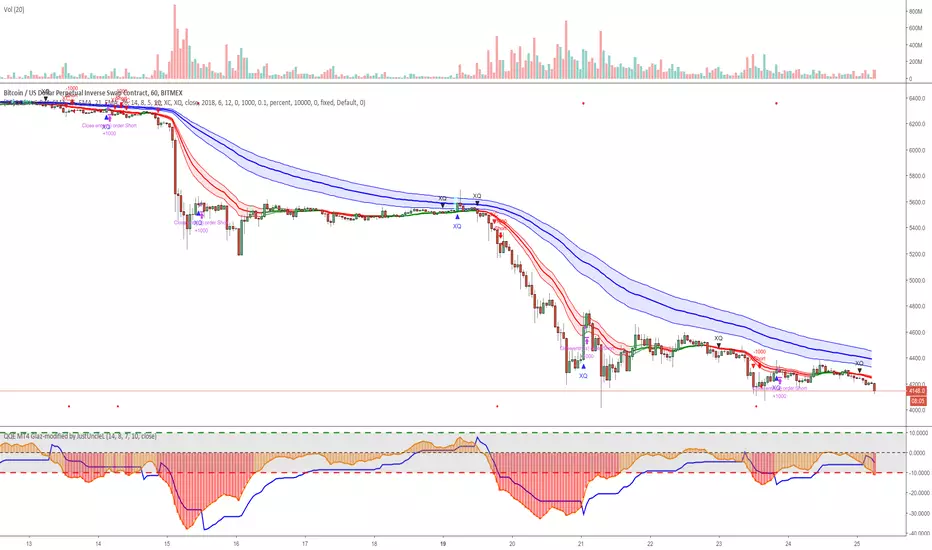
[Backtest]QQE Cross v6.0 by JustUncleLDescription:
This is the Backtest version of the " QQE Cross v6.0 by JustUncleL" Tool, can be used to optimize settings.
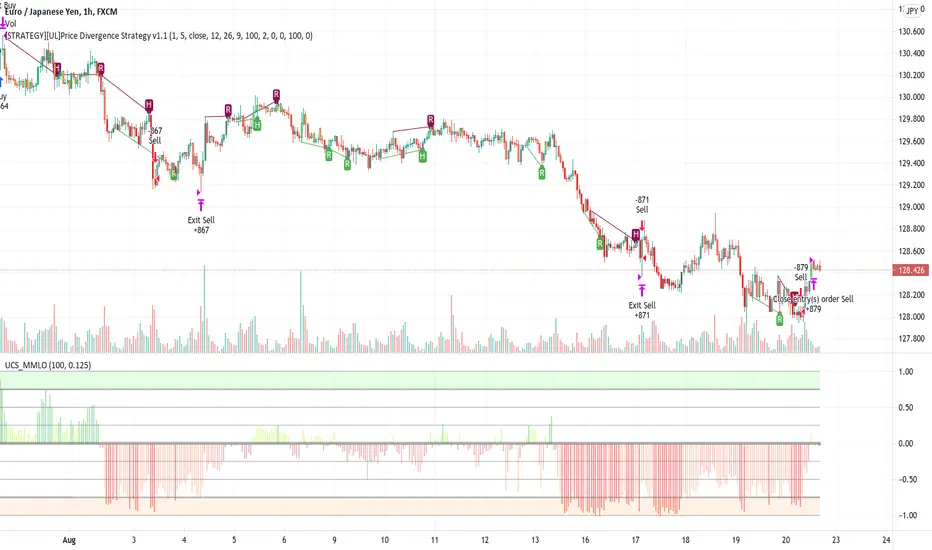
[STRATEGY][UL]Price Divergence Strategy v1.0Created by Request: This is a trend trading strategy that uses Price Divergence detection signals that are confirmed by the "Murrey's Math Oscillator" (Donchanin Channel based).
Strategy Code Based on:
Price Divergence Detector V2 by RicardoSantos
UCS_Murrey's Math Oscillator by Ucsgears
Strategy Risk Management Based on:
Strategy Code Example by JayRogers
Information on Divergence Trading:
- www.babypips.com
*** USE AT YOUR OWN RISK ***
[STRATEGY][UL]QQE Cross v1.1Updated by request: this is a "Strategy" trading version of the "QQE Cross Indicator Alert v2.0 by JustUncleL" (which is mainly for Binary Options trading), the same BUY/SELL signals are used to generate trade entry and exit conditions. Thanks again to JayRogers for making the Strategy risk management easier to understand and implement.
In this update I have added "Take Profit" option and cleaned up the risk management code. Also changed the close BUY/SELL order if EMA20 direction changes rather the next BUY/SELL opposite signal, making the close earlier.
BE ADVISED TO USE AT YOUR OWN RISK, even though back testing has shown good results, I don't have any Forex trading account to forward test against. You need to perform these test yourself and get back to me if there is any issues.
