Trend Trading with Currency Strength MeterThis is a trend trading strategy designed mainly for forex made of two big components:
First we have the currency meter, which is made of taking TSI of different INDEXes such as EUR, USD, GBP, JPY, NZD, AUD , CHF and CAD.
Once we establish which one is the weakest and most powerful, we pair them together and we go on that chart.
Lastly we check with the EMA 200 to confirm our direction.
We can see in this example for the USDJPY chart, that USD is the strongest, JPY is the weakest and ema confirm our bullish trend.
For timeframe in general I recommend big timeframes, 1-4h+ , and as a mentality a swing trading mentality, we can stay in trade for days/weeks.
For exit in general I recommend to exit when either one of the pairs losses/gain power or when the EMA is crossing with current candle
If you have any questions, let me know !
True Strength Index (TSI)

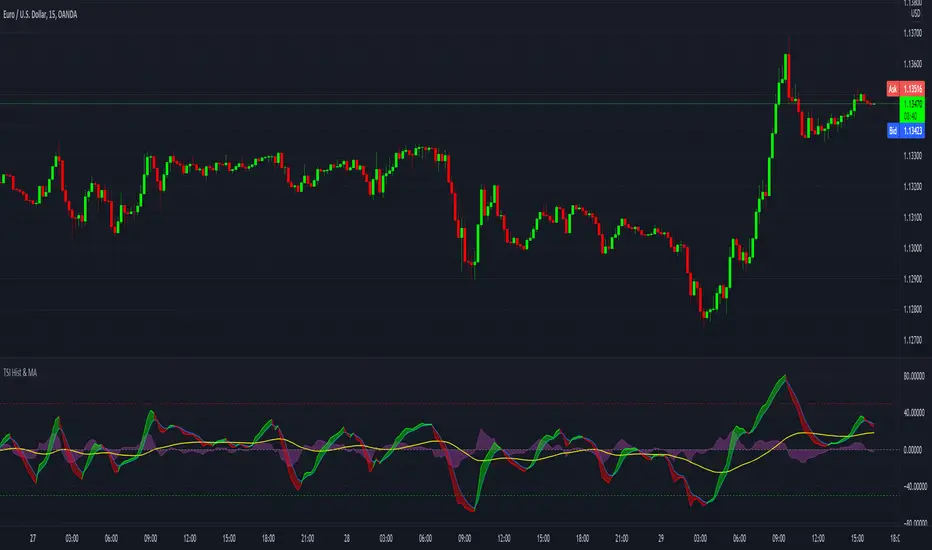
TSI with histogram and MA - SamXThis is an enhanced TSI. The others I've found on here have generally lacked sufficient settings context and/or alert definitions, so I made this version to address those gaps. In addition to that, I also added a way to plot a user-customizable moving average line of the TSI to better help identify trending conditions across TSI swings.
Multiple Indicators ScreenerA screener for multiple indicators with nice table output.
I was asked many times to update custom screener to display results in a table form. This way it looks much better.
You can play with background colors depend on values you're looking for.
In the screener, for example, I'm highlighting overbought/oversold RSI values, big ADX levels and trend of the Supertrend.
In parameters you can change settings for all indicators and change/disable tickers if 40 is too many for you.
There is only 1 function that calculates all these indicators. Potentially you can change and even add more indicators to this function.
Writing code for these kind of screener is a bit time consuming, so I even created a code generator in Python for these kind of indicators :) .
Disclaimer
Please remember that past performance may not be indicative of future results.
Due to various factors, including changing market conditions, the strategy may no longer perform as well as in historical backtesting.
This post and the script don’t provide any financial advice.

Market Strength ScannerHey traders, this is a table-based market relative strength and true strength scanner, designed to allow the users to get data from multiple pairs without having to go onto that pair for their strength's. This indicator uses functions to fetch data from other pairs so that the code is optimised and prevents slow loading. Furthermore, the indicator is easy to understand and use as there isn't a lot of settings for it, you can adjust the length of the true strength index or the relative strength index through one input box, you can change the data type from RSI to TSI without changing the code, and you can customise what pairs you want to display. Furthermore, the user can set alerts for the pairs that they want to have such as setting alerts for overbought and oversold zones. That's all to this indicator and I hope it is of use to some people :)

Bjorgum SuperScript
Bjorgum Reversal
Bj Reversal uses Tilson moving averages to identify trend changes
Bars change to yellow as bar close crosses the Tilson moving averages. Blue or red is confirmed as the two Tilson averages themselves cross.
Reversal is great for pinpointing trend change often giving the absolute best entry or exit
Its sensitive nature can mean more false signals on some assets
Be sure to use other indicators from the Bjorgum Collection to confirm signals, or use another strategy that fits the asset or time frame being viewed
Bjorgum HEMA Strategy
Hema uses HA smoothed EMAs to identify trend direction
Default EMA lengths are 5,9, and 21 period
Bar Color will change Malibu or Ruby on a cross of BOTH 5 and 9 EMA
The lengths are customizable to whatever lengths the user desires
Rolando Santos True Relative Movement (TRM)
This underrated momentum strategy conceptualized by Rolando Santos uses 2 indicators to give a 3 color scheme
A leading indicator (RSI) is combined with a lagging indicator (TSI) to produce bar colors based on the condition of each indicator
Both indicators in positive territory produce blue bars
Both indicators in negative bias produce yellow bars
If signals are mixed (one up one down) bars become grey
Speed Selection
The Bjorgum speed selector optimizes the strategy based on the users desires or trading style at the touch of a button
Fast setting is better for swing trades - more timely signals, more whipsaw
Slow setting is better for longer holds or more volatile assets - slower signals, smooths out whipsaw
RSI Bar Color
RSI color changes bar color based on user defined RSI values
Buy/ sell signals are typically given on a cross of the 50 level
Speed selector (fast/Slow) automatically changes lengths between Bj RSI (5 period) and a standard RSI (14 period)
Additional capabilities can be mixed and matched from strategies in the "Strategy Override" section
Add-ons include:
Tilson - The moving average system from Bjorgum Reversal can be toggled to couple with another bar color strategy by clicking this button
PSAR - Parabolic Stop and Reverse indicator can help with trend direction, volatility, and stop losses
HEMA - The 3 moving average system from the HEMA strategy can be coupled with any of the other strategies by clicking "Show HEMA"
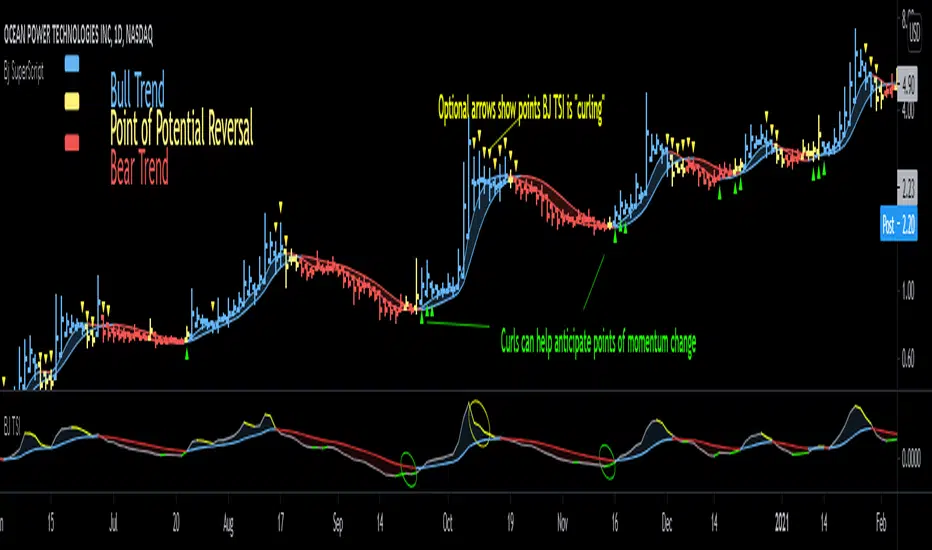
Bj Arrows - These arrows plot at the bar level to draw attention to when the BJ TSI is "curling" (See profile for Bjorgum TSI and download today)
-Optional "Plotbar Overlay" plots bars with Heikin-Ashi Inputs when toggled
-This allows for the benefits of price smoothing without sacrificing moving average and indicator performance as real close value is still used
-This can also help on short time frames and improve results with crypto! The user must "mute" the main series candles when in use to avoid candle overlap.
-Optional price line as muting main bars will disable the TradingView default price line. The horizontal plot will track the real closing price while in HA mode!
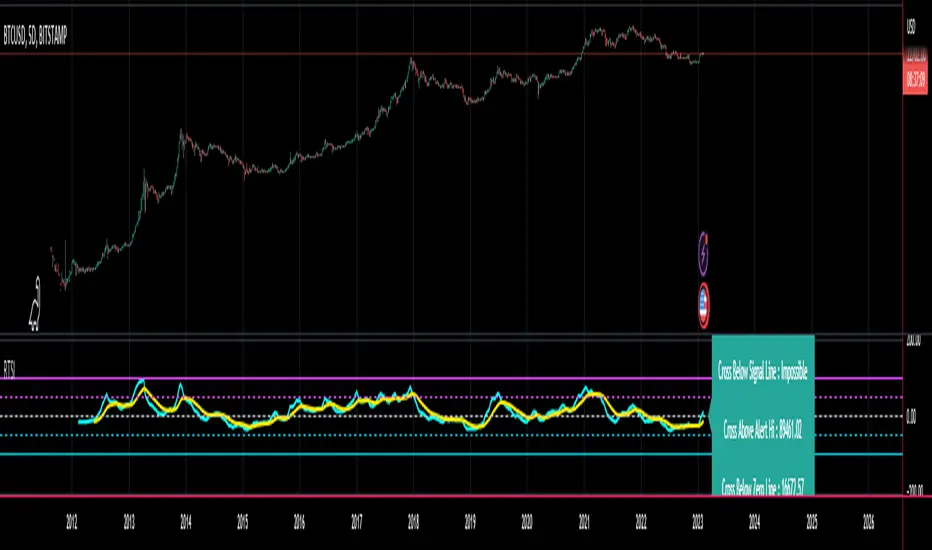
CT Reverse True Strength Indicator On ChartIntroducing the Caretakers “On Chart” Reverse True Strength Index.
According to Wikipedia….
“The True Strength Index (TSI) is a technical indicator used in the analysis of financial markets that attempts to show both trend direction and overbought/oversold conditions. It was first published William Blau in 1991.
The indicator uses moving averages of the underlying momentum of a financial instrument.
Momentum is considered a leading indicator of price movements, and a moving average characteristically lags behind price.
The TSI combines these characteristics to create an indication of price and direction more in sync with market turns than either momentum or moving average.”
The TSI has a normal range of values between +100 and -100.
Traditionally traders and analysts will consider:
Positives values above 25 to indicate an “overbought” condition
Negative values below -25 to indicate an “oversold” condition
I have reverse engineered the True Strength Index formula to derive 2 new functions.
1) The reverse TSI function is dual purpose which can be used to calculate….
The chart price at which the TSI will reach a particular TSI scale value.
The chart price at which the TSI will equal its previous value.
2) The reverse TSI signal cross function can be used to calculate the chart price at which the TSI will cross its signal line.
I have employed these functions here to return the price levels where the True Strength Index would equal :
Upper alert level ( default 25 )
Zero-Line
Lower alert level ( default -25 )
Previous TSI (eq) value
TSI signal line
In this “On Chart” version of the reverse True Strength Index the crossover levels are displayed both as lines on the chart and via an optional info-box with choice of user selected info.
Chart Line Colors
Upper alert level... ( Fuchsia )
Zero-Line............ ( White )
Lower alert level... ( Aqua )
TSI (eq)...............( TSI (eq) > close..Orange, TSI (eq) < close..Lime )
TSI signal line........( Signal Cross Line > Close..Aqua, Signal Cross Line < Close..Fuchsia )
How to interpret the displayed prices returned from the TSI scale zero line and upper and lower alert levels.
Closing exactly at the given price will cause the True Strength Index value to equal the scale value.
Closing above the given price will cause the True Strength Index to cross above the scale value.
Closing below the given price will cause the True Strength Index to cross below the scale value.
How to interpret the displayed price returned from the TSI (eq)
Closing exactly at the price will cause the True Strength Index value to equal the previous TSI value.
Closing above the price will cause the True Strength Index value to increase.
Closing below the price will cause the True Strength Index value to decrease.
How to interpret the displayed price returned from the TSI signal line crossover.
Closing exactly at the given price will cause the True Strength Index value to equal the signal line.
Closing above the given price will cause the True Strength Index to cross above the signal line.
Closing below the given price will cause the True Strength Index to cross below the signal line.
Common methods to derive signals from the TSI :
Zero-line crossovers
When the CMO crosses above the zero-line, a buy signal is generated.
When the CMO crosses below the zero-line, a sell signal is generated.
“Overbought” and “Oversold” crossovers
When the SMI crosses below -25 and then moves back above it, a buy signal is generated.
When the SMI crosses above +25 and then moves back below it, a sell signal is generated.
What Does the True Strength Index (TSI) Tell You?
The indicator is primarily used to identify overbought and oversold conditions in an asset's price, spot divergence, identify trend direction and changes via the zero-line, and highlight short-term price momentum with signal line crossovers.
Since the TSI is based on price movements, oversold and overbought levels will vary by the asset being traded. Some stocks may reach +30 and -30 before tending to see price reversals, while another stock may reverse near +20 and -20.
Mark extreme TSI levels, on the asset being traded, to see where overbought and oversold is. Being oversold doesn't necessarily mean it is time to buy, and when an asset is overbought it doesn't necessarily mean it is time to sell. Traders will typically watch for other signals to trigger a trade decision. For example, they may wait for the price or TSI to start dropping before selling in overbought territory. Alternatively, they may wait for a signal line crossover.
Signal Line Crossovers
The true strength index has a signal line, which is usually a seven- to 13-period EMA of the TSI line. A signal line crossover occurs when the TSI line crosses the signal line. When the TSI crosses above the signal line from below, that may warrant a long position. When the TSI crosses below the signal line from above, that may warrant selling or short selling.
Signal line crossovers occur frequently, so should be utilized only in conjunction with other signals from the TSI. For example, buy signals may be favoured when the TSI is above the zero-line. Or sell signals may be favoured when the TSI is in overbought territory.
Zero-line Crossovers
The zero-line crossover is another signal the TSI generates. Price momentum is positive when the indicator is above zero and negative when it is below zero. Some traders use the zero-line for a directional bias. For example, a trader may decide only to enter a long position if the indicator is above its zero-line. Conversely, the trader would be bearish and only consider short positions if the indicator's value is below zero.
Breakouts and Divergence
Traders can use support and resistance levels created by the true strength index to identify breakouts and price momentum shifts. For instance, if the indicator breaks below a trendline, the price may see continued selling.
Divergence is another tool the TSI provides. If the price of an asset is moving higher, while the TSI is dropping, that is called bearish divergence and could result in a downside price move. If the TSI is rising while the price is falling, that could signal higher prices to come. This is called bullish divergence.
Divergence is a poor timing signal, so it should only be used in conjunction with other signals generated by the TSI or other technical indicators.
The Difference Between the True Strength Index (TSI) and the Moving Average Convergence Divergence (MACD) Indicator.
The TSI is smoothing price changes to create a technical oscillator. The moving average convergence divergence (MACD) indicator is measuring the separation between two moving averages. Both indicators are used in similar ways for trading purposes, yet they are not calculated the same and will provide different signals at different times.
The Limitations of Using the True Strength Index (TSI)
Many of the signals provided by the TSI will be false signals. That means the price action will be different than expected following a trade signal. For example, during an uptrend, the TSI may cross below the zero-line several times, but then the price proceeds higher even though the TSI indicates momentum has shifted down.
Signal line crossovers also occur so frequently that they may not provide a lot of trading benefit. Such signals need to be heavily filtered based on other elements of the indicator or through other forms of analysis. The TSI will also sometimes change direction without price changing direction, resulting in trade signals that look good on the TSI but continue to lose money based on price.
Divergence also tends to unreliable on the indicator. Divergence can last so long that it provides little insight into when a reversal will actually occur. Also, divergence isn't always present when price reversals actually do occur.
The TSI should only be used in conjunction with other forms of analysis, such as price action analysis and other technical indicators.
This is not financial advice, use at your own risk.
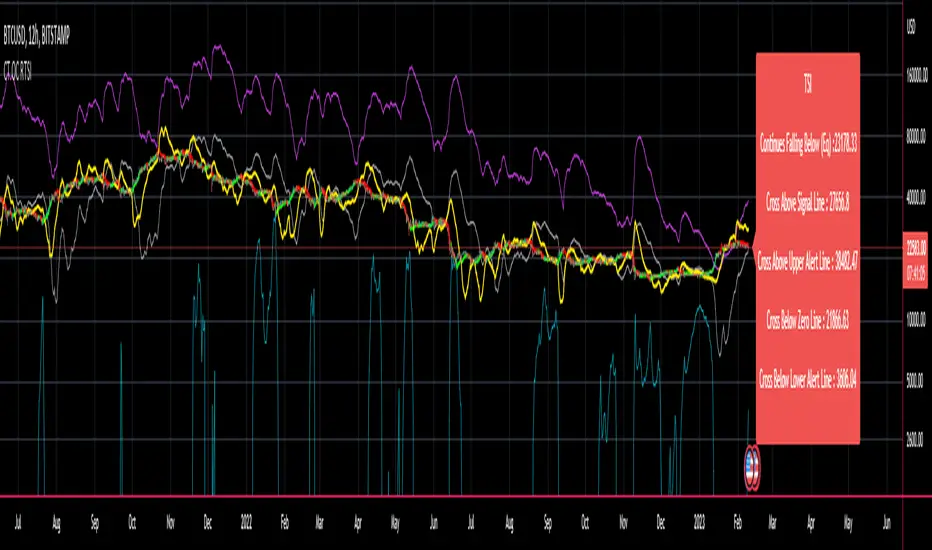
CT Reverse True Strength IndicatorIntroducing the Caretakers Reverse True Strength Index.
According to Wikipedia….
“The True Strength Index (TSI) is a technical indicator used in the analysis of financial markets that attempts to show both trend direction and overbought/oversold conditions. It was first published William Blau in 1991.
The indicator uses moving averages of the underlying momentum of a financial instrument.
Momentum is considered a leading indicator of price movements, and a moving average characteristically lags behind price.
The TSI combines these characteristics to create an indication of price and direction more in sync with market turns than either momentum or moving average.”
The TSI has a normal range of values between +100 and -100.
Traditionally traders and analysts will consider:
Positives values above 25 to indicate an “overbought” condition
Negative values below -25 to indicate an “oversold” condition
I have reverse engineered the True Strength Index formula to derive 2 new functions.
The reverse TSI function is dual purpose which can be used to calculate….
The chart price at which the TSI will reach a particular TSI scale value.
The chart price at which the TSI will equal its previous value.
The reverse TSI signal cross function can be used to calculate the chart price at which the TSI will cross its signal line.
I have employed these functions here to return the price levels where the True Strength Index would equal :
Upper alert level ( default 25 )
Zero-Line
Lower alert level ( default -25 )
Previous TSI (eq) value.
TSI signal line
These crossover levels are displayed via an optional info-box with choice of user selected info.
How to interpret the displayed prices returned from the TSI scale zero line and upper and lower alert levels.
Closing exactly at the given price will cause the True Strength Index value to equal the scale value.
Closing above the given price will cause the True Strength Index to cross above the scale value.
Closing below the given price will cause the True Strength Index to cross below the scale value.
How to interpret the displayed price returned from the TSI (eq)
Closing exactly at the price will cause the True Strength Index value to equal the previous TSI value.
Closing above the price will cause the True Strength Index value to increase.
Closing below the price will cause the True Strength Index value to decrease.
How to interpret the displayed price returned from the TSI signal line crossover.
Closing exactly at the given price will cause the True Strength Index value to equal the signal line.
Closing above the given price will cause the True Strength Index to cross above the signal line.
Closing below the given price will cause the True Strength Index to cross below the signal line.
Common methods to derive signals from the TSI :
Zero-line crossovers
When the CMO crosses above the zero-line, a buy signal is generated.
When the CMO crosses below the zero-line, a sell signal is generated.
“Overbought” and “Oversold” crossover
When the SMI crosses below -25 and then moves back above it, a buy signal is generated.
When the SMI crosses above +25 and then moves back below it, a sell signal is generated.
What Does the True Strength Index (TSI) Tell You?
The indicator is primarily used to identify overbought and oversold conditions in an asset's price, spot divergence, identify trend direction and changes via the zero-line, and highlight short-term price momentum with signal line crossovers.
Since the TSI is based on price movements, oversold and overbought levels will vary by the asset being traded. Some stocks may reach +30 and -30 before tending to see price reversals, while another stock may reverse near +20 and -20.
Mark extreme TSI levels, on the asset being traded, to see where overbought and oversold is. Being oversold doesn't necessarily mean it is time to buy, and when an asset is overbought it doesn't necessarily mean it is time to sell. Traders will typically watch for other signals to trigger a trade decision. For example, they may wait for the price or TSI to start dropping before selling in overbought territory. Alternatively, they may wait for a signal line crossover.
Signal Line Crossovers
The true strength index has a signal line, which is usually a seven- to 13-period EMA of the TSI line. A signal line crossover occurs when the TSI line crosses the signal line. When the TSI crosses above the signal line from below, that may warrant a long position. When the TSI crosses below the signal line from above, that may warrant selling or short selling.
Signal line crossovers occur frequently, so should be utilized only in conjunction with other signals from the TSI. For example, buy signals may be favoured when the TSI is above the zero-line. Or sell signals may be favoured when the TSI is in overbought territory.
Zero-line Crossovers
The zero-line crossover is another signal the TSI generates. Price momentum is positive when the indicator is above zero and negative when it is below zero. Some traders use the zero-line for a directional bias. For example, a trader may decide only to enter a long position if the indicator is above its zero-line. Conversely, the trader would be bearish and only consider short positions if the indicator's value is below zero.
Breakouts and Divergence
Traders can use support and resistance levels created by the true strength index to identify breakouts and price momentum shifts. For instance, if the indicator breaks below a trendline, the price may see continued selling.
Divergence is another tool the TSI provides. If the price of an asset is moving higher, while the TSI is dropping, that is called bearish divergence and could result in a downside price move. If the TSI is rising while the price is falling, that could signal higher prices to come. This is called bullish divergence.
Divergence is a poor timing signal, so it should only be used in conjunction with other signals generated by the TSI or other technical indicators.
The Difference Between the True Strength Index (TSI) and the Moving Average Convergence Divergence (MACD) Indicator.
The TSI is smoothing price changes to create a technical oscillator. The moving average convergence divergence (MACD) indicator is measuring the separation between two moving averages. Both indicators are used in similar ways for trading purposes, yet they are not calculated the same and will provide different signals at different times.
The Limitations of Using the True Strength Index (TSI)
Many of the signals provided by the TSI will be false signals. That means the price action will be different than expected following a trade signal. For example, during an uptrend, the TSI may cross below the zero-line several times, but then the price proceeds higher even though the TSI indicates momentum has shifted down.
Signal line crossovers also occur so frequently that they may not provide a lot of trading benefit. Such signals need to be heavily filtered based on other elements of the indicator or through other forms of analysis. The TSI will also sometimes change direction without price changing direction, resulting in trade signals that look good on the TSI but continue to lose money based on price.
Divergence also tends to unreliable on the indicator. Divergence can last so long that it provides little insight into when a reversal will actually occur. Also, divergence isn't always present when price reversals actually do occur.
The TSI should only be used in conjunction with other forms of analysis, such as price action analysis and other technical indicators.
This is not financial advice, use at your own risk.

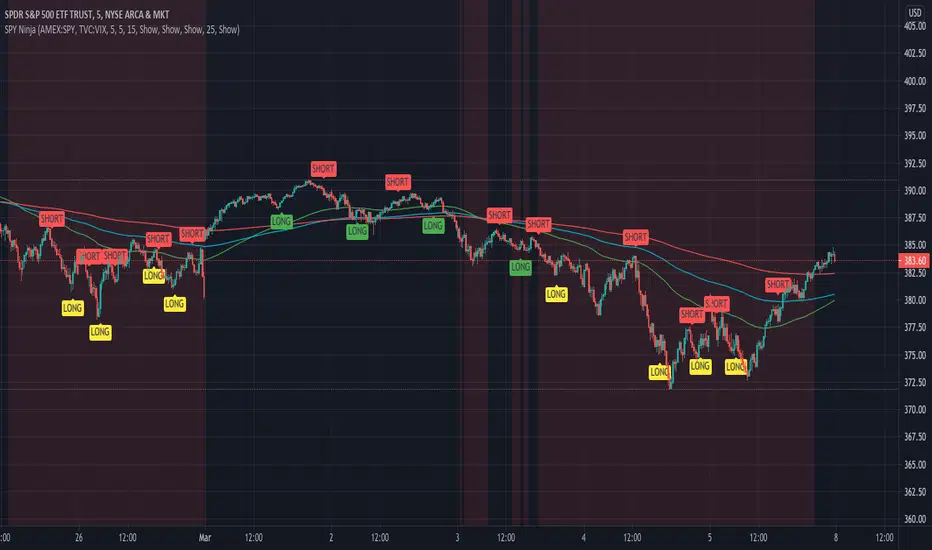
SPY Ninja
SPY Ninja correlates the true strength index exponential moving averages of SPY and VIX together. In doing so we can determine the start of trend shifts via SPY / VIX convergence in addition to crossover, with potential market entries and exits represented by the LONG and SELL signals.
SMMA 50,100, and 200 have been added to chart due to the historic SPY market reactivity to these moving averages. They often act as natural support and resistance levels with SPY, and when coinciding LONG and SHORT signals appear touching any of these levels, it adds an extra layer of confidence for traders' decisions. Also, by highlighting the areas on our SPY chart (red background areas) that represent a VIX threshold higher than 25, we can bring attention to areas with potentially higher volatility immediately so that traders know to proceed with caution.
SPY Ninja works harmoniously with the SPY Ninja Oscillator; Ninja provides the signals highlighting risky VIX areas of concern, while the Ninja Oscillator adds an additional 3 levels of potential confirmation for your trade decisions.
SPY Ninja Oscillator
SPY Ninja Oscillator correlates the true strength index exponential moving averages of SPY (green) and VIX (red) together. In doing so we can determine the start of trend shifts via SPY / VIX convergence in addition to crossover, with potential market entries and exits represented by the vertical green and red bars.
MACD and RSI have been scaled proportionally to the oscillator range ( for rsi: (rsi-50)*. 01 , and for macd: macd /3) and when overlaid and used in conjunction with the market vertical entry and exit signals, potential trend prediction becomes much more apparent.

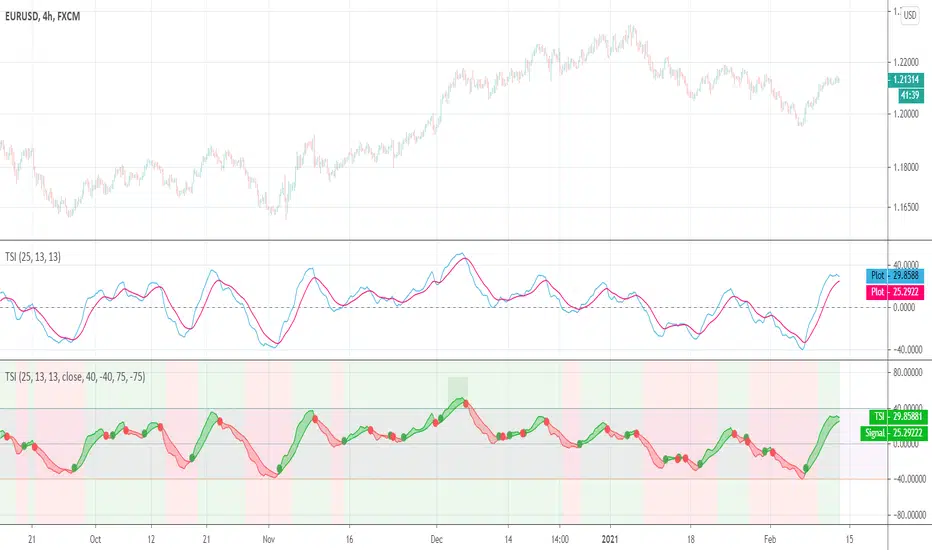
True Strength Index (TSI)User request. A tuned version of the built-in True Strength Index (TSI) indicator with the following options included:
TSI - Signal Histogram
TSI/Signal Crossovers
TSI/Signal Ribbon
Bands breakouts highlighting
Zero line crossovers background
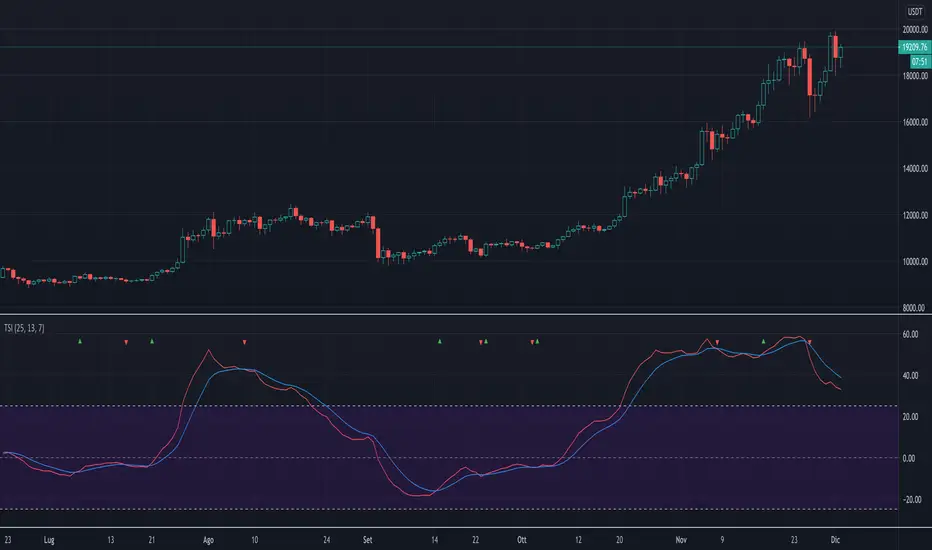
True Strength IndexThe script implements a custom version of TSI (True Strength Index). This index may be useful for determining overbought and oversold conditions, indicating potential trend direction changes via centerline or signal line crossovers, and warning of trend weakness through divergence.
The script highlights when TSI line crosses the signal line with a colored triangle, that is
when the TSI line crosses above the signal line from below, that may warrant buying, a green triangle that's pointing up is drawned;
when the TSI line crosses below the signal line from above, that may warrant selling, a red triangle that's pointing down is drawned.
Note: Signal line crossovers occur frequently, so should be utilized only in conjunction with other signals from the TSI.
The script is very easy to use and it is possible to change the following parameters:
EMA smoothing period for momentum (default value is 25)
EMA smoothing period for smoothed momentum (default value is 13)
Signal line period (default value is 7)
The type of signal line: EMA or SMA (default value is EMA)
Show or not the TSI line
Show or not the signal line
Bjorgum RSIRSI output signals are displayed with color change to reflect the plotted value. This makes evaluating RSI conditions require but a glance.
RSI momentum buy signals are given on the cross of the 50 level, whereas sell signals are given on a fall below.
Default values a 5 period RSI which gives more timely entrances and exits for swing traders. This can be adjusted to the typical 14 period if the viewer desires slower signals.
Bullish and bearish area is shaded to accentuate the signal to the eye.
Excellent results can be found when coupling BJ RSI, with BJ TSI, and the reversal system using all 3 as a complete together simultaneously
Default color changes are plotted as a recorded value falls within the following levels:
RSI < 30 = green
RSI 30-50 = red
RSI 50-70 = blue
RSI 70-80 = yellow
RSI 80-90 = orange
RSI 90-100 = white hot

Bjorgum TSI-This script utilizes simple color changes of the TSI output signals to aid in interpretation of the classic TSI indicator.
-Crosses of the TSI value line and signal line are a bullish or bearish indication. TSI value line is colored green or yellow to help identify that the TSI value line is either dropping or rising, while over or under the signal line.
-This can help anticipate a cross, or significant points in the trend. TSI signal line changes color when rising or falling which can help to identify larger prevailing trends.
-Generally, a rising signal line can be an overall bullish move, while falling more bearish regardless of crosses.
*Resolution function enables multiple overlay for "Multi-timeframe analysis"*
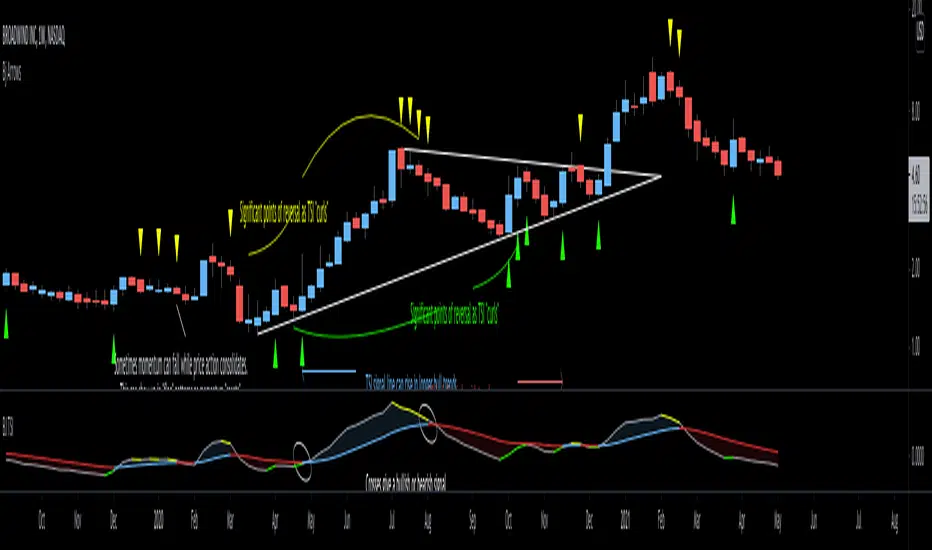
Bjorgum TSI Arrows
This script is intended to help the viewer identify potential turning points with momentum "headwinds" or "tailwinds" with a visual que at the bar level. The presence of arrows indicates that the TSI indicator is either "curling" up under the signal line, or "curling" down over the signal line. This can help to anticipate reversals, or moves in favor of trend direction.
Multiple script overlays can be used for "Multi-timeframe analysis" by altering the "resolution" feature.
eg: Viewer could enable 2 "Arrow" scripts while watching the daily timeframe, and setting one of them to indicate weekly conditions. This can help identify prevailing trend strength when using smaller timeframes.

TKP T3 Trend With Psar BarcolorThis script is adapted from TKP's long/short indicator to initiate buy/sell indications when price crosses the T3 moving averages, and when the T3's themselves cross. Bars change colors based on price over/under T3 and T3 up or down or This allows for simple visual analysis of trend direction along with entries, exits, and stop loss values.

TSI CCI Hull with profit$$$$ , Alert versionThis is a modified version of @SeaSide420 TSI CCI Hull with profits exit on long and short order with alert as well
original script :
the strategy script:
/// feel free to edit/improve and comment

TKP-True Relative MovementThis script uses a combination of modified TSI and RSI conditions produce Buy/Sell/Hold signals. Similar to Elder's Impulse, when a buy signal is met, bars turn blue. When a sell signal is met, bars turn Pink. When signals are mixed, bars turn grey. Depending on direction of trend, gray bars can be considered "Hold" or take profit signals. You can change the parameters of TSI or RSI to preference. Also embedded in the script is the ability to add exponential moving average filter for additional conditions if you have some know how with coding.

GMS: TSI Indicator (ROC)This is based on the original TSI Indicator that's already built in.
The PC is originally taken as the change between the current price - the previous price. I substituted that with Rate of Change. Using a 1 period ROC it's quite similar to the TSI Indicator and increasing the length results in a smoother TSI.
I hope it helps,
Andre
Mirror TSI-MACD by Trader JayI was playing around with the TSI-MACD and surprisingly it works quite well as a mirror.
There are 2 ways this can be used
1. Enter long when Blue line crosses up the Red
2. Exit long when Green line crosses the blue
or
1. Enter long when Blue line crosses up the Red
2. Exit long when Blue line crosses back down below the Red

TSI CCI HullThis is TSI and CCI combined. The CCI is customized and is using HullMA, but the TSI is default TSI
For use with the HMAv420 indicator, to form trading strategy based on the 3 indicators.
Best as all 3 indicators used on 3 timeframes at once, ie 1m 5m 1H

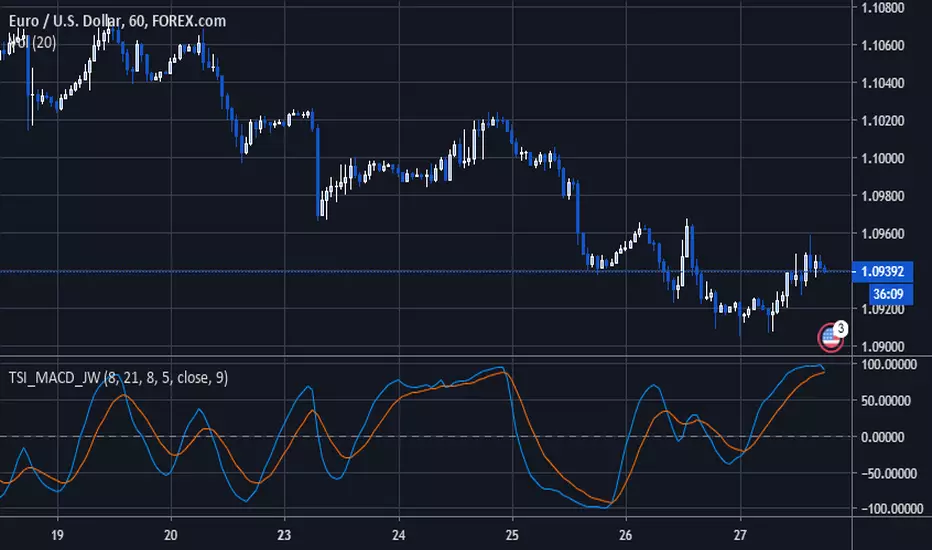
TSI MACD by Jwammo12The TSI MACD indicator is a combination of the TSI (True Strength Index) and MACD (Moving Average Convergence Divergence) technical indicators.
The TSI MACD indicator is a momentum indicator, considering that it comes from two momentum indicators.
Ultimately, the TSI MACD indicator is used to gauge the strength of a trend, as well as its accompanying momentum.
The indicator is shown to oscillate between -110 and +110, while its signal baseline is on the zero level (a level that determines the market bias).