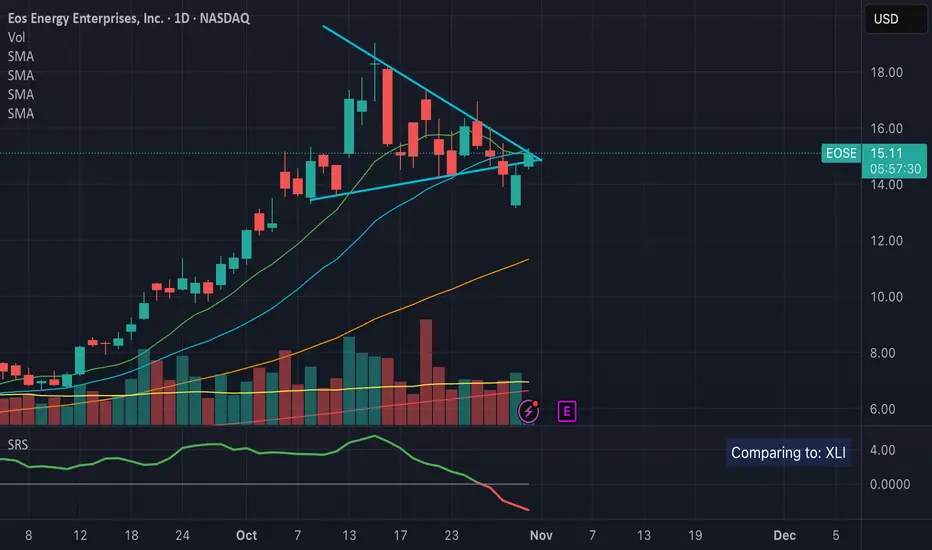
Sector Relative StrengthThis indicator measures a stock's Real Relative Strength against its sector benchmark, helping you identify stocks that are outperforming or underperforming their sector peers.
The concept is based on the Real Relative Strength methodology popularized by the r/realdaytrading community.
Unlike traditional relative strength calculations that simply compare price ratios, this indicator uses a more sophisticated approach that accounts for volatility through ATR (Average True Range), providing a normalized view of true relative performance.
Key Features
Automatic Sector Detection
Automatically detects your stock's sector using TradingView's built-in sector classification
Maps to the appropriate SPDR Sector ETF (XLK, XLF, XLV, XLY, XLP, XLI, XLE, XLU, XLB, XLC)
Supports all 20 TradingView sectors
Sector ETF Mappings
The indicator automatically compares your stock against:
Technology: XLK (Technology Services, Electronic Technology)
Financials: XLF (Finance sector)
Healthcare: XLV (Health Technology, Health Services)
Consumer Discretionary: XLY (Retail Trade, Consumer Services, Consumer Durables)
Consumer Staples: XLP (Consumer Non-Durables)
Industrials: XLI (Producer Manufacturing, Industrial Services, Transportation, Commercial Services)
Energy: XLE (Energy Minerals)
Utilities: XLU
Materials: XLB (Non-Energy Minerals, Process Industries)
Communications: XLC
Default: SPY (for Miscellaneous or unclassified sectors)
Customizable Settings
Comparison Mode: Choose between automatic sector comparison or custom symbol
Length: Adjustable lookback period (default: 12)
Smoothing: Apply moving average to reduce noise (default: 3)
Visual Clarity
Green line: Stock is outperforming its sector
Red line: Stock is underperforming its sector
Zero baseline: Clear reference point for performance
Clean info box: Shows which ETF you're comparing against
How It Works
The indicator calculates relative strength using the following methodology:
Rolling Price Change: Measures the price movement over the specified length for both the stock and its sector ETF
ATR Normalization: Uses Average True Range to normalize for volatility differences
Power Index: Calculates the sector's strength relative to its volatility
Real Relative Strength: Compares the stock's performance against the sector's power index
Smoothing: Applies a moving average to reduce single-candle spikes
Formula:
Power Index = (Sector Price Change) / (Sector ATR)
RRS = (Stock Price Change - Power Index × Stock ATR) / Stock ATR
Smoothed RRS = SMA(RRS, Smoothing Length)
Volatility


Volatility Cones **Volatility Cones - Interactive**
This indicator visualizes volatility cones based on historical or manual volatility and projects them up to 252 trading days into the future.
**Features:**
- Automatic start at the first trading day of the year (customizable)
- Volatility calculation from historical data or manual input
- Display of ±1σ, ±2σ, and ±3σ bands
- Projection of expected price movements based on volatility
**Use Case:**
Ideal for options traders and risk management to assess expected price movements over different time horizons.

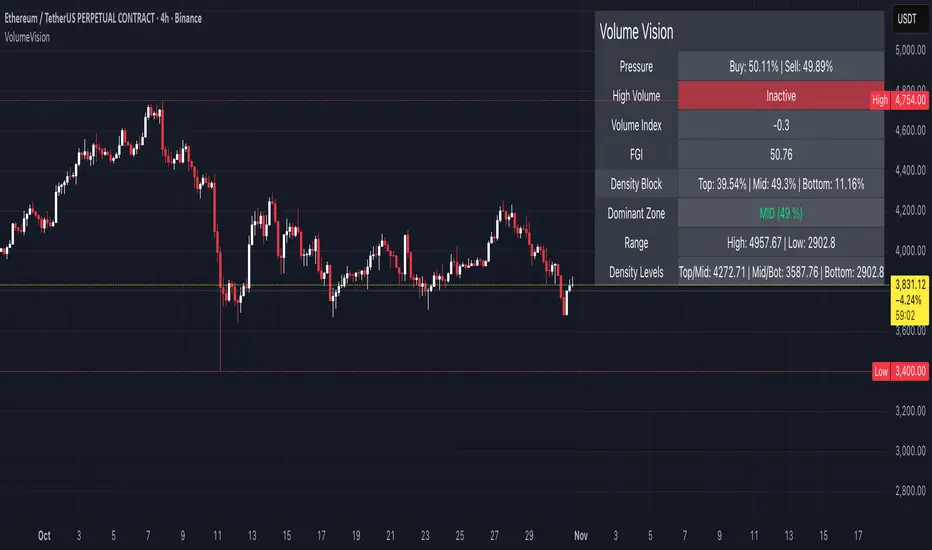
Volume VisionVolume Vision is a precision volume-analysis system that exposes how trading activity is distributed inside the current market range.
It divides the active price structure into three live zones — Top, Middle, and Bottom — and measures where real participation is concentrated.
This creates a dynamic “volume map” that allows you to instantly see whether the market is being driven by accumulation, distribution, or equilibrium.
At the heart of the indicator is a fully original implementation of the FGI — a proprietary composite metric designed to read market emotion and internal pressure.
It transforms several hidden components — volume, volatility, dominance, and directional momentum — into one unified curve of sentiment.
FGI values around 30 typically reflect phases of fear, capitulation, and potential accumulation.
Values near 80 mark conditions of greed, overextension, and possible distribution.
Observing these boundaries helps detect when the market is preparing to shift from compression to expansion or from euphoria to cooling.
Core Functions
Density Zones: Splits recent price movement into Top / Mid / Bottom areas, quantifying volume within each.
Dominant Zone: Highlights where the major share of liquidity currently resides.
Pressure Meter: Shows the balance between buy and sell volume in real time.
Volume Index: Normalizes present volume activity against its historical range to spot abnormal behaviour.
FGI Reading: Custom sentiment curve ranging from fear (≈ 30) to greed (≈ 80).
Alerts: Optional signals for High Volume and Rising Volume moments.
Dashboard: Compact on-chart table that summarizes all key readings without cluttering the view.
Interpretation Guide
When FGI drops near 30, the market often forms accumulation bases or bottom structures.
When FGI climbs toward 80, momentum usually reaches its limit and profit-taking or distribution begins.
A dominant Top zone with strong sell pressure indicates distribution, while Bottom dominance with buy pressure suggests accumulation.
Mid-zone dominance with neutral FGI reflects balance — a state of indecision before the next move.
Watch for volume spikes accompanied by FGI shifts: these often precede major impulse starts or ends.
Style: non-repainting core, minimal visuals, real-time clarity.
Created for traders who need to see where the energy is flowing, not just what price is printing.
by MahaTrend
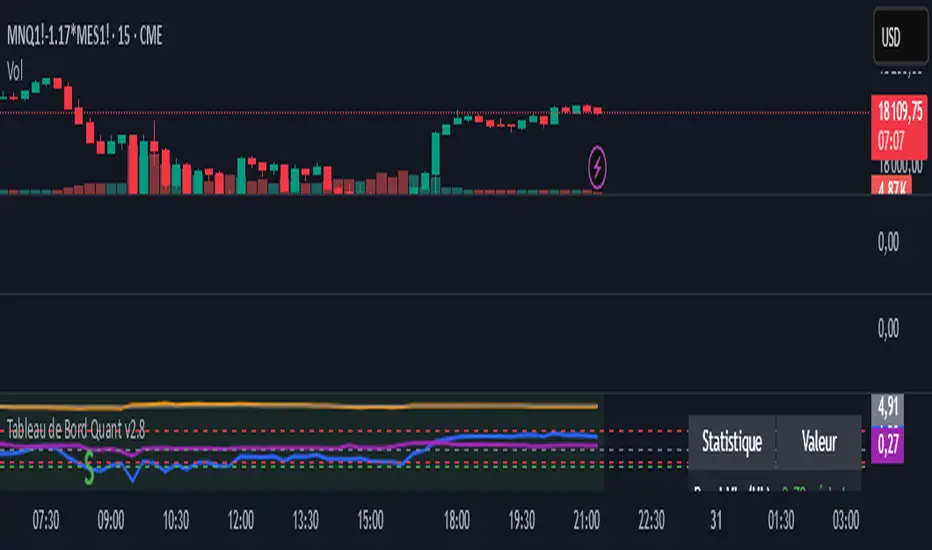
Zscore correlation volatility Demi vie IlkerThis is an all-in-one "regime" dashboard for pairs trading. It's designed to stop you from taking bad mean-reversion trades by first identifying if the market conditions are stable.
It answers two key questions:
1. "Is this a good time to trade a mean-reversion strategy?" (The Regime Filter)
2. "If yes, how fast should I expect the trade to work?" (The Half-Life)
## 📈 Key Features
This script runs four main calculations at once:
1. The Price Z-Score (Blue Line)
This is your primary entry signal. It shows you how "cheap" (e.g., -2.0) or "expensive" (e.g., +2.0) the spread is relative to its short-term history (z_len).
2. The Regime Background (Green / Red)
This is the most important part. It acts as a "traffic light" for your trading:
• 🟢 GREEN (Stable Regime): It's safe to look for mean-reversion trades. This means both the correlation and volatility filters are stable.
• 🔴 RED (Unstable Regime): DO NOT trade mean-reversion. The relationship between the assets is broken. Any signal is likely a trap.
3. The Regime Filters (Your "Guards")
These two filters determine the background color:
• Correlation Z-Score (Purple Line): It measures the stability of the correlation. If this purple line drops below the red threshold (corr_z_threshold), it means the correlation has broken down, and the background turns RED.
• Volatility Ratio (Orange Line): It compares the volatility of the two assets. If one asset suddenly becomes much more volatile than the other (deviating from its average ratio), the background turns RED.
4. The Half-Life Dashboard (Top-Right Table)
This is your "speedometer." Based on an Ornstein-Uhlenbeck model, it calculates the average time (in bars) it takes for the spread to revert 50% of the way back to its mean.
• HL: 13.86 periods: You can expect it to take ~14 bars to go from a Z-Score of 2.0 to 1.0.
• N/A (Divergent): A critical warning. The math shows the spread is currently diverging and has no tendency to revert.
## 💡 How to Use This Indicator
Setup (Required):
1. Load a spread chart (e.g., type MES/MNQ or MGC/SIL into the TradingView search).
2. Add this indicator to the spread chart.
3. Go into the indicator's Settings (⚙).
4. In the "Inputs" tab, you must enter the two individual tickers:
• Symbol 1 Ticker: MGC
• Symbol 2 Ticker: SIL
(This is so the script can calculate the Correlation and Volatility filters).
Trading Signals
1. Mean-Reversion Signals
• BUY Signal (Green Triangle ▲): Appears only if the background is GREEN and the Price Z-Score (blue line) crosses below the -2.0 band.
• SELL Signal (Red Triangle ▼): Appears only if the background is GREEN and the Price Z-Score (blue line) crosses above the +2.0 band.
• EXIT: Your target is a reversion back to the 0 line. The Half-Life value gives you an idea of how long to wait.
2. Divergence Warning Signals
• Blue/Fuchsia Triangles (▲ / ▼): These appear at the exact moment the background turns RED. They warn you that the "stable" regime is broken and a new "divergence" or "trend" regime may be starting. This is a signal to stay out or manage any existing positions.
This tool is designed to add a layer of quantitative, risk-management logic to a standard Z-Score strategy. It helps you trade only when the statistics are in your favor.
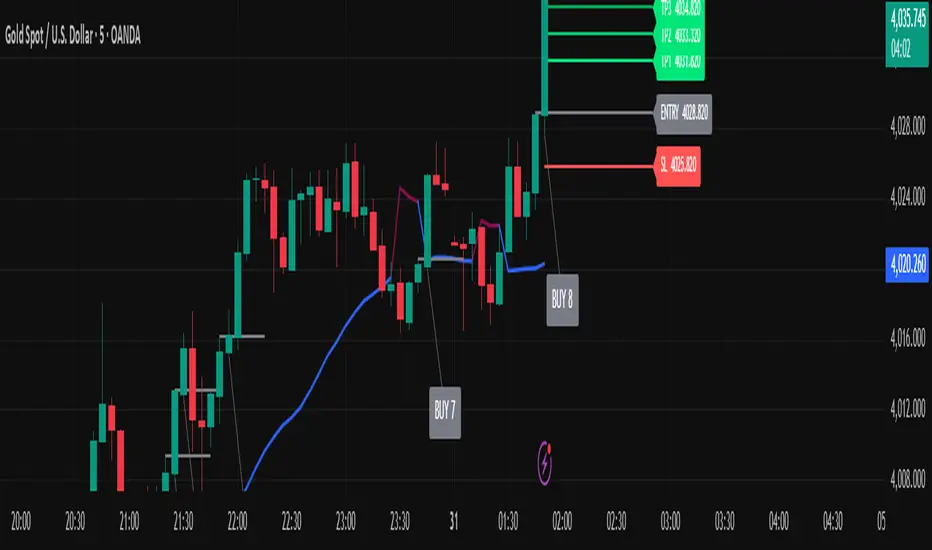
Golden Ladder – Louay Joha (Wave & Gann Hi/Lo + ATR R-Levels)Overview
Golden Ladder is a momentum-and-structure tool that detects three-bar ladder waves and filters them with a Gann Hi/Lo regime guide (SMA-based). When a valid wave aligns with the current Hi/Lo bias and passes optional market filters (ADX, RSI, and proximity to recent extremes), the script prints BUY/SELL n labels (n = wave index) and draws a complete Entry / SL / TP1–TP4 ladder using ATR-based risk units (R) or fixed caps—configured for clarity and consistency. The script also keeps the chart clean: the last trade remains fully drawn while historical groups are trimmed to compact “ENTRY-only” stubs.
Why these components together (originality)
Three-bar ladder captures short-term momentum structure (progressively higher highs/lows for buys; the reverse for sells).
Gann Hi/Lo (SMA of highs/lows with a directional state) acts as a regime filter, reducing counter-trend ladders.
ATR-based R ladder turns signals into an actionable plan: a volatility-aware SL and TP1–TP4 that scale across instruments/timeframes.
Smart Entry filters (ADX strength, RSI extremes, and distance from recent top/bottom using ATR buffers) seek to avoid low-quality, stretched entries.
Slim history keeps only a short ENTRY stub for prior groups, so the signal you just got is always the most readable.
This is not a mere mashup; each layer constrains the others to produce fewer, clearer setups.
How it works (high-level logic)
Regime (Gann Hi/Lo):
Compute SMA(high, HPeriod) and SMA(low, LPeriod).
Direction state HLv flips when the close crosses above/below its track; one unified Hi/Lo guide is plotted.
Ladder signal (structure + confirmation):
BUY ladder: three consecutive green bars with rising highs and rising lows and HLv == +1.
SELL ladder: mirror conditions with HLv == -1.
Signals evaluate intrabar and are controlled by Smart Entry filters (ADX/RSI/extreme checks).
Risk ladder (R-based or capped):
Default: risk = ATR(atr_len) × SL_multiple and TPs in R.
Optional fixed caps by timeframe (e.g., M1/M5) using USD per point.
Longs: SL = entry – risk; TPi = entry + (Ri × risk).
Shorts: SL = entry + risk; TPi = entry – (Ri × risk).
All levels auto-reflow to the right as bars print.
Chart hygiene:
The latest trade shows ENTRY/SL/TP1–TP4 fully.
Older trades are automatically trimmed (only a short ENTRY line remains, with optional label).
Alerts:
BUY – Smart Entry (Tick) & SELL – Smart Entry (Tick) fire on live-qualified signals.
You can connect alerts to your automation, respecting your broker’s risk controls.
Inputs (English summary of UI)
Label settings: label size; ATR-based vs fixed-tick offsets; leader line width/transparency; horizontal label shift.
Gann Hi/Lo: HIGH Period (HPeriod), LOW Period (LPeriod).
Market filters: ADX (length, smoothing, minimum), RSI (length + caps), recent extremes (lookback + ATR buffer).
Entry/SL/TP Levels: TP1–TP4 (R), label right-shift, show last-trade prices on labels.
Fixed SL Caps: per-timeframe caps (M1/M5) via USD per point.
How to use
Apply on your instrument/timeframe; tune H/L periods and filters to your market (e.g., XAUUSD on M1/M5).
Favor signals aligned with the Hi/Lo regime; tighten filters (higher ADX, stricter RSI caps) to reduce noise.
Choose ATR-Risk or fixed caps depending on your preferences.
The drawing policy ensures the most recent trade remains front-and-center.
Notes & limitations
Signals can evaluate intrabar; MA-based context is inherently lagging.
ATR-based ladders adapt to volatility; extreme spikes can widen risk.
This is a technical analysis tool, not financial advice.
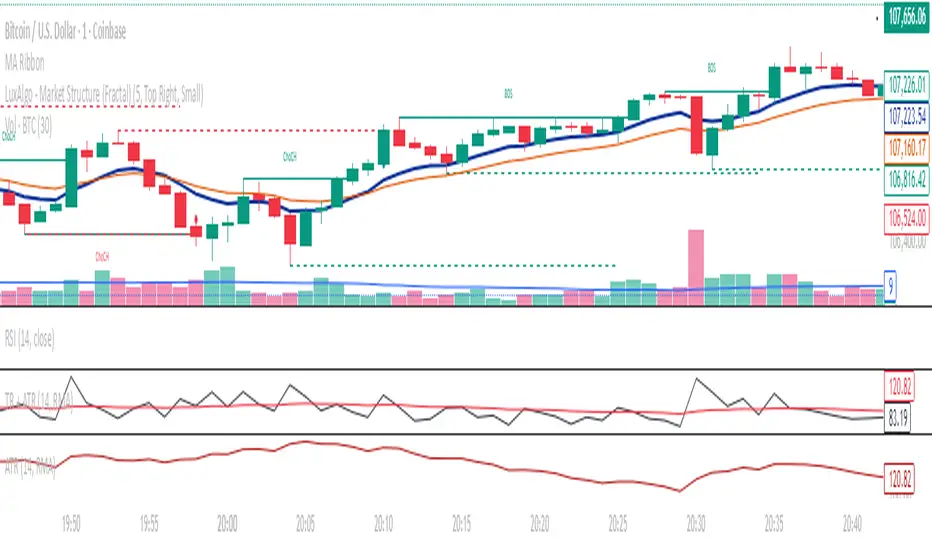
True Range(TR) + Average True Range (ATR) COMBINEDThis indicator combines True Range (TR) and Average True Range (ATR) into a single panel for a clearer understanding of price volatility.
True Range (TR) measures the absolute price movement between highs, lows, and previous closes — showing raw, unsmoothed volatility.
Average True Range (ATR) is a moving average of the True Range, providing a smoother, more stable volatility signal.
📊 Usage Tips:
High TR/ATR values indicate strong price movement or volatility expansion.
Low values suggest compression or a potential volatility breakout zone.
Can be used for stop-loss placement, volatility filters, or trend strength confirmation.
⚙️ Features:
Multiple smoothing methods: RMA, SMA, EMA, WMA.
Adjustable ATR length.
Separate colored plots for TR (yellow) and ATR (red).
Works across all timeframes and instruments.
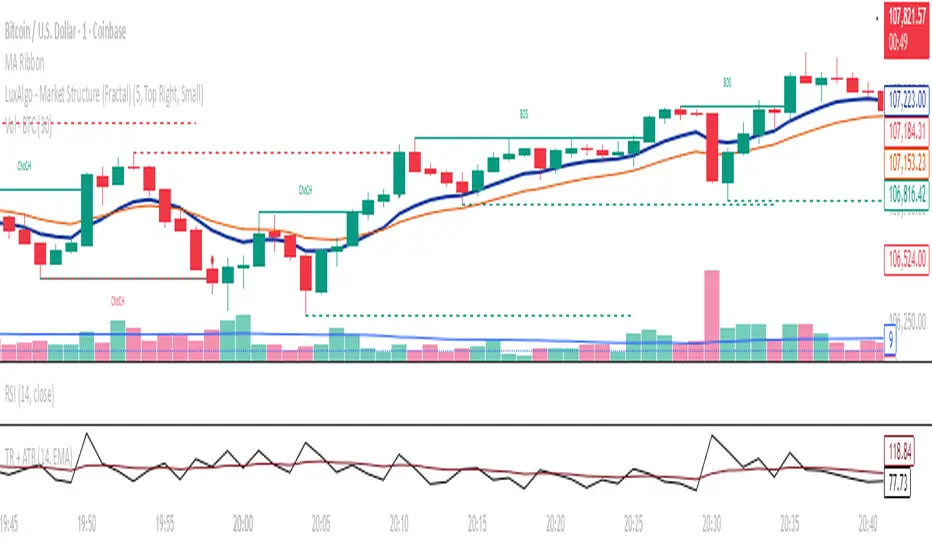
True Range(TR) & ATR Combined – Volatility Strength IndicatorThis indicator combines True Range (TR) and Average True Range (ATR) into a single panel for a clearer understanding of price volatility.
True Range (TR) measures the absolute price movement between highs, lows, and previous closes — showing raw, unsmoothed volatility.
Average True Range (ATR) is a moving average of the True Range, providing a smoother, more stable volatility signal.
📊 Usage Tips:
High TR/ATR values indicate strong price movement or volatility expansion.
Low values suggest compression or a potential volatility breakout zone.
Can be used for stop-loss placement, volatility filters, or trend strength confirmation.
⚙️ Features:
Multiple smoothing methods: RMA, SMA, EMA, WMA.
Adjustable ATR length.
Separate colored plots for TR (yellow) and ATR (red).
Works across all timeframes and instruments.
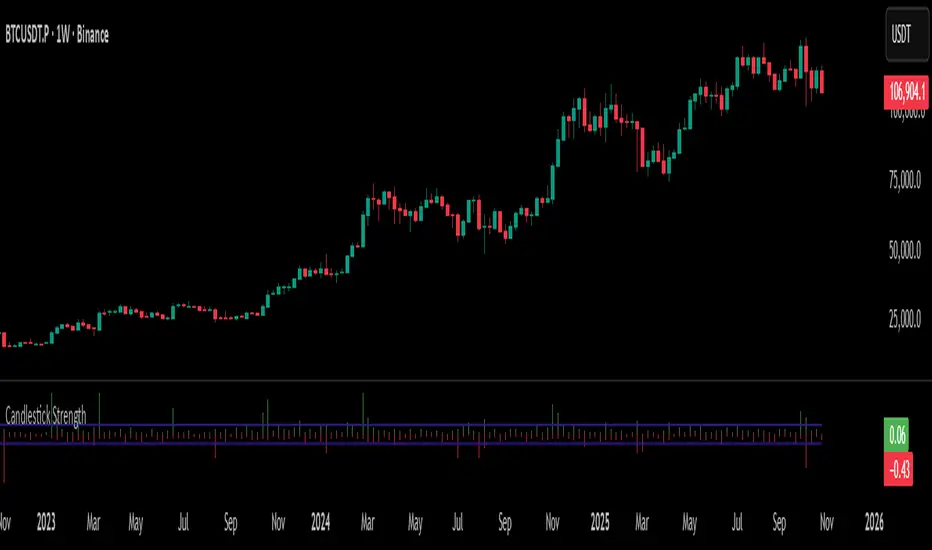
Candlestick StrengthThis indicator quantifies the “energy” of each candlestick by combining its height (high–low span), trading volume, and internal structure (body vs. wick proportions). It provides a numeric measure of how strongly each candle contributes to market momentum, allowing traders to distinguish meaningful price action from indecision or noise.
Concept
Every candlestick represents a short-term contest between buyers and sellers. Large candles with significant volume indicate strong market participation, while small or low-volume candles suggest hesitation or absorption. Candlestick Strength captures this by calculating a normalized measure of each candle’s energy relative to recent activity, making it comparable across different market conditions and timeframes.
The indicator also analyzes the candle’s internal structure:
The body reflects net directional movement.
The wicks represent back-and-forth price traversal within the candle. Because wick movement does not fully contribute to directional momentum, it is weighted at half the body’s contribution. This ensures the indicator emphasizes sustained directional pressure while still acknowledging rejection or absorption.
Interpretation
High values indicate candles with energy above recent averages — suggesting expanding momentum and strong directional intent.
Average values reflect typical candle activity, representing neutral or steady market behavior.
Low values suggest weak candles — either the market is pausing, consolidating, or momentum is fading.
The outputs are displayed as a symmetric histogram: bullish candle energy is shown in green above zero, bearish energy in red below zero, with ±1 reference lines marking the normalized average energy level.
Usage
Combine with trend analysis, swing highs/lows, or volume-weighted averages to validate breakouts or trend continuation.
Monitor for divergence between price movement and candle energy to identify exhaustion, absorption, or potential reversals.
Filter out false momentum signals caused by narrow-range or low-volume candles.
Adaptable across timeframes: normalized energy allows comparison between small and large timeframe candles.
Vandan V2Vandan V2 is an automated trend-following strategy for NASDAQ E-mini Futures (NQ1!).
It uses multi-timeframe momentum and volatility filters to identify high-probability entries.
Includes dynamic risk management and trailing logic optimized for intraday trading.

ATR x Trend x Volume SignalsATR x Trend x Volume Signals is a multi-factor indicator that combines volatility, trend, and volume analysis into one adaptive framework. It is designed for traders who use technical confluence and prefer clear, rule-based setups.
🎯 Purpose
This tool identifies high-probability market moments when volatility structure (ATR), momentum direction (CCI-based trend logic), and volume expansion all align. It helps filter out noise and focus on clean, actionable trade conditions.
⚙️ Structure
The indicator consists of three main analytical layers:
1️⃣ ATR Trailing Stop – calculates two adaptive ATR lines (fast and slow) that define volatility context, trend bias, and potential reversal points.
2️⃣ Trend Indicator (CCI + ATR) – uses a CCI-based logic combined with ATR smoothing to determine the dominant trend direction and reduce false flips.
3️⃣ Volume Analysis – evaluates volume deviations from their historical average using standard deviation. Bars are highlighted as medium, high, or extra-high volume depending on intensity.
💡 Signal Logic
A Buy Signal (green) appears when all of the following are true:
• The ATR (slow) line is green.
• The Trend Indicator is blue.
• A bullish candle closes above both the ATR (slow) and the Trend Indicator.
• The candle shows medium, high, or extra-high volume.
A Sell Signal (red) appears when:
• The ATR (slow) line is red.
• The Trend Indicator is red.
• A bearish candle closes below both the ATR (slow) and the Trend Indicator.
• The candle shows medium, high, or extra-high volume.
Only one signal can appear per ATR trend phase. A new signal is generated only after the ATR direction changes.
❌ Exit Logic
Exit markers are shown when price crosses the slow ATR line. This behavior simulates a trailing stop exit. The exit is triggered one bar after entry to prevent same-bar exits.
⏰ Session Filter
Signals are generated only between the user-defined session start and end times (default: 14:00–18:00 chart time). This allows the trader to limit signal generation to active trading hours.
💬 Practical Use
It is recommended to trade with a fixed risk-reward ratio such as 1 : 1.5. Stop-loss placement should be beyond the slow ATR line and adjusted gradually as the trade develops.
For better confirmation, the Trend Indicator timeframe should be higher than the chart timeframe (for example: trading on 1 min → set Trend Indicator timeframe to 15 min; trading on 5 min → set to 1 hour).
🧠 Main Features
• Dual ATR volatility structure (fast and slow)
• CCI-based trend direction filtering
• Volume deviation heatmap logic
• Time-restricted signal generation
• Dynamic trailing-stop exit system
• Non-repainting logic
• Fully optimized for Pine Script v6
📊 Usage Tip
Best results are achieved when combining this indicator with additional technical context such as support-resistance, higher-timeframe confirmation, or market structure analysis.
📈 Credits
Inspired by:
• ATR Trailing Stop by Ceyhun
• Trend Magic by Kivanc Ozbilgic
• Heatmap Volume by xdecow

Volume Sentiment Breakout Channels [AlgoAlpha]🟠 OVERVIEW
This tool visualizes breakout zones based on volume sentiment within dynamic price channels . It identifies high-impact consolidation areas, quantifies buy/sell dominance inside those zones, and then displays real-time shifts in sentiment strength. When the market breaks above or below these sentiment-weighted channels, traders can interpret the event as a change in conviction, not just a technical breakout.
🟠 CONCEPTS
The script builds on two layers of logic:
Channel Detection : A volatility-based algorithm locates price compression areas using normalized highs and lows over a defined lookback. These “boxes” mark accumulation or distribution ranges.
Volume Sentiment Profiling : Each channel is internally divided into small bins, where volume is aggregated and signed by candle direction. This produces a granular sentiment map showing which levels are dominated by buyers or sellers.
When a breakout occurs, the script clears the previous box and forms a new one, letting traders visually track transitions between phases of control. The colored gradients and text updates continuously reflect the internal bias—green for net-buying, red for net-selling—so you can see conviction strength at a glance.
🟠 FEATURES
Volume-weighted sentiment map inside each box, with gradient color intensity proportional to participation.
Dynamic text display of current and overall sentiment within each channel.
Real-time trail lines to show active bullish/bearish trend extensions after breakout.
🟠 USAGE
Setup : Add the script to your chart and enable Strong Closes Only if you prefer cleaner breakouts. Use shorter normalization length (e.g., 50–80) for fast markets; longer (100–200) for smoother transitions.
Read Signals : Transparent boxes mark active sentiment channels. Green gradients show buy-side dominance, red shows sell-side. The middle dashed line is the equilibrium of the channel. “▲” appears when price breaks upward, “▼” when it breaks downward.
Understanding Sentiment : The sentiment profile can be used to show the probability of the price moving up or down at respective price levels.

MTF K-Means Price Regimes [matteovesperi] ⚠️ The preview uses a custom example to identify support/resistance zones. due to the fact that this identifier clusterizes, this is possible. this example was set up "in a hurry", therefore it has a possible inaccuracy. When setting up the indicator, it is extremely important to select the correct parameters and double-check them on the selected history.
📊 OVERVIEW
Purpose
MTF K-Means Price Regimes is a TradingView indicator that automatically identifies and classifies the current market regime based on the K-Means machine learning algorithm. The indicator uses data from a higher timeframe (Multi-TimeFrame, MTF) to build stable classification and applies it to the working timeframe in real-time.
Key Features
✅ Automatic market regime detection — the algorithm finds clusters of similar market conditions
✅ Multi-timeframe (MTF) — clustering on higher TF, application on lower TF
✅ Adaptive — model recalculates when a new HTF bar appears with a rolling window
✅ Non-Repainting — classification is performed only on closed bars
✅ Visualization — bar coloring + information panel with cluster characteristics
✅ Flexible settings — from 2 to 10 clusters, customizable feature periods, HTF selection
━━━━━━━━━━━━━━━━━━━━━━━━━━━━━━━━━━━━━━━━━━━━━━━━━━━━━━━━━━━━━━━━━
🔬 TECHNICAL DETAILS
K-Means Clustering Algorithm
What is K-Means?
K-Means is one of the most popular clustering algorithms (unsupervised machine learning). It divides a dataset into K groups (clusters) so that similar elements are within each cluster, and different elements are between clusters.
Algorithm objective:
Minimize within-cluster variance (sum of squared distances from points to their cluster center).
How Does K-Means Work in Our Indicator?
Step 1: Data Collection
The indicator accumulates history from the higher timeframe (HTF):
RSI (Relative Strength Index) — overbought/oversold indicator
ATR% (Average True Range as % of price) — volatility indicator
ΔP% (Price Change in %) — trend strength and direction indicator
By default, 200 HTF bars are accumulated (clusterLookback parameter).
Step 2: Creating Feature Vectors
Each HTF bar is described by a three-dimensional vector:
Vector =
Step 3: Normalization (Z-Score)
All features are normalized to bring them to a common scale:
Normalized_Value = (Value - Mean) / StdDev
This is critically important, as RSI is in the range 0-100, while ATR% and ΔP% have different scales. Without normalization, one feature would dominate over others.
Step 4: K-Means++ Centroid Initialization
Instead of random selection of K initial centers, an improved K-Means++ method is used:
First centroid is randomly selected from the data
Each subsequent centroid is selected with probability proportional to the square of the distance to the nearest already selected centroid
This ensures better initial centroid distribution and faster convergence
Step 5: Iterative Optimization (Lloyd's Algorithm)
Repeat until convergence (or maxIterations):
1. Assignment step:
For each point find the nearest centroid and assign it to this cluster
2. Update step:
Recalculate centroids as the average of all points in each cluster
3. Convergence check:
If centroids shifted less than 0.001 → STOP
Euclidean distance in 3D space is used:
Distance = sqrt((RSI1 - RSI2)² + (ATR1 - ATR2)² + (ΔP1 - ΔP2)²)
Step 6: Adaptive Update
With each new HTF bar:
The oldest bar is removed from history (rolling window method)
New bar is added to history
K-Means algorithm is executed again on updated data
Model remains relevant for current market conditions
Real-Time Classification
After building the model (clusters + centroids), the indicator works in classification mode:
On each closed bar of the current timeframe, RSI, ATR%, ΔP% are calculated
Feature vector is normalized using HTF statistics (Mean/StdDev)
Distance to all K centroids is calculated
Bar is assigned to the cluster with minimum distance
Bar is colored with the corresponding cluster color
Important: Classification occurs only on a closed bar (barstate.isconfirmed), which guarantees no repainting .
Data Architecture
Persistent variables (var):
├── featureVectors - Normalized HTF feature vectors
├── centroids - Cluster center coordinates (K * 3 values)
├── assignments - Assignment of each HTF bar to a cluster
├── htfRsiHistory - History of RSI values from HTF
├── htfAtrHistory - History of ATR values from HTF
├── htfPcHistory - History of price changes from HTF
├── htfCloseHistory - History of close prices from HTF
├── htfRsiMean, htfRsiStd - Statistics for RSI normalization
├── htfAtrMean, htfAtrStd - Statistics for ATR normalization
├── htfPcMean, htfPcStd - Statistics for Price Change normalization
├── isCalculated - Model readiness flag
└── currentCluster - Current active cluster
All arrays are synchronized and updated atomically when a new HTF bar appears.
Computational Complexity
Data collection: O(1) per bar
K-Means (one pass):
- Assignment: O(N * K) where N = number of points, K = number of clusters
- Update: O(N * K)
- Total: O(N * K * I) where I = number of iterations (usually 5-20)
Example: With N=200 HTF bars, K=5 clusters, I=20 iterations:
200 * 5 * 20 = 20,000 operations (executes quickly)
━━━━━━━━━━━━━━━━━━━━━━━━━━━━━━━━━━━━━━━━━━━━━━━━━━━━━━━━━━━━━━━━━
📖 USER GUIDE
Quick Start
1. Adding the Indicator
TradingView → Indicators → Favorites → MTF K-Means Price Regimes
Or copy the code from mtf_kmeans_price_regimes.pine into Pine Editor.
2. First Launch
When adding the indicator to the chart, you'll see a table in the upper right corner:
┌─────────────────────────┐
│ Status │ Collecting HTF │
├─────────────────────────┤
│ Collected│ 15 / 50 │
└─────────────────────────┘
This means the indicator is accumulating history from the higher timeframe. Wait until the counter reaches the minimum (default 50 bars for K=5).
3. Active Operation
After data collection is complete, the main table with cluster information will appear:
┌────┬──────┬──────┬──────┬──────────────┬────────┐
│ ID │ RSI │ ATR% │ ΔP% │ Description │Current │
├────┼──────┼──────┼──────┼──────────────┼────────┤
│ 1 │ 68.5 │ 2.15 │ 1.2 │ High Vol,Bull│ │
│ 2 │ 52.3 │ 0.85 │ 0.1 │ Low Vol,Flat │ ► │
│ 3 │ 35.2 │ 1.95 │ -1.5 │ High Vol,Bear│ │
└────┴──────┴──────┴──────┴──────────────┴────────┘
The arrow ► indicates the current active regime. Chart bars are colored with the corresponding cluster color.
Customizing for Your Strategy
Choosing Higher Timeframe (HTF)
Rule: HTF should be at least 4 times higher than the working timeframe.
| Working TF | Recommended HTF |
|------------|-----------------|
| 1 min | 15 min - 1H |
| 5 min | 1H - 4H |
| 15 min | 4H - D |
| 1H | D - W |
| 4H | D - W |
| D | W - M |
HTF Selection Effect:
Lower HTF (closer to working TF): More sensitive, frequently changing classification
Higher HTF (much larger than working TF): More stable, long-term regime assessment
Number of Clusters (K)
K = 2-3: Rough division (e.g., "uptrend", "downtrend", "flat")
K = 4-5: Optimal for most cases (DEFAULT: 5)
K = 6-8: Detailed segmentation (requires more data)
K = 9-10: Very fine division (only for long-term analysis with large windows)
Important constraint:
clusterLookback ≥ numClusters * 10
I.e., for K=5 you need at least 50 HTF bars, for K=10 — at least 100 bars.
Clustering Depth (clusterLookback)
This is the rolling window size for building the model.
50-100 HTF bars: Fast adaptation to market changes
200 HTF bars: Optimal balance (DEFAULT)
500-1000 HTF bars: Long-term, stable model
If you get an "Insufficient data" error:
Decrease clusterLookback
Or select a lower HTF (e.g., "4H" instead of "D")
Or decrease numClusters
Color Scheme
Default 10 colors:
Red → Often: strong bearish, high volatility
Orange → Transition, medium volatility
Yellow → Neutral, decreasing activity
Green → Often: strong bullish, high volatility
Blue → Medium bullish, medium volatility
Purple → Oversold, possible reversal
Fuchsia → Overbought, possible reversal
Lime → Strong upward momentum
Aqua → Consolidation, low volatility
White → Undefined regime (rare)
Important: Cluster colors are assigned randomly at each model recalculation! Don't rely on "red = bearish". Instead, look at the description in the table (RSI, ATR%, ΔP%).
You can customize colors in the "Colors" settings section.
━━━━━━━━━━━━━━━━━━━━━━━━━━━━━━━━━━━━━━━━━━━━━━━━━━━━━━━━━━━━━━━━━
⚙️ INDICATOR PARAMETERS
Main Parameters
Higher Timeframe (htf)
Type: Timeframe selection
Default: "D" (daily)
Description: Timeframe on which the clustering model is built
Recommendation: At least 4 times larger than your working TF
Clustering Depth (clusterLookback)
Type: Integer
Range: 50 - 2000
Default: 200
Description: Number of HTF bars for building the model (rolling window size)
Recommendation:
- Increase for more stable long-term model
- Decrease for fast adaptation or if there's insufficient historical data
Number of Clusters (K) (numClusters)
Type: Integer
Range: 2 - 10
Default: 5
Description: Number of market regimes the algorithm will identify
Recommendation:
- K=3-4 for simple strategies (trending/ranging)
- K=5-6 for universal strategies
- K=7-10 only when clusterLookback ≥ 100*K
Max K-Means Iterations (maxIterations)
Type: Integer
Range: 5 - 50
Default: 20
Description: Maximum number of algorithm iterations
Recommendation:
- 10-20 is sufficient for most cases
- Increase to 30-50 if using K > 7
Feature Parameters
RSI Period (rsiLength)
Type: Integer
Default: 14
Description: Period for RSI calculation (overbought/oversold feature)
Recommendation:
- 14 — standard
- 7-10 — more sensitive
- 20-25 — more smoothed
ATR Period (atrLength)
Type: Integer
Default: 14
Description: Period for ATR calculation (volatility feature)
Recommendation: Usually kept equal to rsiLength
Price Change Period (pcLength)
Type: Integer
Default: 5
Description: Period for percentage price change calculation (trend feature)
Recommendation:
- 3-5 — short-term trend
- 10-20 — medium-term trend
Visualization
Show Info Panel (showDashboard)
Type: Checkbox
Default: true
Description: Enables/disables the information table on the chart
Cluster Color 1-10
Type: Color selection
Description: Customize colors for visual cluster distinction
Recommendation: Use contrasting colors for better readability
━━━━━━━━━━━━━━━━━━━━━━━━━━━━━━━━━━━━━━━━━━━━━━━━━━━━━━━━━━━━━━━━━
📊 INTERPRETING RESULTS
Reading the Information Table
┌────┬──────┬──────┬──────┬──────────────┬────────┐
│ ID │ RSI │ ATR% │ ΔP% │ Description │Current │
├────┼──────┼──────┼──────┼──────────────┼────────┤
│ 1 │ 68.5 │ 2.15 │ 1.2 │ High Vol,Bull│ │
│ 2 │ 52.3 │ 0.85 │ 0.1 │ Low Vol,Flat │ ► │
│ 3 │ 35.2 │ 1.95 │ -1.5 │ High Vol,Bear│ │
│ 4 │ 45.0 │ 1.20 │ -0.3 │ Low Vol,Bear │ │
│ 5 │ 72.1 │ 3.05 │ 2.8 │ High Vol,Bull│ │
└────┴──────┴──────┴──────┴──────────────┴────────┘
"ID" Column
Cluster number (1-K). Order doesn't matter.
"RSI" Column
Average RSI value in the cluster (0-100):
< 30: Oversold zone
30-45: Bearish sentiment
45-55: Neutral zone
55-70: Bullish sentiment
> 70: Overbought zone
"ATR%" Column
Average volatility in the cluster (as % of price):
< 1%: Low volatility (consolidation, narrow range)
1-2%: Normal volatility
2-3%: Elevated volatility
> 3%: High volatility (strong movements, impulses)
Compared to the average volatility across all clusters to determine "High Vol" or "Low Vol".
"ΔP%" Column
Average price change in the cluster (in % over pcLength period):
> +0.05%: Bullish regime
-0.05% ... +0.05%: Flat (sideways movement)
< -0.05%: Bearish regime
"Description" Column
Automatic interpretation:
"High Vol, Bull" → Strong upward momentum, high activity
"Low Vol, Flat" → Consolidation, narrow range, uncertainty
"High Vol, Bear" → Strong decline, panic, high activity
"Low Vol, Bull" → Slow growth, low activity
"Low Vol, Bear" → Slow decline, low activity
"Current" Column
Arrow ► shows which cluster the last closed bar of your working timeframe is in.
Typical Cluster Patterns
Example 1: Trend/Flat Division (K=3)
Cluster 1: RSI=65, ATR%=2.5, ΔP%=+1.5 → Bullish trend
Cluster 2: RSI=50, ATR%=0.8, ΔP%=0.0 → Flat/Consolidation
Cluster 3: RSI=35, ATR%=2.3, ΔP%=-1.4 → Bearish trend
Strategy: Open positions when regime changes Flat → Trend, avoid flat.
Example 2: Volatility Breakdown (K=5)
Cluster 1: RSI=72, ATR%=3.5, ΔP%=+2.5 → Strong bullish impulse (high risk)
Cluster 2: RSI=60, ATR%=1.5, ΔP%=+0.8 → Moderate bullish (optimal entry point)
Cluster 3: RSI=50, ATR%=0.7, ΔP%=0.0 → Flat
Cluster 4: RSI=40, ATR%=1.4, ΔP%=-0.7 → Moderate bearish
Cluster 5: RSI=28, ATR%=3.2, ΔP%=-2.3 → Strong bearish impulse (panic)
Strategy: Enter in Cluster 2 or 4, avoid extremes (1, 5).
Example 3: Mixed Regimes (K=7+)
With large K, clusters can represent condition combinations:
High RSI + Low volatility → "Quiet overbought"
Neutral RSI + High volatility → "Uncertainty with high activity"
Etc.
Requires individual analysis of each cluster.
Regime Changes
Important signal: Transition from one cluster to another!
Trading situation examples:
Flat → Bullish trend → Buy signal
Bullish trend → Flat → Take profit, close longs
Flat → Bearish trend → Sell signal
Bearish trend → Flat → Close shorts, wait
You can build a trading system based on the current active cluster and transitions between them.
━━━━━━━━━━━━━━━━━━━━━━━━━━━━━━━━━━━━━━━━━━━━━━━━━━━━━━━━━━━━━━━━━
💡 USAGE EXAMPLES
Example 1: Scalping with HTF Filter
Task: Scalping on 5-minute charts, but only enter in the direction of the daily regime.
Settings:
Working TF: 5 min
HTF: D (daily)
K: 3 (simple division)
clusterLookback: 100
Logic:
IF current cluster = "Bullish" (ΔP% > 0.5)
→ Look for long entry points on 5M
IF current cluster = "Bearish" (ΔP% < -0.5)
→ Look for short entry points on 5M
IF current cluster = "Flat"
→ Don't trade / reduce risk
Example 2: Swing Trading with Volatility Filtering
Task: Swing trading on 4H, enter only in regimes with medium volatility.
Settings:
Working TF: 4H
HTF: D (daily)
K: 5
clusterLookback: 200
Logic:
Allowed clusters for entry:
- ATR% from 1.5% to 2.5% (not too quiet, not too chaotic)
- ΔP% with clear direction (|ΔP%| > 0.5)
Prohibited clusters:
- ATR% > 3% → Too risky (possible gaps, sharp reversals)
- ATR% < 1% → Too quiet (small movements, commissions eat profit)
Example 3: Portfolio Rotation
Task: Managing a portfolio of multiple assets, allocate capital depending on regimes.
Settings:
Working TF: D (daily)
HTF: W (weekly)
K: 4
clusterLookback: 100
Logic:
For each asset in portfolio:
IF regime = "Strong trend + Low volatility"
→ Increase asset weight in portfolio (40-50%)
IF regime = "Medium trend + Medium volatility"
→ Standard weight (20-30%)
IF regime = "Flat" or "High volatility without trend"
→ Minimum weight or exclude (0-10%)
Example 4: Combining with Other Indicators
MTF K-Means as a filter:
Main strategy: MA Crossover
Filter: MTF K-Means on higher TF
Rule:
IF MA_fast > MA_slow AND Cluster = "Bullish regime"
→ LONG
IF MA_fast < MA_slow AND Cluster = "Bearish regime"
→ SHORT
ELSE
→ Don't trade (regime doesn't confirm signal)
This dramatically reduces false signals in unsuitable market conditions.
━━━━━━━━━━━━━━━━━━━━━━━━━━━━━━━━━━━━━━━━━━━━━━━━━━━━━━━━━━━━━━━━━
📈 OPTIMIZATION RECOMMENDATIONS
Optimal Settings for Different Styles
Day Trading
Working TF: 5M - 15M
HTF: 1H - 4H
numClusters: 4-5
clusterLookback: 100-150
Swing Trading
Working TF: 1H - 4H
HTF: D
numClusters: 5-6
clusterLookback: 150-250
Position Trading
Working TF: D
HTF: W - M
numClusters: 4-5
clusterLookback: 100-200
Scalping
Working TF: 1M - 5M
HTF: 15M - 1H
numClusters: 3-4
clusterLookback: 50-100
Backtesting
To evaluate effectiveness:
Load historical data (minimum 2x clusterLookback HTF bars)
Apply the indicator with your settings
Study cluster change history:
- Do changes coincide with actual trend transitions?
- How often do false signals occur?
Optimize parameters:
- If too much noise → increase HTF or clusterLookback
- If reaction too slow → decrease HTF or increase numClusters
Combining with Other Techniques
Regime-Based Approach:
MTF K-Means (regime identification)
↓
+---+---+---+
| | | |
v v v v
Trend Flat High_Vol Low_Vol
↓ ↓ ↓ ↓
Strategy_A Strategy_B Don't_trade
Examples:
Trend: Use trend-following strategies (MA crossover, Breakout)
Flat: Use mean-reversion strategies (RSI, Bollinger Bands)
High volatility: Reduce position sizes, widen stops
Low volatility: Expect breakout, don't open positions inside range
━━━━━━━━━━━━━━━━━━━━━━━━━━━━━━━━━━━━━━━━━━━━━━━━━━━━━━━━━━━━━━━━━
📞 SUPPORT
Report an Issue
If you found a bug or have a suggestion for improvement:
Describe the problem in as much detail as possible
Specify your indicator settings
Attach a screenshot (if possible)
Specify the asset and timeframe where the problem is observed

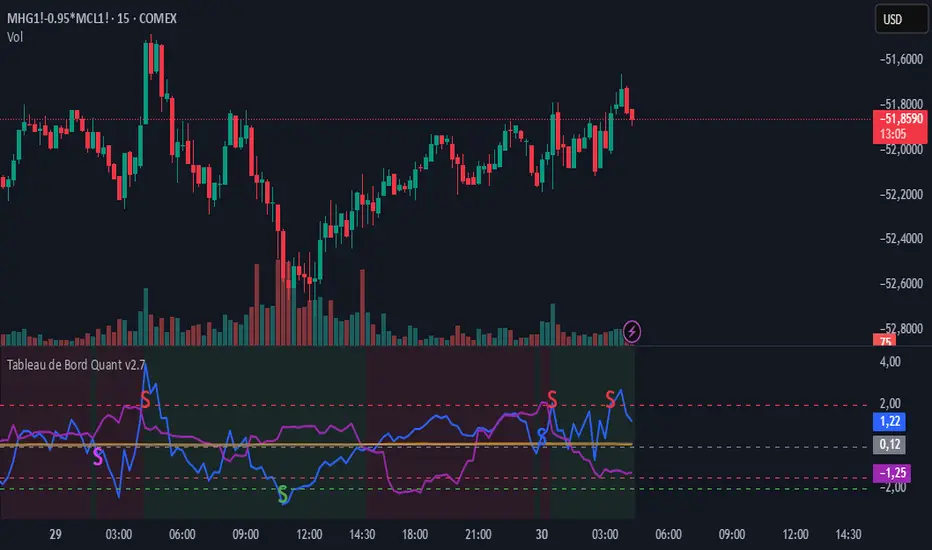
Zscore COrrelation volatility OberlinThis is a complete multi-strategy dashboard for statistical arbitrage (pairs trading). It is designed to solve the biggest challenge in pairs trading: knowing when to trade mean-reversion and when to trade a regime break.
This indicator automatically analyzes the stability of the pair's relationship using two critical filters (a Volatility Ratio filter and a Correlation Z-Score filter). It then provides clear, actionable signals for two opposite strategies based on the current market "regime."
The Regime "Traffic Light" System
The indicator's background color tells you which strategy is currently active.
• 🟢 GREEN Background (Stable Regime): This is the "Mean Reversion" regime. It means both the volatility and correlation filters are stable. The pair is behaving predictably, and you can trust the Z-Score to revert to its mean.
• 🔴 RED Background (Unstable Regime): This is the "Divergence" or "Breakout" regime. It means the pair's relationship has failed (correlation has broken down OR volatility has exploded). In this regime, the Z-Score is not expected to revert and may continue to diverge.
How to Use: The Two Strategies
The indicator will plot text labels on your chart for four specific signals.
📈 Strategy 1: Mean Reversion (Green Regime 🟢)
This is the classic pairs trading strategy. You only take these signals when the background is GREEN.
• LONG Signal: "ACHAT MOYENNE" (Buy Mean)
• What it means: The Z-Score (blue line) has crossed below the lower band (e.g., -2.0) while the regime is stable.
• Your Bet: The spread is statistically "too cheap" and will rise back to the 0-line.
• Action: Buy the Spread (e.g., Buy MES, Sell MNQ).
• SHORT Signal: "VENTE MOYENNE" (Sell Mean)
• What it means: The Z-Score (blue line) has crossed above the upper band (e.g., +2.0) while the regime is stable.
• Your Bet: The spread is statistically "too expensive" and will fall back to the 0-line.
• Action: Sell the Spread (e.g., Sell MES, Buy MNQ).
• Exit Target: Close your position when the Z-Score (blue line) returns to 0.
🚀 Strategy 2: Divergence / Momentum (Red Regime 🔴)
This is a momentum strategy that bets on the continuation of a regime break. These signals appear on the exact bar the background turns RED.
• LONG Signal: "ACHAT ÉCART" (Buy Divergence)
• What it means: The regime just broke (turned RED) at the same time the Z-Score was already rising.
• Your Bet: The pair's relationship is broken, and the spread will continue to "rip" higher, diverging further from the mean.
• Action: Buy the Spread (e.g., Buy MES, Sell MNQ) and hold for momentum.
• SHORT Signal: "VENTE ÉCART" (Sell Divergence)
• What it means: The regime just broke (turned RED) at the same time the Z-Score was already falling.
• Your Bet: The pair's relationship is broken, and the spread will continue to "crash" lower, diverging further from the mean.
• Action: Sell the Spread (e.g., Sell MES, Buy MNQ) and hold for momentum.
• Exit Target: This is a momentum trade, so the exit is not the 0-line. Use a trailing stop or exit when the regime becomes stable again (turns GREEN).
The 3 Indicator Panes
1. Pane 1: Main Dashboard (Signal Pane)
• Z-Score PRIX (Blue Line): Your main signal. Shows the spread's deviation.
• Regime (Background Color): Your "traffic light" (Green for Mean Reversion, Red for Divergence).
• Trade Labels: The explicit entry signals.
2. Pane 2: Volatility Ratio (Diagnostic Pane)
• This pane shows the ratio of the two assets' volatility (Orange Line) vs. its long-term average (Gray Line).
• It is one of the two filters used to decide if the regime is "stable." If the orange line moves too far from the gray line, the regime turns RED.
3. Pane 3: Correlation Z-Score (Diagnostic Pane)
• This is the most critical filter. It measures the Z-Score of the rolling correlation itself.
• If this Purple Line drops below the Red Dashed Line (the "Danger Threshold"), it means the pair's correlation has statistically broken. This is the primary trigger for the RED "Divergence" regime.
Settings
• Symbol 1 & 2 Tickers: Set the two assets for the filters (e.g., "MES1!" and "MNQ1!"). Note: You must still load the spread chart itself (e.g., MES1!-MNQ1!) for the Price Z-Score to work.
• Z-Score Settings: Adjust the lookback period and bands for the Price Z-Score.
• Volatility Filter Settings: Adjust the ATR period, the MA period, and the deviation threshold.
• Correlation Filter Settings: Adjust the lookback periods and the "danger threshold" for the Correlation Z-Score.
Disclaimer: This indicator is for educational and informational purposes only. It does not constitute financial advice. All trading involves significant risk. Past performance is not indicative of future results.
ZScore correlation volatility spread pacThis is a complete multi-strategy dashboard for statistical arbitrage (pairs trading). It is designed to solve the biggest challenge in pairs trading: knowing when to trade mean-reversion and when to trade a regime break.
This indicator automatically analyzes the stability of the pair's relationship using two critical filters (a Volatility Ratio filter and a Correlation Z-Score filter). It then provides clear, actionable signals for two opposite strategies based on the current market "regime."
The Regime "Traffic Light" System
The indicator's background color tells you which strategy is currently active.
• 🟢 GREEN Background (Stable Regime): This is the "Mean Reversion" regime. It means both the volatility and correlation filters are stable. The pair is behaving predictably, and you can trust the Z-Score to revert to its mean.
• 🔴 RED Background (Unstable Regime): This is the "Divergence" or "Breakout" regime. It means the pair's relationship has failed (correlation has broken down OR volatility has exploded). In this regime, the Z-Score is not expected to revert and may continue to diverge.
How to Use: The Two Strategies
The indicator will plot text labels on your chart for four specific signals.
📈 Strategy 1: Mean Reversion (Green Regime 🟢)
This is the classic pairs trading strategy. You only take these signals when the background is GREEN.
• LONG Signal: "ACHAT MOYENNE" (Buy Mean)
• What it means: The Z-Score (blue line) has crossed below the lower band (e.g., -2.0) while the regime is stable.
• Your Bet: The spread is statistically "too cheap" and will rise back to the 0-line.
• Action: Buy the Spread (e.g., Buy MES, Sell MNQ).
• SHORT Signal: "VENTE MOYENNE" (Sell Mean)
• What it means: The Z-Score (blue line) has crossed above the upper band (e.g., +2.0) while the regime is stable.
• Your Bet: The spread is statistically "too expensive" and will fall back to the 0-line.
• Action: Sell the Spread (e.g., Sell MES, Buy MNQ).
• Exit Target: Close your position when the Z-Score (blue line) returns to 0.
🚀 Strategy 2: Divergence / Momentum (Red Regime 🔴)
This is a momentum strategy that bets on the continuation of a regime break. These signals appear on the exact bar the background turns RED.
• LONG Signal: "ACHAT ÉCART" (Buy Divergence)
• What it means: The regime just broke (turned RED) at the same time the Z-Score was already rising.
• Your Bet: The pair's relationship is broken, and the spread will continue to "rip" higher, diverging further from the mean.
• Action: Buy the Spread (e.g., Buy MES, Sell MNQ) and hold for momentum.
• SHORT Signal: "VENTE ÉCART" (Sell Divergence)
• What it means: The regime just broke (turned RED) at the same time the Z-Score was already falling.
• Your Bet: The pair's relationship is broken, and the spread will continue to "crash" lower, diverging further from the mean.
• Action: Sell the Spread (e.g., Sell MES, Buy MNQ) and hold for momentum.
• Exit Target: This is a momentum trade, so the exit is not the 0-line. Use a trailing stop or exit when the regime becomes stable again (turns GREEN).
The 3 Indicator Panes
1. Pane 1: Main Dashboard (Signal Pane)
• Z-Score PRIX (Blue Line): Your main signal. Shows the spread's deviation.
• Regime (Background Color): Your "traffic light" (Green for Mean Reversion, Red for Divergence).
• Trade Labels: The explicit entry signals.
2. Pane 2: Volatility Ratio (Diagnostic Pane)
• This pane shows the ratio of the two assets' volatility (Orange Line) vs. its long-term average (Gray Line).
• It is one of the two filters used to decide if the regime is "stable." If the orange line moves too far from the gray line, the regime turns RED.
3. Pane 3: Correlation Z-Score (Diagnostic Pane)
• This is the most critical filter. It measures the Z-Score of the rolling correlation itself.
• If this Purple Line drops below the Red Dashed Line (the "Danger Threshold"), it means the pair's correlation has statistically broken. This is the primary trigger for the RED "Divergence" regime.
Settings
• Symbol 1 & 2 Tickers: Set the two assets for the filters (e.g., "MES1!" and "MNQ1!"). Note: You must still load the spread chart itself (e.g., MES1!-MNQ1!) for the Price Z-Score to work.
• Z-Score Settings: Adjust the lookback period and bands for the Price Z-Score.
• Volatility Filter Settings: Adjust the ATR period, the MA period, and the deviation threshold.
• Correlation Filter Settings: Adjust the lookback periods and the "danger threshold" for the Correlation Z-Score.
Disclaimer: This indicator is for educational and informational purposes only. It does not constitute financial advice. All trading involves significant risk. Past performance is not indicative of future results.
