TFi Simple Moving Average Bot V1 - PUBLICThe bot is using 2 moving averages for detecting the trend; the type of moving average is configurable; if the 2 moving averages are crossing it enters a long or short position. A stop-loss and profit-target can be configured; if reaching the profit-target, the bot is closing 50% (configurable) of the position, from this time on it is using a trailing-stop to close the position if the trailing-stop has been crossed.
The following moving-averages can be configured:
DEMA
EMA
HMA
RMA
SMA
TEMA
VWMA
WMA
Overview of features:
Optional stop-loss and profit-target/trailing-stop
Built-in backtesting engine with start balance, position size and pyramiding; each year will be evaluated separately
Inputs for a percentage entry and exit slippage, entry/exit and daily funding fees
Configurable alerts, which follow the exact position of the entry/exit marker
Alert messages contain predefined trading instruction to execute orders via TradeFab's proprietary trading server, which supports Alpaca-Markets, TD Ameritrade, Oanda, CCXT API's, or can be defined by the user
The script renders a performance/status table, which shows the current position status and result of the built-in trading simulation results. The following statistics are shown:
Current position PnL - also background turns green if position is in profit and red if in loss
Average entry price and number of positions
Current percentage distance to the optional stop-loss level
Current Maximum Draw Down
Number of wins and losses and the win/loss ratio per year and overall
Profit and loss amount, paid fees per year and overall
Profit-ratio and Maximum Draw Down per year and overall
Balance and ROI per year and overall
Volume Weighted Moving Average (VWMA)

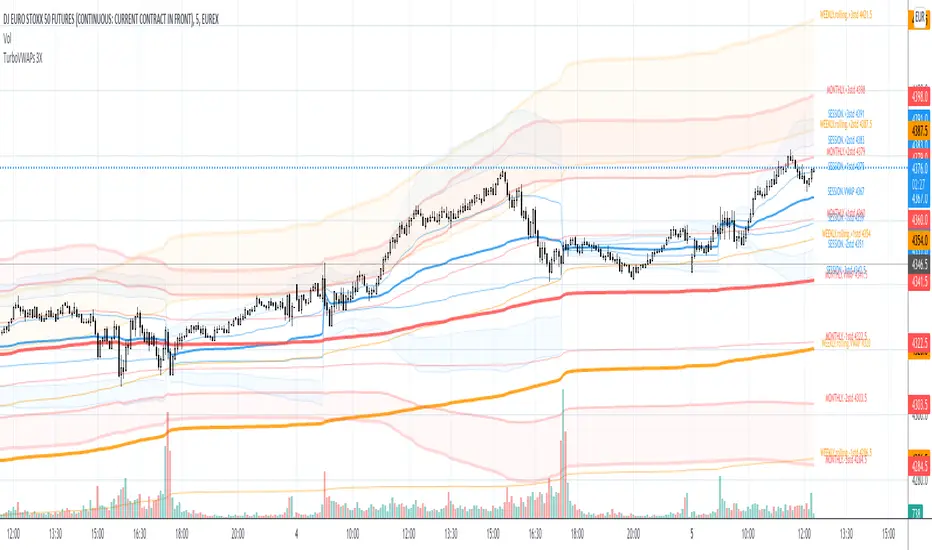
TurboVWAPs 3XAwesome indicator that will plot on your chart up to 3 different VWAPs and optionally up to 3 standard deviations for each one.
Each VWAP can be configured to be a Rolling or Anchored VWAP and to automatically adapt its period depending on the current chart timeframe. For example, you can configure each VWAP to be a rolling 30min VWAP for timeframes below 30M, a session-anchored VWAP between 30M and 1D timeframes, a rolling monthly VWAP for a 1D timeframe and a quarterly VWAP for a weekly timeframe.
You can disable any of the three VWAPs or any of its standard deviations bands.
For session-anchored VWAPs the script will automatically set session times depending on the current futures contract (only for US and EUR futures) if desired. You can disable this feature and manually input session start and end times.
WHTVC Compound VEMAA different take on the original Wick Hunter VWAP indicator aiming to find higher quality trades by allowing trades when the entry condition is met in several different periods.
Designed to be used with the Wick Hunter TradingView Companion bot.
VEMA is a moving average that is both volume weighted exponentially weighted for smooth curves that still react quickly to high volume movements. It is similar to VWMA (or VWAP).
The indicator calculates the VEMA for 6 different periods, and long/short offsets for each period. Alerts are triggered only when all 6 conditions are met.
"m0 Period" and "m5 Period" are the shortest and longest periods used, and 4 other periods are interpolated using these two periods.
"m0 Offset Above (short), %" and "m5 Offset Above (short), %" are the % offsets required to trigger a short entry for each of the periods, and the offsets for the other 4 periods are interpolated from these two offsets.

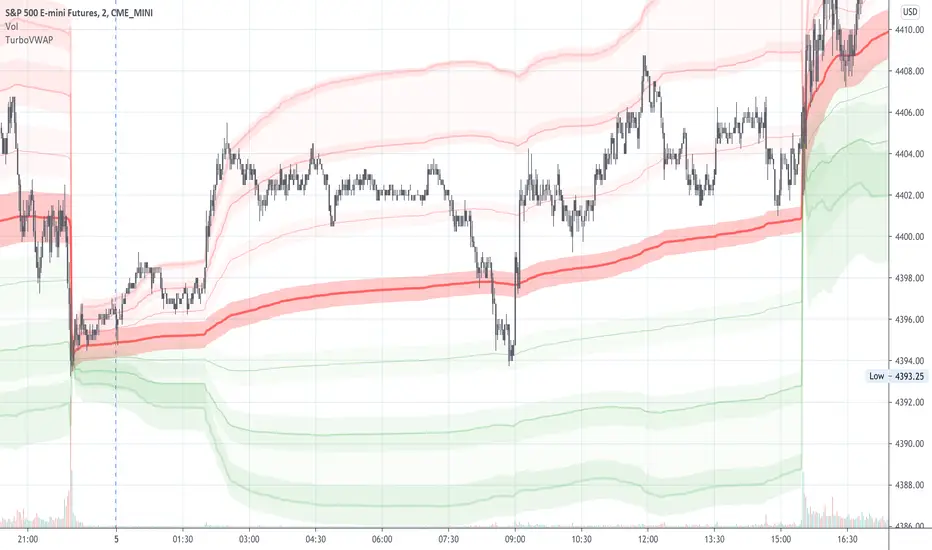
TurboVWAPVWAP indicator based in the built-in one but completely rewritten. Features:
- more standard deviation bands, up to 3.
- added the possibility to not anchor the VWAP but make it a rolling one instead, like a VWMA, being in this case able to specify days, hours or minutes for the rolling VWAP.
- for rolling VWAPs, the indicator doesn't count bars but real days, hours or minutes instead, so regardless of the chart timeframe the indicator will always show the correct values.
- for rolling VWAPs, if you specify x days as the rolling time, the indicator will always count exactly 24 hours from the current time backwards - so, from the same time yesterday or x days ago.
- in rolling VWAPs, although the indicator counts real time elapsed as per your settings and not chart bars, it will automatically skip holidays, so you needn't worry about that.
- for the anchored VWAP, added the possibility to specify custom session times (for example, for ES 0830-1500, instead of Globex, which is the Tradingview default as of today)
- complete customization of all fills and linetypes
For illustration purposes in the attached 1min chart I have:
- a 30min rolling VWAP in BLUE with no standard deviation plots,
- a 1 day rolling VWAP in RED with standard deviations in light red and green (these are the default settings)
- a RTH-session-anchored VWAP in ORANGE with standard deviations in light orange and light blue
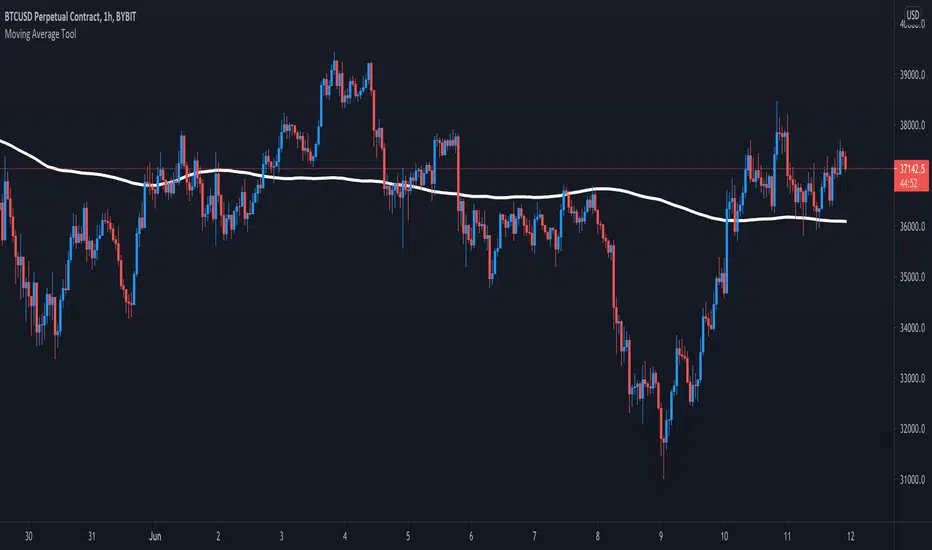
Moving Average ToolThe Moving Average Tool is the only indicator you will ever need to plot MA lines. It comes loaded with 9 different types of moving averages so traders can lay down any line at any length. There is also an option to plot a trigger line. Features: SMA , SMMA, EMA, LSMA, ZLSMA, HULL, LWMA, VWMA and ALMA. Simply pick an average type and enter the desired length.
Wick Hunter TV Companion Dynamic VEMA v0.5 (beta)Wick Hunter TV Companion Dynamic VEMA v0.5 (beta)
For triggering trades on Wick Hunter TV Companion
Indicator is similar to the standard VWAP indicator, however - this adds a level of protection against sudden reversals to not counter-trade retracements. This allows you to trade on a low timeframe while still counter-trend trading the overall trend.
Note that VEMA is a volume weighted EMA (i.e. the moving average is weighted by both volume and recency), and is slightly different to VWMA/VWAP. As recent prices are weighted heavier, a longer period should be used if you want a similar trigger to VWMA/VWAP.

VWMA / SMA / TEMA DifferenceThis Study try to simulate Weakening and Strengthening trends on Bear(down) or Bull(up) movements.
It looks to VWMA - TEMA trend for Bull / Bear trend and looking for SMA - VWMA trend for Weak / Strong trends.
On default settings Line shows the difference between VWMA - TEMA and Columns show difference between SMA - VWMA. Suggesting to use this script for 5m intervals.
This is a personal work of mine. Using this script and taking decisions regarding to this script is only and only under responsibility of the trader!!!

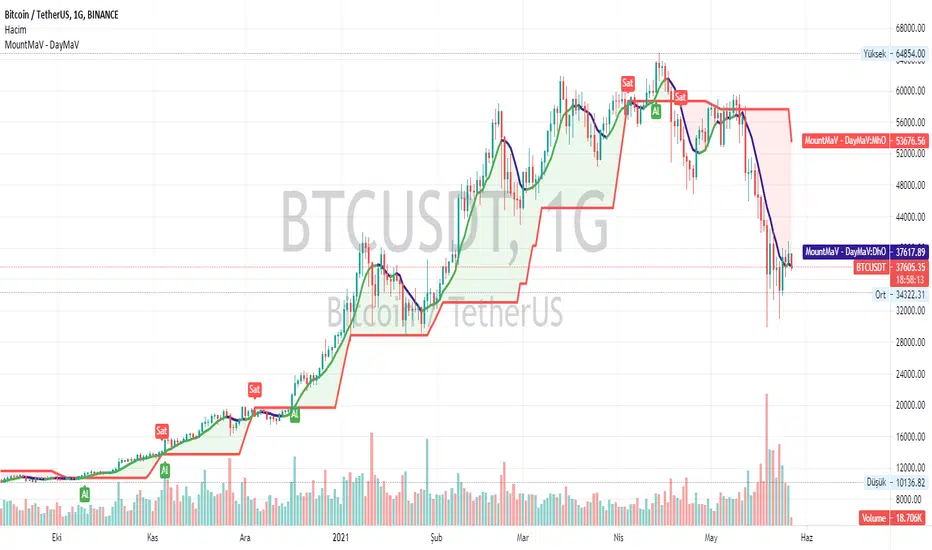
Yusram Mount MaV - Day MaVYüsram Mount HO - Day HO
This indicator shows the comparison between the 7-day fast simple average and the monthly slow average of 5 bars. The red line indicates the monthly green and blue lines the daily average. If the Green-Blue line crosses the red upwards, it is a buy signal and the opposite is a sell signal. As soon as it turns green blue without waiting for the sell signal, a sell signal is created. If you are trading fast, you can consider turning green to blue as an opportunity. In the long run, the red intersection can be interpreted as a Stop point.
I hope it will be useful to everyone.
You can also find the strategy indicator with the same name.
I got the name of this indicator from my daughter's name. The meaning of the name Yüsra means "convenience". I hope this indicator will help you.
Multi VWAPMulti VWAP indicator for Wick Hunter
For when you are running out of indicator slots
Can configure each set for Setting 1/2/3, or for Binance bot 1/Binance bot 2/Bybit bot, etc.
By honeybadger, built on original code by STP Todd (see indicator "Wick Hunter VWAP")

Moving Averages For All Timeframes [LevelUp]Manage moving averages, for every timeframe, from within one indicator.
Features:
■ Intraday - Up to 3 moving averages
■ Daily - Up to 4 moving averages
■ Weekly - Up to 2 moving averages
■ Monthly - Up to 2 moving averages
■ Choose between simple, exponential or volume weighted moving averages (SMA, EMA or VWMA)

Volume weighted Keltner Channels (出来高加重 KeltnerChannel)I tried to make the vertical width asymmetric with devBand by weighting the volume of Keltner Channels.
The conventional Keltner Channels was difficult to adjust when the length was increased, but the adjustment was successful with length 100.
As for how to use it, it is assumed that you will search for profit timing in the trend market.
KeltnerChannelを出来高加重しdevBandで上下幅を非対称にしてみました
従来のKeltnerChannelはlengthを大きくすると調整が困難でしたが、length 100で調整が成功しました
使い方としてはトレンド相場で利確タイミングを探るのを想定しています

Customizable MA RibbonAll credits to @Violent (www.tradingview.com) for making the original code! I just updated it by adding new features and themes!
---------------------------------------------
Lemon's Customizable MA Ribbon:
---------------------------------------------
A series of moving averages of different lengths that create a ribbon-like indicator. Traders can determine trend strength by lookin at the distance between the moving averages and the overall balance of the colored lines. Price movements through the ribbon can also be used to identify trend changes.
------------
FEATURES
------------
MA TYPES: SMA , EMA , WMA, RMA, ALMA, VWMA, HMA
Editable length
Editable start
User defined number of plots to show (between 1 to 32 total plots)
Multiple color theme choices
A color smoothing option.
Thank you and happy trading!
with love,
-Lemon

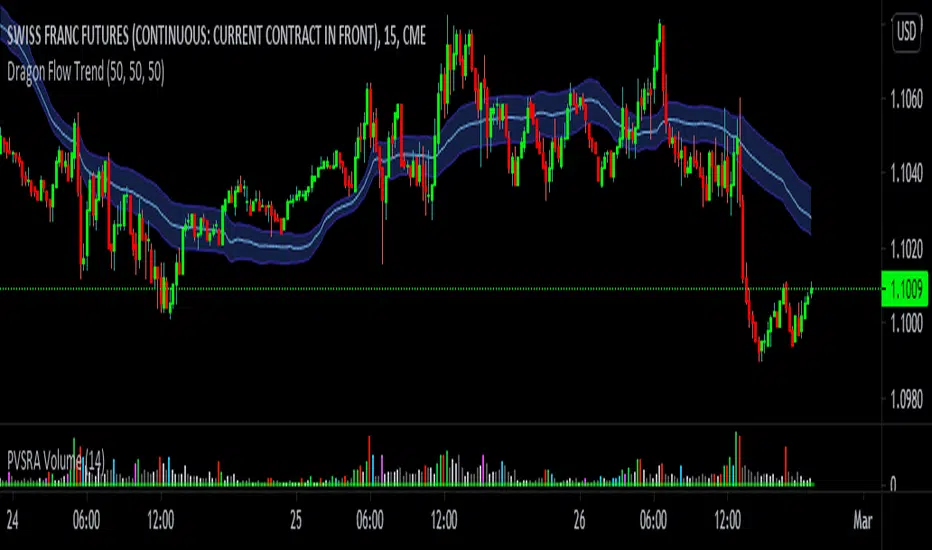
vDragon Flow Trend I will share one of the tools that I use daily with you. Based on PVSRA (a methodology developed by Trade at Home using, price action, volume wyckoff, support / resistance, trends all in one method), it is composed of exponential averages, which I think is plausible, however, it would not be more easy if the main moving average was not made with its own volume?
Having this idea, I created this indicator, but let’s its functions and WHY you don’t waste time and use this indicator once and for all. Firstly, we know that a moving average is used to identify long-term trends, but because it is a price indicator, it takes into account PRICE, that is, being a late indicator, that is, who looks at prices, looks back and not forward, so I decided to use moving averages weighted by volume, to then make this delay in the moving average decrease considerably.
What are the benefits of using vDragon Trend instead of a normal and convenient average.
* The benefit of this indicator is to track the flow of a long-term trend, being similar to the session's VWAP, for example, but as VWAP has a limitation of only being able to show the average price of Market Makers only on the intraday, vDragon can do this, even showing the average price of these players in the long run.
* It is a fast and accurate moving average, depending on the flow entering the market, its curve will be greater than an average that reflects the price.
* The band, can increase or decrease depending on the volatility and the volume that happens.
* It takes from the Maximum to the Minimum for a certain period, just so you don't fall into springs.
* Most moving averages are not efficient on fast graphs like ticks or 1-minute graphs, but vDragon manages to adapt the graphical time, thanks to the volume, which is where we located the performance of Smart Money, remembering, I tested the vDragon within a 15-second chart on the FDAX inside the EUREX bag, and it serves a lot.
* Perhaps the best support or resistance you will find, I can give you an example, if it happens that the price rises with remarkable volume on top of vDragon, it can possibly be characterized as an absorption, sometimes too;
* can be used to identify zones of HFTs or algorithms that work with average prices in liquidity regions, since volume is also liquidity.
* can be used to identify linked accumulations in the accumulation or distribution.
There are several things for you to use vDragon as a strategy, use in a way that fits your strategy or operational.
Remembering, this indicator is my authorship
© Victor Eduardo Meireles
available to tradingview for free, be wary of anyone trying to sell you this indicator.
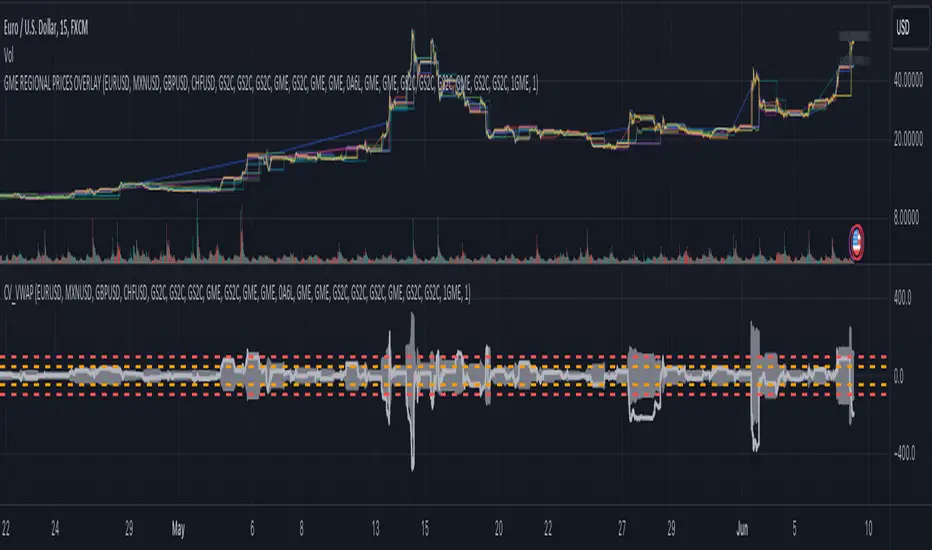
CV_VWAP_GMECoefficient of variance GME ‰
Gray area: Regional price variance of GME in per milles
Light gray thick line: NYSE:GME deviation from global mean
1. Select a chart 24-hour ticker like FX_IDC:USDEUR
2. Select a timescale (5 min, 15 min, ...)
3. Monitor the regional price variance
Exchanges included: NYSE, XETR, BMV, FWB, SWB, BITTREX, FTX
Currency conversion: Forex
Adapted from Detecting the great short squeeze on Volkswagen, Godfrey, K. (2016, February 18).
Ultimate Multi-MACD - Early Warnings + Main TrendThis is a set of a bunch of moving averages. Unique, huh? Right. Awesome. Dope.
So, what's cool about this set, is its usability as not just one MACD, but a pair of MACDs specifically tuned to keep you hard. Some of you probably notice already just looking at the available MAs and lengths - there are some common pairs here. But what do you get when you combine all these common pairs that share bases? You get both short and long term plays out of it. The thing MACDs aren't supposed to do. I imagine it would be hard to make a backtestable/bottable script version of this, because the main thing is you have to use your gut a little bit in determing when to take a short term play and when to keep to the long term plays.
In this set, you get 3 TEMAs, 2 VWMAs, 2 SMAs, and 2 ALMAs. Yeah. That's almost TOO phat. I know. Whatever.
The two purple/pink lines are your 25 VWMA and 50 ALMA slow lines. These will be your main slow lines. They're usually close but move around a decent bit and if you want you could make buys and sales using the Alma crossing above the VWMA as a buy and sell crossing under.
Then you have a THIRD potential slow line on your dark green 50 TEMA. You generally use either the 13 or 21 TEMA crossing up as buy and down as sell. The signal TEMAs are bright green 13 and yellow 21.
Next you have all your Fast signal MAs! A peachy 10 VWMA, 13 green TEMA, 21 yellow TEMA, 10 teal/bright blue ALMA and last but not least, two pale SMAs at 5 and 10. The 5 could even be used as a signal against the 10 if you really want. There are countless options for buy and sell signals. Hide and show the ones that work the best on the chart you're trading on. Different ones will work different times. Why not see which ones are working BEST out of all the best ones, though?
Please leave other MA pairs that you would like added in future versions. If I do make a future version with more pairs I will very likely set default to hide some
Enjoy.
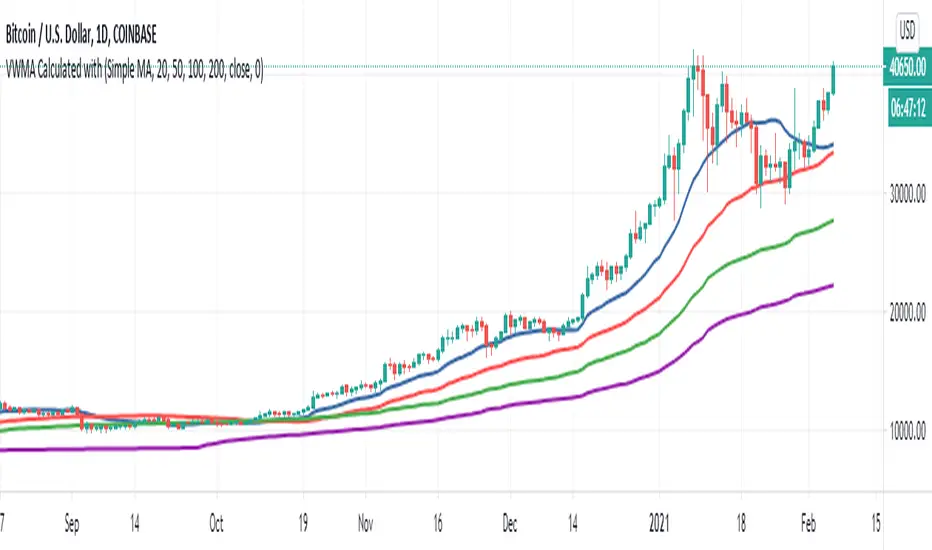
4 VWMAs at the Same Time (Also 6 Type of VWMA) by M.YALCINAccording to Pine Script Help
The VWMA function returns Volume-Weighted Moving Average of x for y bars back. It is the same as: sma(x * volume, y) / sma(volume, y)
In this work VWMA can be calculated with
---Simple Moving Avarage (likewise original one)
---Exponenetial Moving Avarage
---Weighed Moving Avarage
---TEMA Moving Avarage
---DEMA Moving Avarage
---HULL Moving Avarage
And 20,50,100,200 bars are optional ( periods can be changed and each of which are on/off type)
Volume-Supported Linear Regression TrendHello Traders,
Linear Regression gives us some abilities to calculate the trend and if we combine it with volume then we may get very good results. Because if there is no volume support at up/downtrends then the trend may have a reversal soon. we also need to check the trend in different periods. With all this info, I developed Volume-Supported Linear Regression Trend script. The script checks linear regression of price and volume and then calculates trend direction and strength.
You have option to set Source, Short-Term Period and Long-Term Period. you can set them as you wish.
By default:
Close is used as "Source"
Short-Term Period is 20
Long-Term Period is 50
in following screenshot I tried to explain short term trend (for uptrend). Volume supports the trend? any volume pressure on trend? possible reversal? same idea while there is downtrend.
in following screenshot I tried to explain long term trend:
You can also check Positive/Negative Divergences to figure out possible reversals (to automate it, you can use Divergence for Many Indicators v4 , it has ability to check divergences on external indicators)
Enjoy!

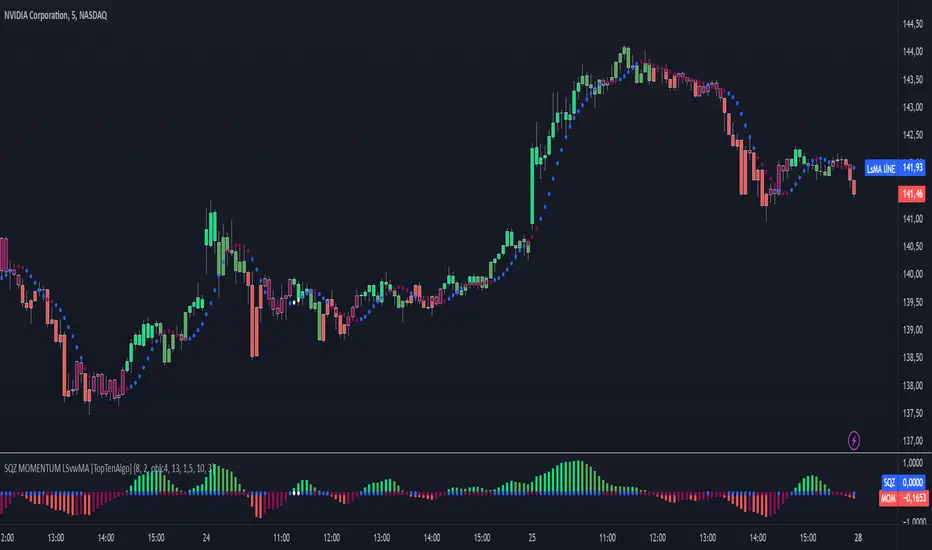
TopTenAlgo 10. SQZMOM_LSvwMA with Bar ColorEN: This Algorithm is a derivative of John Carter's "TTM Squeeze" volatility indicator. Many strategists have taken the indicator on Tradingview with simple moving averages and have looked at the biggest mistake only by dealing with squeeze and exit processes to squeeze. But I used the algorithm to determine where the markets would actually explode. For example, instead of using SMAs , I tested them on the Linear Regression Curve using Volume Weighted Moving Averages and Hull MAs. This gave me the opportunity to develop a more responsive algorithm and identify where the actual explosion would occur. The Gray Circles in the midline show that the market is entering a new jam (in the Bollinger Bands and Keltner Channel). This means low volatility , the market prepares itself for an explosive move (up or down). White Circles mean that it is about to get out of the jam. The Blue Circles, which no one can calculate, now inform that the exit is no longer jammed and that the explosion has taken place.
Mr. Carter recommends that you wait until the first gray after a gray cross and take a position in the momentum direction (for example, if the momentum value is above zero, relax). Exit position when the momentum changes (increase or decrease, this is indicated by a color change). In this algorithm, I tried to achieve good entry points using an additional indicator such as ADX and WaveTrend. To draw the histogram, I used a different method based on Linear Regression . Mr.Carter uses a simple momentum indicator .
In summary, this algorithm is a strict algorithm in which additional 4-5 indicators are blended. Conveniences for Everyone ...
This algorithm is prepared with @Top10Algo ...
TR: Bu Algoritma John Carter'ın "TTM Squeeze" volatilite göstergesinin bir türevidir. Bir çok stratejist Tradingview' de gösterge' yi basit hareketli ortalamalarla ele almış ve en büyük hatayı sadece sıkışma ve sıkışmadan çıkış süreçlerini ele alarak bakmışlardır. Fakat ben algoritmayı piyasaların asıl patlama yapacağı yeri tespit etmek için kullandım. Örneğin SMA' ları kullanmak yerine Hacim Ağırlıklı Hareketli Ortalamaları ve Hull MA' ları kullanarak onları Linerar Regresyon Eğrisinde stress testine tabi tuttum. Buda bana daha duyarlı bir algoritma geliştirmem ve asıl patlamanın olacağı yerleri tespit etmem için fırsat verdi. Orta hattaki Gri Daireler, piyasanın yeni bir sıkışmaya girdiğini gösteriyor ( Bollinger Bantları ve Keltner Kanalı'nda). Bu, düşük volatilite anlamına gelir, piyasa kendisini patlayıcı bir harekete hazırlar (yukarı veya aşağı). Beyaz Daireler ise sıkışmadan çıkmak üzere olduğu anlamına gelir. Hiç kimsenin hesap edemediği Mavi Daireler ise artık sıkışmadan çıkıldığını ve patlamanın gerçekleştiğini haber verir.
Mr.Carter, gri bir çarpı işaretinden sonra ilk griye kadar beklemenizi ve momentum yönünde bir pozisyon almanızı önerir (örneğin, momentum değeri sıfırın üstünde ise, rahat olun). Momentum değiştiğinde pozisyondan çıkın (artırma veya azaltma, bunu o bir renk değişikliği ile belirtilir). Bu algoritmada ben, ADX ve WaveTrend gibi ek bir gösterge kullanarak iyi giriş noktalarıelde etmeye çalıştım. Histogramı çizmek için ise Linear Regresyon tabanlı farklı bir yöntem kullandım. Mr.Carter basit bir momentum göstergesi kullanır.
Özetle bu algoritma ek 4-5 göstergenin harmanlandığı sıkı bir algoritmadır. Herkese Kolaylıklar dilerim...
Bu algoritma @Top10Algo ile beraber hazırlanmıştır... Kodlamadaki katkılarından ve yol göstericiliğinden dolayı teşekkürü bir borç bilirim.
TopTenAlgo 10. SQZMOM_LSvwMA with Bar Color (Not Based Volume)EN: This Algorithm is a derivative of John Carter's "TTM Squeeze" volatility indicator. Many strategists have taken the indicator on Tradingview with simple moving averages and have looked at the biggest mistake only by dealing with squeeze and exit processes to squeeze. But I used the algorithm to determine where the markets would actually explode. For example, instead of using SMAs , I tested them on the Linear Regression Curve using Volume Weighted Moving Averages and Hull MAs. This gave me the opportunity to develop a more responsive algorithm and identify where the actual explosion would occur. The Gray Circles in the midline show that the market is entering a new jam (in the Bollinger Bands and Keltner Channel). This means low volatility , the market prepares itself for an explosive move (up or down). White Circles mean that it is about to get out of the jam. The Blue Circles, which no one can calculate, now inform that the exit is no longer jammed and that the explosion has taken place.
Mr. Carter recommends that you wait until the first gray after a gray cross and take a position in the momentum direction (for example, if the momentum value is above zero, relax). Exit position when the momentum changes (increase or decrease, this is indicated by a color change). In this algorithm, I tried to achieve good entry points using an additional indicator such as ADX and WaveTrend. To draw the histogram, I used a different method based on Linear Regression . Mr.Carter uses a simple momentum indicator .
In summary, this algorithm is a strict algorithm in which additional 4-5 indicators are blended. Conveniences for Everyone ... (For Symbols that cannot be read on the Volume Indicator)
This algorithm is prepared with @Top10Algo ...
TR: Bu Algoritma John Carter'ın "TTM Squeeze" volatilite göstergesinin bir türevidir. Bir çok stratejist Tradingview' de gösterge' yi basit hareketli ortalamalarla ele almış ve en büyük hatayı sadece sıkışma ve sıkışmadan çıkış süreçlerini ele alarak bakmışlardır. Fakat ben algoritmayı piyasaların asıl patlama yapacağı yeri tespit etmek için kullandım. Örneğin SMA' ları kullanmak yerine Hacim Ağırlıklı Hareketli Ortalamaları ve Hull MA' ları kullanarak onları Linerar Regresyon Eğrisinde stress testine tabi tuttum. Buda bana daha duyarlı bir algoritma geliştirmem ve asıl patlamanın olacağı yerleri tespit etmem için fırsat verdi. Orta hattaki Gri Daireler, piyasanın yeni bir sıkışmaya girdiğini gösteriyor ( Bollinger Bantları ve Keltner Kanalı'nda). Bu, düşük volatilite anlamına gelir, piyasa kendisini patlayıcı bir harekete hazırlar (yukarı veya aşağı). Beyaz Daireler ise sıkışmadan çıkmak üzere olduğu anlamına gelir. Hiç kimsenin hesap edemediği Mavi Daireler ise artık sıkışmadan çıkıldığını ve patlamanın gerçekleştiğini haber verir.
Mr.Carter, gri bir çarpı işaretinden sonra ilk griye kadar beklemenizi ve momentum yönünde bir pozisyon almanızı önerir (örneğin, momentum değeri sıfırın üstünde ise, rahat olun). Momentum değiştiğinde pozisyondan çıkın (artırma veya azaltma, bunu o bir renk değişikliği ile belirtilir). Bu algoritmada ben, ADX ve WaveTrend gibi ek bir gösterge kullanarak iyi giriş noktalarıelde etmeye çalıştım. Histogramı çizmek için ise Linear Regresyon tabanlı farklı bir yöntem kullandım. Mr.Carter basit bir momentum göstergesi kullanır.
Özetle bu algoritma ek 4-5 göstergenin harmanlandığı sıkı bir algoritmadır. Herkese Kolaylıklar dilerim... (Hacim Göstergesi okunamayan Semboller için)
Bu algoritma @Top10Algo ile beraber hazırlanmıştır...

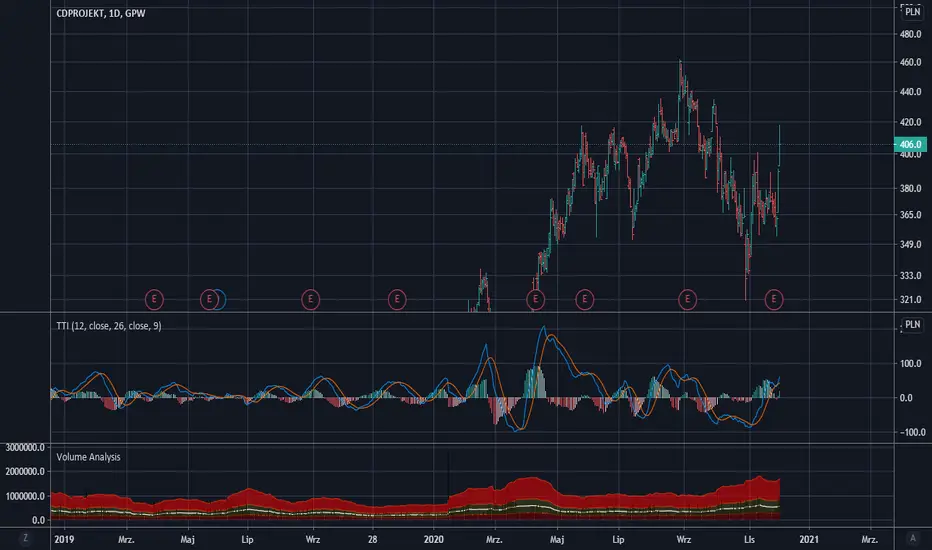
Trend Thrust Indicator - RafkaThis indicator defines the impact of volume on the volume-weighted moving average, emphasizing trends with greater volume.
What determines a security’s value? Price is the agreement to exchange despite the possible disagreement in value. Price is the conviction, emotion, and volition of investors. It is not a constant but is influenced by information, opinions, and emotions over time. Volume represents this degree of conviction and is the embodiment of information and opinions flowing through investor channels. It is the asymmetry between the volume being forced through supply (offers) and demand (bids) that facilitates price change. Quantifying the extent of asymmetry between price trends and the corresponding volume flows is a primary objective of volume analysis. Volume analysis research reveals that volume often leads price but may also be used to confirm the present price trend.
Trend thrust indicator
The trend thrust indicator (TTI), an enhanced version of the volume-weighted moving average convergence/divergence (VW-Macd) indicator, was introduced in Buff Pelz Dormeier's book 'Investing With Volume Analysis'. The TTI uses a volume multiplier in unique ways to exaggerate the impact of volume on volume-weighted moving averages. Like the VW-Macd, the TTI uses volume-weighted moving averages as opposed to exponential moving averages. Volume-weighted averages weigh closing prices proportionally to the volume traded during each time period, so the TTI gives greater emphasis to those price trends with greater volume and less emphasis to time periods with lighter volume. In the February 2001 issue of Stocks & Commodities, I showed that volume-weighted moving averages (Buff averages, or Vwmas) improve responsiveness while increasing reliability of simple moving averages.
Like the Macd and VW-Macd, the TTI calculates a spread by subtracting the short (fast) average from the long (slow) average. This spread combined with a volume multiplier creates the Buff spread
Volume Weighted Bollinger Bands 出来高加重ボリンジャーバンドIt is a volume-weighted index of Bollinger Bands.
The central line is vwma so it's quite responsive
The standard deviation is also volume weighted
Charts without volume are not weighted with volume as 1.
It seems that the usage in trading is the same as the Bollinger band
ボリンジャーバンドを出来高加重した指標です
中央線はvwma出来高加重移動平均なのでかなり反応が良いです
標準偏差も出来高加重してしています
出来高の無いチャートは出来高を1として加重しないようにしています
トレードでの使い方はボリンジャーバンドと同じで良いと思われます

Adaptive VWMAThis is part 9 of 11 in the system named Ninetales/Volt V2 you can find on Tradingview. Add custom values to backtest, it will return the most accurate of them.

Belkhayate Iceberg 2.0This magical script is what Belkhayat Calls Belkhayate Iceberg
he claim its possible to detect icebergs on Tradingview while this is not correct, this is simply a hullma of WMA.
He claim this indicator cost millions but we offer it here for free and open source pour la jeunesse africaine
We will never lie and charge la jeunesse africaine.
Open longs when the hullma is green and open short when its red.
