WillyCycle Oscillator&DoubleMa/ErkOzi/"This code creates a technical analysis indicator used to calculate and visualize the WillyCycle oscillator and double moving average indicators on the price of a financial asset. The functionality can be summarized as follows:
*Calculate the WillyCycle oscillator: The WillyCycle is an oscillator calculated based on the highest and lowest values of an asset. This oscillator is used to measure overbought or oversold conditions of the asset.
*Calculate the double moving average: The double moving average helps determine trends by calculating the short-term and long-term moving averages of asset prices.
*Use the WillyCycle oscillator and double moving average indicators together: The WillyCycle oscillator is combined with the double moving averages to provide a clearer indication of overbought and oversold conditions.
*Visualize the indicator with color coding: The indicator is color-coded to show overbought and oversold conditions. Additionally, line and background colors are changed to make the indicator more readable.
Many parameters can be adjusted on the indicator: The indicator can be customized and modified by the user. For example, the period of the WillyCycle oscillator and the lengths of the double moving averages can be adjusted."
The strategy is based on two indicators - the WillyCycle oscillator and the double moving average. The WillyCycle oscillator measures overbought and oversold conditions of the asset based on its highest and lowest values. The double moving average calculates short-term and long-term moving averages of the asset's price, which can help identify trends.
The WillyCycle oscillator and the double moving average are combined in this strategy to provide a clearer indication of overbought and oversold conditions. When the WillyCycle oscillator indicates that the asset is oversold and the short-term moving average crosses above the long-term moving average, it may signal a buy opportunity. Conversely, when the WillyCycle oscillator indicates that the asset is overbought and the short-term moving average crosses below the long-term moving average, it may signal a sell opportunity.
To make it easier for traders to read and interpret the indicator, color-coding is used to indicate overbought and oversold conditions. The user can also customize the indicator by adjusting parameters such as the period of the WillyCycle oscillator and the lengths of the double moving averages.
*ıt provides successful buy and sell signals for price reversals.
*You can open counter trades in overbought and oversold areas by following the averages.
Willy

Williams % Range overlay mini plotPlots Williams Percent Range over bought/oversold indicator as a small overlay in top right corner.
De-clutter chart when all you're interested in is the real-time W%R to 'give permission' to enter a trade.
i.e. to remove the Williams %R lower pane from the above chart completely.
~~User Inputs~~
~W%R length
~Number of bars to show (default is last 6 bars)
~Plot offset (horizontal position of the plot; can be negative)
~Line color and thickness
~Show/hide plot title
~~tips~~
~in line 26, edit the multiplier (3*), to compress/expand the vertical size of the plot

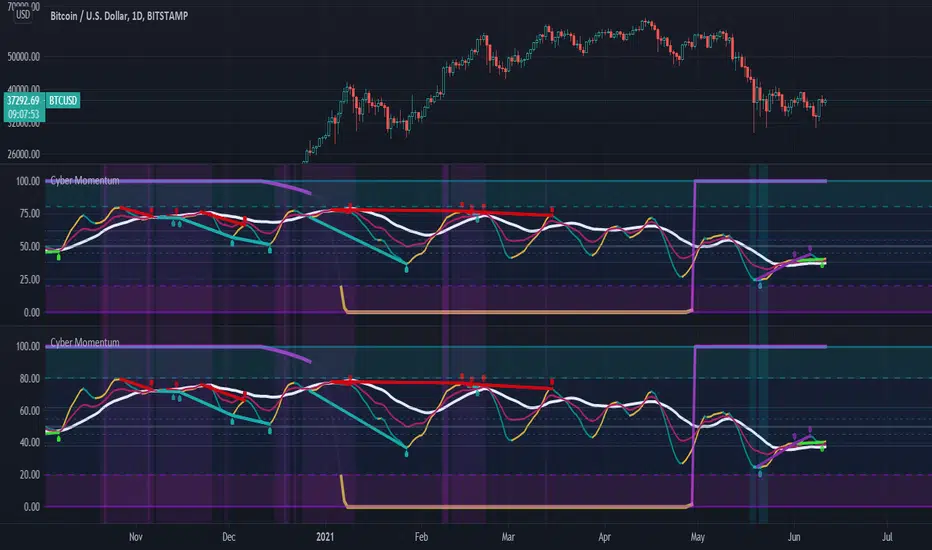
Cyber MomentumThis oscillator is the combination of different settings RSI , RSX , STOCHRSI , MSI ,... in a Stochastic function that can help traders to understand the weakness and strength of momentum in candle sticks in different time frames.
This oscillator organized by three Line , control zone and Divergence Line
1:) Fast Line
2:) Slow Line
3:) Heavy Line
4:) Neutral Zone between Fibo 38.2% & 61.8%
5:) Bullish Control Zone
6:) Bearish Control Zone
7:) Divergence Line
And there are two theories of finding tradable signals behind those parts .
The first and the most simplest theory is the situation that the Fast Line has the possibility to be supported by Slow or Heavy Lines and basically reverse its slope !!
But there are some rules and notes for this theory ... First of all the accuracy and rate of that is variable in three main categories of situation
1:) with or without price action reversal structure like reversal pattern (Head&Shoulder , Quasimodo , .... )
2:) with or without regular divergence
3:) in which control zone ?
So basically the most powerful setup occurs when price action is already in the reversal structure and the potential to have at least one drive of regular divergence exist and also the Fast Line is in the opposite control zone of the current time frame trend .... so obviously if one of those rules will not be satisfied so the signal will be the less value
The second theory is the signals that occur after the reversal, obviously a sign of trend continuation. there are two type of that you can use with this oscillator
The first one happens when price reverses its trend and this oscillator is moving to the neutral zone ... so if at least one drive of hidden divergence exist the neutral zone will have good possibility to reverse the slope of the oscillator obviously this would happen usually after hidden divergence confirmed .
and the second one is basically the first type but after the reversal Subsequently in the outside of the bullish/bearish control zone ... those kinds of signals are NOT the reversal potency signal at all !! they designed for trend continuation... be careful of them and try trade with your old friend trend ! .... also The existence of hidden divergences will be better for trade in this kind of signals .
The idea of this oscillator was inspired by @mrhashem Borjas Tarh Momentum.
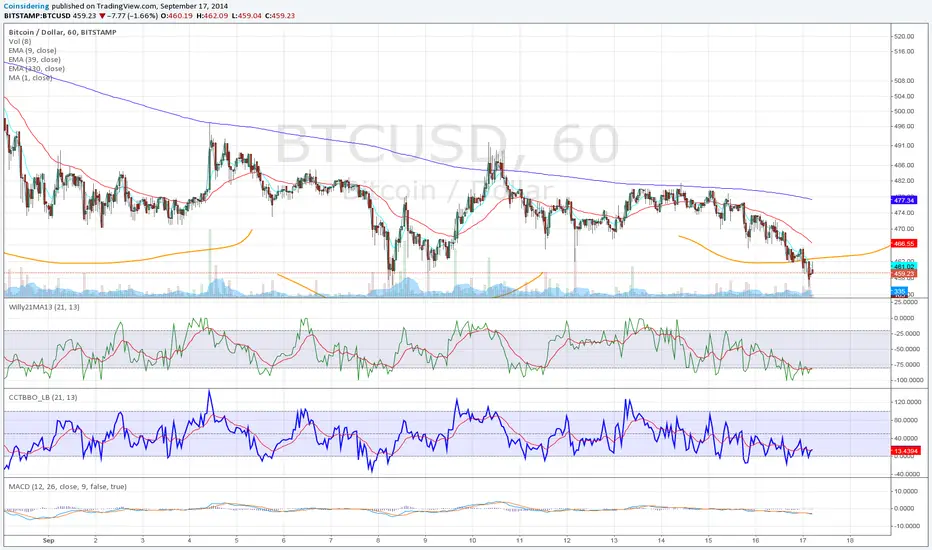
Improved WillyThis is an improved version of Brian Beamish's Willy21Ma13 indicator.
Embedded conditions (overbought / oversold) come with a highlighted background (red for overbought / lime for oversold)
It will also provide buy / sell signals when the indicator moves from embedded to unembedded.
Enjoy

Willams %R with 13 EMA and Divergence FinderWilly 13 EMA
Features:
- Divergence finder
- Extreme conditions highlight

Godmode 4.0.1 [Correlator]First off, a huge thank you to the following people:
@LEGION:
@LazyBear: www.tradingview.com
@xSilas: www.tradingview.com
@Ni6HTH4awK: www.tradingview.com
@sco77m4r7and:
@SNOW_CITY: www.tradingview.com
@oh92: www.tradingview.com
@alexgrover: www.tradingview.com
@cI8DH: www.tradingview.com
@DonovanWall: www.tradingview.com
This is my second iteration of Godmode. This time I allowed the possibility to correlate two benchmarks against one another, thereby giving you twice the signals (once there's a strong correlation between the two, inverse or otherwise). That aside, there are no changes to this indicator that the first iteration doesn't have:
There are still more iterations planned, but if you guys have any ideas or wishes regarding what direction I go, then please let me know.
Want to Learn?
If you'd like the opportunity to learn Pine but you have difficulty finding resources to guide you, take a look at this rudimentary list: docs.google.com
The list will be updated in the future as more people share the resources that have helped, or continue to help, them. Follow me on Twitter to keep up-to-date with the growing list of resources as well as any other scripts I publish.
Suggestions or Questions?
Don't even kinda hesitate to forward them to me. My (metaphorical) door is always open.

Godmode 4.0.0 [Oscillator]First off, a huge thank you to the following people:
LEGION:
LazyBear: www.tradingview.com
xSilas: www.tradingview.com
Ni6HTH4awK: www.tradingview.com
sco77m4r7and:
SNOW_CITY: www.tradingview.com
oh92: www.tradingview.com
alexgrover: www.tradingview.com
cI8DH: www.tradingview.com
DonovanWall: www.tradingview.com
Since I've been on TradingView I've become somewhat enthralled by Godmode and the collective work that goes in to it, so I decided to publish my own iteration, building off the ideas already present. (This is a great way to get familiar with Pine by the way, just in case there are any beginners reading this)
Changes
The first change I made was to allow the user to select whatever tickerid they wanted as a benchmark. If trading XBTUSD on BitMEX for example, the indicator will react to exchange-specific activity, which means it will respond to all the little whipsaws, whipsaws that can be especially present on a futures exchange. By typing CRYPTOCAP:BTC or CRYPTOCAP:TOTAL we endeavor to remove noise. It can also signal earlier. Less noise and less lag. Another idea would be to choose a benchmark that has a strong inverse relationship with the asset you're trading: try CRYPTOCAP:USDT as the benchmark against BTC to see what I mean.
I also added the ability to smooth the plot, yet again removing noise but adding considerable lag.
The linear regression of the wave-trend is calculated in place of the EMA. This is plotted as columns with the midline (50) as the base. This is just calculating the slope of the wave-trend and can signal a weakening trend before a reversal takes place.
Using cI8DH's True RSI script () as inspiration, I added a function for calculating the True TSI in an attempt to remove any bullish bias. Funnily enough, when I tried to do the same with the RSI I had some problems. I'll try to resolve this in the coming weeks.
Made slight changes to the aesthetics. Tried to bring the two main plots alive by making their bold, opaque colors stand off the subtle tones in the background.
To Do List
1. I would like to sort out the issue with the True RSI.
2. When the plots are smoothed, there's an issue with the green 'Caution!' dots appearing in the lower half of the indicator.
3. I'd like to adjust the code so that if the 'Benchmark' box is empty, that it will automatically register the current tickerid as the 'Benchmark'.
If anyone has any suggestions on other fixes or how to apply the fixes mentioned by me, please don't hesitate to reach out to me here or through other media platforms.
Want to Learn?
If you'd like the opportunity to learn Pine but you have difficulty finding resources to guide you, take a look at this rudimentary list: docs.google.com
The list will be updated in the future as more people share the resources that have helped, or continue to help, them. Follow me on Twitter to keep up-to-date with the growing list of resources.
Suggestions or Questions?
Don't even kinda hesitate to forward them to me. My (metaphorical) door is always open.
BITMEX:XBTUSD
CRYPTOCAP:BTC
CRYPTOCAP:TOTAL
CRYPTOCAP:USDT.D


Willams %R with 13 EMA - TRIBased on alexpunct's work.
I simply added a second Willy plot and EMA which allows you to plot Willy and its EMA for a second time frame on the same chart.
The idea is that you will only enter a trade if there is confluence on the two time frames i.e. Willy is stupidly oversold/overbought on both the 4h and 12h or 1h and 4h time frames.
I will be testing this and will adapt

Willams %R with 13 EMA and middle pointWillams %R with 13 EMA and middle point. It also uses the textbook formula instead of the Tradingview one.
Willy Magnus fixed the colors of bg and osc,
mess with the settings if the default doesnt work for you !! have fun

Willy Magnus
williams%R with EMA's tot filter out noise and trend signals. bgcolor to indicate cycles with top/bottom signals.
inspired on the rational flibbr and magnus indicators by magnus tradinggroup and flibbr!
Dav-o meter (public)I decided to make this formerly invite only script public (you can find the invite only version here
If you are part of the invite only you don't need to change scripts. I will push improvements first on the invite only script but in time it will come to this version as well.
I would love to know your ideas and thoughts on how this indicator can be improved, so feel free to give any feedback.
Remember to give it a thumbs up if you like it.
Dav-o meterPseudo code
Example
General info and acknowledgements
Author: maqpie
Date of publishing: 20th of july 2017
This script is based upon Davinci's dav-o meter and his original script, which searches for W's and M's in price, OBV, RSI and/or Willy.
Although the original script is elegant, a W or M has to occur within 5 bars.
However, often what you will see is that a W or M forms over more than 5 bars.
This script tries to remove that limit.
It took me several different approaches to find a good solution. For the most part because of the lack of any real debugging tool in Pine script.
Let me know what you think, because I feel like I need tone down the number of options so it is easier to use.
If you have any questions, or things you would like to see different please contact me at TRI.
Have fun playing and goofing around with it!
How it works
Now, trading is more of an art form than a science and this indicator is no exception.
When talking about M's and W's, it begs the question: what exactly counts as a W or M?
My personal experience is that for a W to count as such, it has to adhere to the following rules:
1. A 'W' has 5 points, A, B, C, D and E E
2. Point A can be any point C /
3. Point B should be lower than A A / \ /
4. Point C should be higher than B \ / D
5. Point D should be lower than C, but higher than B B
6. Point E should be higher than C
1. A 'M' has 5 points, A, B, C, D and E B
2. Point A can be any point / \ D
3. Point B should be higher than A A \ / \
4. Point C should be lower than B C \
5. Point D should be higher than C, but lower than B E
6. Point E should be lower than C
Script input parameters
You can use the following indicators to search for W's or M's:
- price (close)
- OBV
- RSI
- Willy
For each of these indicators you set the following options:
- Use: whether you want to use it
- The maximum width: over how many bars a W / M is allowed to form
- The maximum offset: how many bars back a W / M is allowed to form
- Strict: when not set, rule 5 (see 'How it works') changes: point D no longer has to be above B (for W), and no longer has to be below B (for M)
- Length: length of the indicator, for example a 14 bar RSI
Other options:
- Potential dav-o: show potentials which are like regulars dav-o's, except that rule 6 (see 'How it works') no longer applies.
- Period: you can limit the period for backtesting. Useful to identify under what market conditions the script works best.
Final note: using the potential dav-o in combination with unsetting the 'Strict' rule will make this script all but useless.

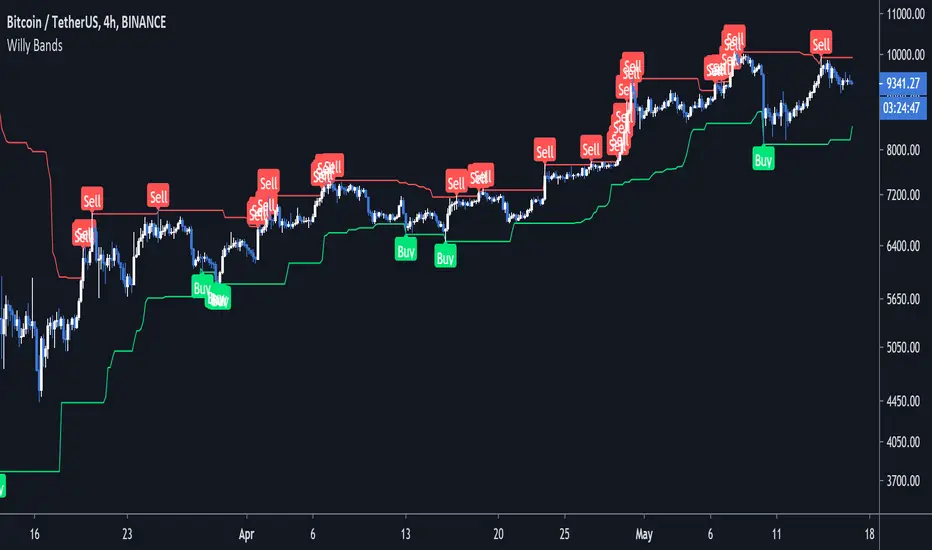
MAGNUS™A CHANGE of background color indicates a trade opportunity :
Cyan background = BUY
Purple background = SELL
The bullish signals seem to be better than the bearish ones.
Based on the "Willy" indicator.
Don't change the parameters unless you fully understand the consequences.
Use with brains and caution :)