One of the best spot of 2022 already here AND commodities updateFirst this idea is attached to another idea I've posted last year, you can find it attached to this one and it explain all the pattern we are working here: the Wyckoff Reaccumulation on Copper (HG1!). So you will find here, my entry, my plan for this trade and the update about the related idea. I will also do an update about the materials market, expectations and targets in form of a thread in comment so don't forget to follow the idea to see it.
So first the update of the related idea. I said for the end of the Wyckoff reaccumulation pattern that I didn't expect a spring, and my poisition about it is always the same. It will be interesting to see if buying volumes continues to grow, but if it's the case it will be the confirmation of that statement. For the moment, I think we are targeting the resistance area and an SOS to see if we could expect the confirmation of the global pattern and so a bullish continuation. I also said that I will aim for an entry on the retest of the creek. Retest happened exactly on the January 6th for the bottom and I didn't find interesting setup to entry on it, so that why I waited a little to find a setup that could satisfied my interest:
We can see on chart two channel, which have already both gave their target (a is the base support, b is the resistance, c is the target). What interest me here is the reaction on the pullback of (b) resistances of each one. Pullback on (2b) is a perfect V-Turn and pullback on (1b) is an accumulation (I would have preferred if it was an U-Turn but we have an akward double bottom in it).
The structure in volume in this accumulation range is good, we have nice exhaust volume before, buying volumes are bigger than selling volumes (that what we want in a range and also when volumes are impacted by sessions to read them, typically on hourly timeframe) and to finish we have a nice breakout with buying volumes so the setup is completed.
Now in term of plan, in a question of regularity in profitability, I'm looking for a ratio of 2:1 which bring us in the resistance area (which is good with our plan of Wyckoff pattern which expect an SOS around here). Exception here, because of the Wyckoff Reaccumulation pattern I don't expect a full target, but only around 40%, then 20% on the first SOS and to finish (if the SOS setup is convincing of course, else it will be out before) last 40% on the 1st objective of the Wyckoff pattern around $5.688 .
It's really important to take multiple profit when you are on long term timeframe. The more you are on market the more there is risk to see change in patterns, in dynamic macroeconomic ... And so, less your probability of success is high. So take profit, fix targets/price and don't be afraid to take profit at the top, don't wait market to fall back.
Else, secure your earnings, you can't lose money on winning trade! That why for my trades, I'm mostly breakeven at 1:1 ratio.
Another time, I invite you to check the first idea I posted, attached to this one.
Now I think we made the turn for copper, if you have questions be free to ask me in comments.
I will now update the idea with other commodities perspectives. I will comment only those where I have identify patterns in my strategy with area to target for entry.
I think metals assets will be one of the key of 2022, most of charts are well oriented to see bullish progression, macro-economically it is also oriented in that way.
COPPERZ2025 trade ideas

Coppe (Comex) - Weekly UpdateComex Copper - Weekly
Bottom Line : Adjusted wave count: Comex Copper may complete a flat correction by rising to a new high.
Comex Copper may be rising in wave (C) of a flat correction developing as wave X (circled) of an ongoing bear market from 2011.

Leading Indicators messyWith the current global situation where there are day by day developments, the Leading Indicator panel offers similar dichotomy...
The JNK ETF is heading further down -> Bearish for equities.
The IWM ETF is likely to push down in a somewhat limited fashion -> Bearish for equities
The DJT ETF appears to be bouncing up -> Bullish for equities
The VALUG looking for more downside -> Bearish for equities
The TIPS ETF is spiking after a gap up, bullish for TIPS -> Inflation is exploding! Ususally bullish for equities, but in this instance, not likely.
The TLT ETF is bottom feeding, and there is a MACD bullish divergence -> this suggests that the fear is not yet great enough for a flight to safety. Not yet.
The VIX just broke out of a trend line and is pushing towards 45.
The HG1! copper futures suggest an anomalous accumulation of copper, maybe forerunning the equities market upwards, but otherwise, if a general reflection of commodities rocketing in prices.
Overall, Bearish bias on equities, with the chance of a quick rebound soon... but not before a spike down first.
Totally tied to the Russian Ukraine events for now.

breakout on copper futures with the latest commodity bull market, copper prices soared the last few days after consolidating since may 21. the breakout of this bullish triangle signifies more bullish pressure coming in the next few weeks. As traders our job is to buy low in the BUY ZONE..so we have to allow the market to pullback and test the backside of the broken trendline then we can look for buying opportunities

COPPER new highs Copper is reaching new all time highs faster than we can blink.
The price of everything will go up, triggering a global recession.
NO FED can control this

/HG 15minNice bull flag here for copper. If we get a breakout here copper stocks like FCX can move nice tomorrow

Mar 2, 22 Copper on a tear-Buy or Sell?What is going on with Copper? Price is skyrocketing yesterday and today but why?
We are coming into a world recession sometime this year, inflation is the highest its been in 40 years, interest rates are going up everywhere, all signs that copper price is 'supposed' to be going down.
Any ideas?
Heiko

Copper: Long to mid-term overviewCopper is still building a triangle for wave (4) of of V.
We expect rising to around 6.80 level for wave (5) of of V.
Alternate, declining for current level and break the lower boundary of the triangle as a first move of downside of wave

Copper Futures : H1 Short (Price Action : LH + LL)Copper Futures HGU2021 H1 chart shows series of LOWER HIGHS + LOWER LOWS from July 26 2021. Contrarary to fundamentals (strike in copper mine would create shortage in supply, etc) the technical analysis shows there is a room for some more down side towards 4.285. The downtrend would end if the price trades above previous HIGHER HIGH.

copper futures companythe market just realise nice break out with buyers emergement so buy it we can expect a pull back

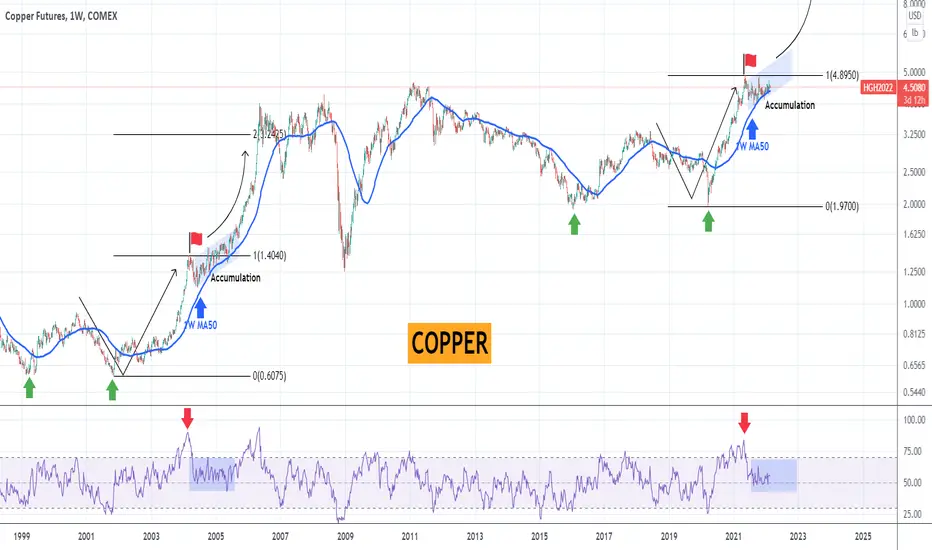
COPPER is one of the best investments on a 2 year basisInvestors looking for value long-term better have a look at Copper, which has been consolidating ever since its May 2021 All Time High (ATH). The 1W MA50 (blue trend-line) has been supporting all this time, indicating that the market has found a new long-term demand zone where buyers step in.
The last time a similar demand level on the 1W MA50 took place was half-way through Copper's historic parabolic rally of the 2000s. In particular, in February 2004, the market made a similar High (red flag), then turned sideways into a +1 year accumulation period, when again the 1W MA50 was supporting. Eventually that demand level initiated the last and more aggressive part of this rally during 2005-2006. The 1W RSI sequences between the accumulation phases of today and 2004 are also identical.
The 2006 rally peaked a little higher than the 2.0 Fibonacci extension. That should be a solid benchmark for long-term investors looking for value.
--------------------------------------------------------------------------------------------------------
** Please support this idea with your likes and comments, it is the best way to keep it relevant and support me. **
--------------------------------------------------------------------------------------------------------
Trade idea #Copper #HG1! longEntry at current level 4.56
Stop 4.30
First Target (33% of the position) 4.80

Copper - a barometer for stock market performance There are more ways than you and I can think of in analysing the stock market performance. From very complex charting tools to using stars alignment, for as long as stock market exists, people are obsessed with coming with tools to predict the market.
Copper, for a long time has been touted as a good stock market barometer (if you believe in it).
Using the weekly chart, we can see that copper price has hit a resistance level , back to where it was in 2011 (11 years ago). Is it any coincidence we are seeing some correction in the stock market now ?
I leave that judgement to you !

HG1! (COPPER) STILL IN A TRIANGLEHG1! (COPPER) is still making a triangle on the primary degree 4th wave. We will finish the triangle around 61.8% or 78.6% of Fibonacci. The 78.6% area is also a trend-line support zone. With the high chance, we will rebound from the trend-line area. Wave E can take further time to develop.
DISCLOSURE - Please be informed that the information I provide is not a trading recommendation or investment advice. All of my work is for educational purposes only. All labeling and wave count have been done by me manually and I will keep changing according to the LIVE MARKET PRICE ACTION. So don't bias, hope on my trade plans. Try to learn Elliott Wave or other strategies and make your own strategy. Following is not that much easy. I am not responsible for any losses if u took the trade according to my trade plans.
#HG #HG1! #COPPER

copper is about to break the high ...... hold for target 810....copper is about to break out ... hold for bullish move . next good move

Feb 10, 22 Copper Sell Almost TimeDr. Copper is almost ready to embark on a SELL of epic proportions - at least that's what the MACD Indicator is telling us. When the blue line crosses over the red line heading down? Oh boy!!
Notice that you are looking at the Monthly Chart. If you check on the web for monthly charts for Copper re MACD history, you will find that when this 'DEATH CROSS' occurs, there is usually a recession (which we will be in sometime over the next several months), a stock meltdown (which we will be in sometime over the next several months), and more or less 'the world is ending' feeling (which we will be in sometime over the next several months).
When you look at the MACD the red and blue line are very very close, and with todays sell off it is getting even closer. I'm not saying that this is a trade that's going to happen next week, but definately sometime over the next few months - just something I'm keeping an eye on to make a lot of money. I hope you do too :-)
HEIKO


Copper MCX chart indicates strong bull run about to startCopper is managed to bounce from 750 level and in last trading session give strong recover from bottom.
On daily time frame made a bullish pin candle near resistance zone.
Breaking above 760 will trigger strong buying and target will be 770 to 775.

Copper Commodity USA Sun Storm Investment Trading Desk & NexGen Wealth Management Service Present's: SSITD & NexGen Portfolio of the Week Series
Focus: Worldwide
By Sun Storm Investment Research & NexGen Wealth Management Service
A Profit & Solutions Strategy & Research
Trading | Investment | Stocks | ETF | Mutual Funds | Crypto | Bonds | Options | Dividend | Futures |
USA | Canada | UK | Germany | France | Italy | Rest of Europe | Mexico | India
Disclaimer: Sun Storm Investment and NexGen are not registered financial advisors, so please do your own research before trading & investing anything. This is information is for only research purposes not for actual trading & investing decision.
#debadipb #profitsolutions

Copper looks ready, maybevery possible. I think the Monthly chart is more pertinent . Above 4.89 all time high and clear skies

Copper looks interesting for next few days.Will be watching copper for next few days price action for a right trade....

Hg Copper Yeah, its overbought I know but that rsi hold above 50% is a sign.
and its happened before.
