Trade ideas

DAX | Accumulation Phase Validating Countertrend BreakTechnical Overview
Weekly:
The broader trend remains bullish, maintaining higher-high and higher-low structure. Price action continues to trade above the weekly pivot zone, confirming medium-term trend alignment to the upside.
Daily:
A valid countertrend structure is present. The last daily breakdown has been broken by a clean impulsive wave that also pierced the countertrend line, suggesting early transition from correction toward potential expansion.
Bias remains constructive as long as price holds above the lower daily pivot at 23,990 .
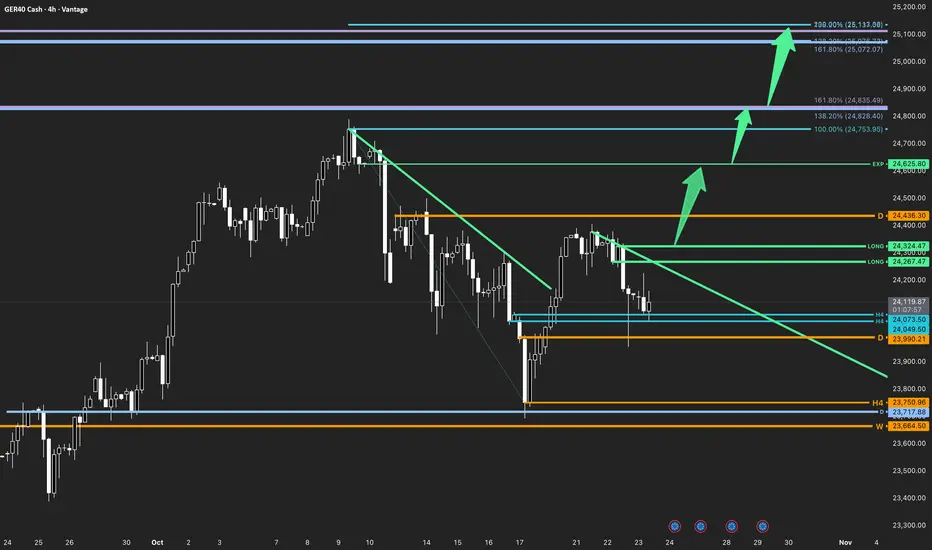
H4:
The structure shows price consolidating beneath the broken countertrend line, forming a short-term base around the 24,050–24,100 zone. A sustained close above 24,324 would confirm trigger alignment and open path toward 24,625 (EXP) and 24,850–25,100 Fibonacci extensions.
Trade Structure & Levels
Bias: Long above 23,990
Trigger Zone: 24,324–24,625
Invalidation: Daily close below 23,990 or H4 close below 23,750
Path → 24,625 → 24,850 → 25,100
Phase: Accumulation (pre-expansion)
Risk & Event Context
The GER40 remains in a technical accumulation phase within a bullish weekly structure. Volatility is moderate, and continuation depends on reclaiming upper trigger levels.
Conclusion
As long as the structure holds above the active daily and H4 pivots, the setup favors an eventual continuation toward expansion.
DAX/GER40, technical analysis 1DHello traders,
We bring you another important technical analysis on the DAX index.
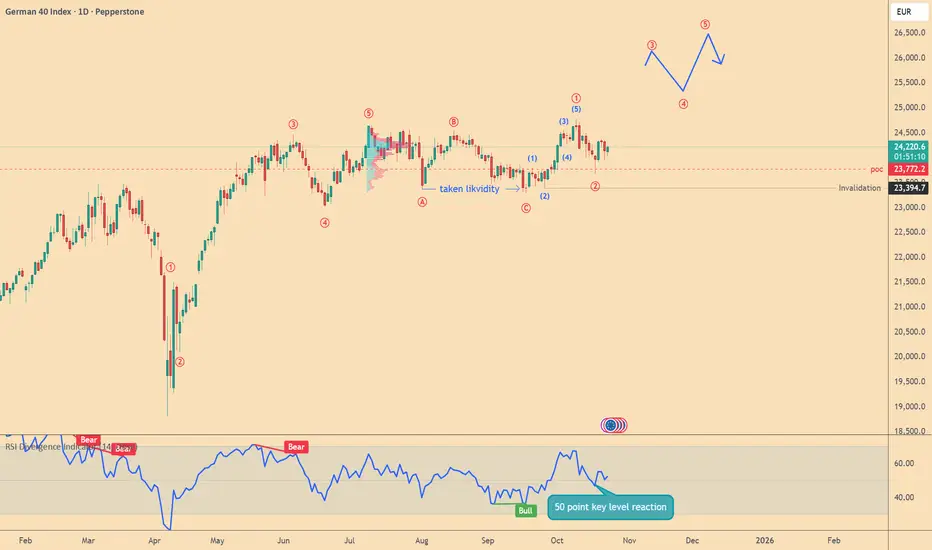
We can see that according to Elliott Wave theory we have completed corrective ABC structure, also taken liquidity and started the bullish 12345 structure in smaller timeframe as u can see on the chart.
So the next outlook is that the value of the DAX index will increase.
But be careful!
It is necessary to respect the invalidation level in this case.
We also have to take into account the war in Ukraine, all of President Trump's statements, interest rates, and other stimuli that can change the market instantly!
WavePulse
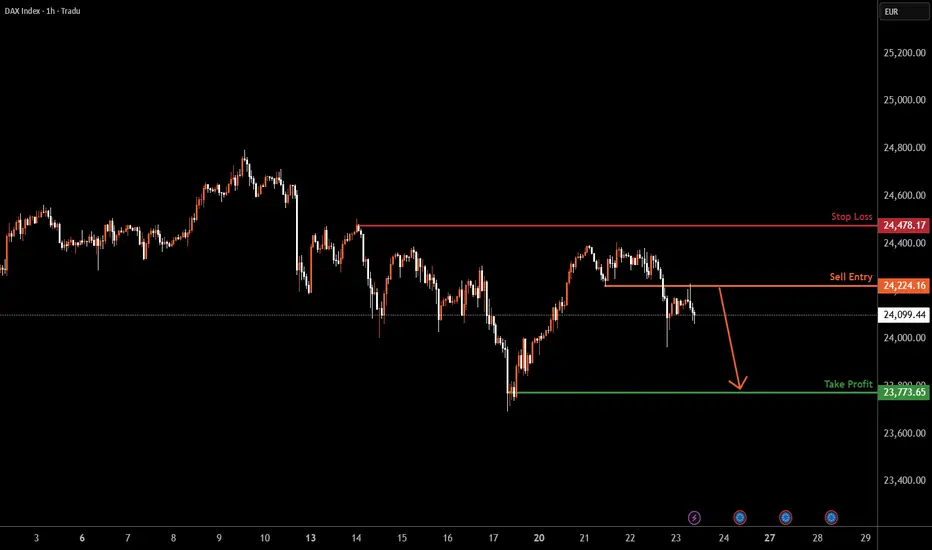
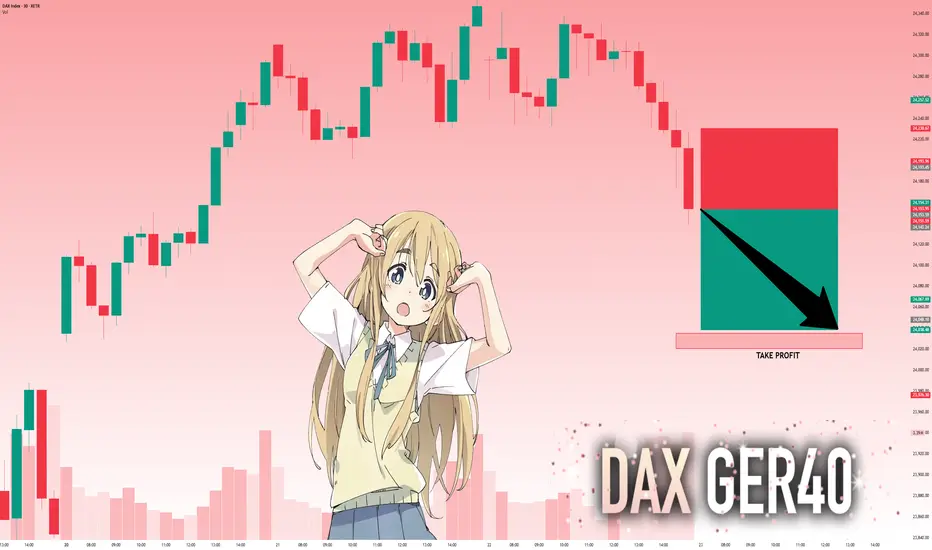
GER30 H1 | Bearish Drop-Off FormationGER30 has rejected the sell entry of 24,224.16, which is a pullback resistance and could potentially drop from this level to the downside.
Stop loss is at 24,478.17, which is a pullback resistance.
Take profit is at 23,773.65, which is a swing low support.
Stratos Markets Limited (tradu.com):
CFDs are complex instruments and come with a high risk of losing money rapidly due to leverage. 68% of retail investor accounts lose money when trading CFDs with this provider. You should consider whether you understand how CFDs work and whether you can afford to take the high risk of losing your money.
Stratos Europe Ltd (tradu.com ):
CFDs are complex instruments and come with a high risk of losing money rapidly due to leverage. 70% of retail investor accounts lose money when trading CFDs with this provider. You should consider whether you understand how CFDs work and whether you can afford to take the high risk of losing your money.
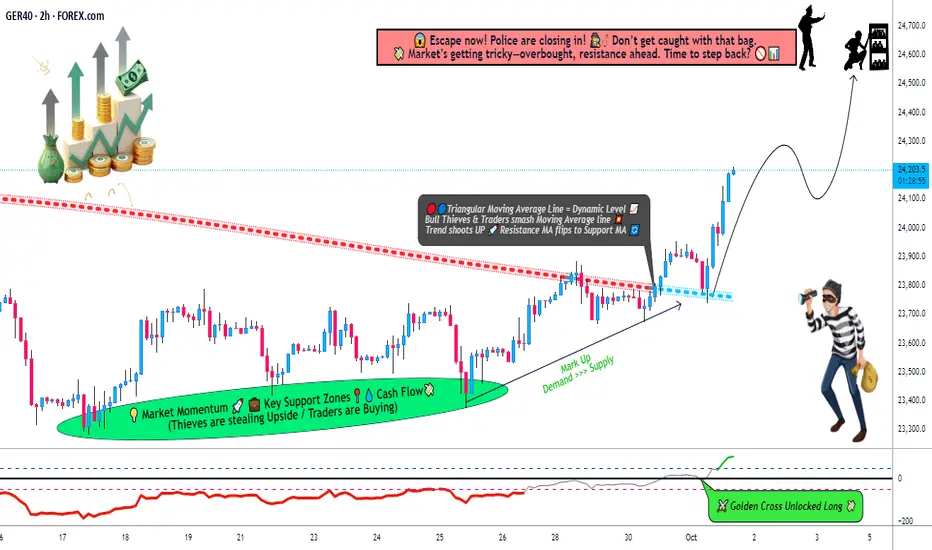
"DAX 40 Strategy Map — Multi-Layer Entries & Thief Twist"📊 GERMANY 40 Index Market Wealth Strategy Map (Swing/Day Trade)
Ladies & Gentlemen (aka Thief OG’s 😎), here’s my fresh DAX roadmap.
🔑 Plan (Bullish Bias):
Triangular Moving Average 382 broken upwards ✅
CCI Oscillator flashing a Golden Cross ⚡
Both signals together = bullish confirmation.
🎯 Entry (Thief Layer Strategy):
This is not a single-entry plan. Instead, I’m layering multiple buy-limit levels:
23800, 23900, 24000, 24100
(You can increase layers if market structure supports it.)
This layering method (Thief Strategy) spreads risk and improves average entry.
🛡️ Stop Loss (Thief Guardrail):
My SL marker: 23700
⚠️ Note: This is my personal map, not financial advice. You can adjust according to your own risk appetite.
💰 Target (Take Profit Zone):
Primary Exit: 24600
Strong barricade & resistance near 24700 🚨 (watch out for overbought trap).
Idea: escape with profits before the police (market sellers) block the road!
📌 Correlations & Watchlist:
FOREXCOM:GER40 (Germany 40 Index)
XETR:DAX (cash market ticker)
CAPITALCOM:DE40 (futures contracts)
ICMARKETS:STOXX50 (Euro Stoxx 50 correlation)
SP:SPX / NASDAQ:NDX (U.S indices often influence DAX intraday flow)
FX:EURUSD (currency correlation can impact European equities via euro strength/weakness)
Keeping an eye on global risk sentiment is essential — strong U.S. momentum often supports DAX upside.
✨ “If you find value in my analysis, a 👍 and 🚀 boost is much appreciated — it helps me share more setups with the community!”
📜 Disclaimer:
This is a Thief-style trading strategy — designed for fun, educational purposes, and market mapping only. This is not financial advice. Trade at your own risk.
#GER40 #DAX #Germany40 #SwingTrade #DayTrading #IndexTrading #TechnicalAnalysis #ThiefStrategy #TradingView
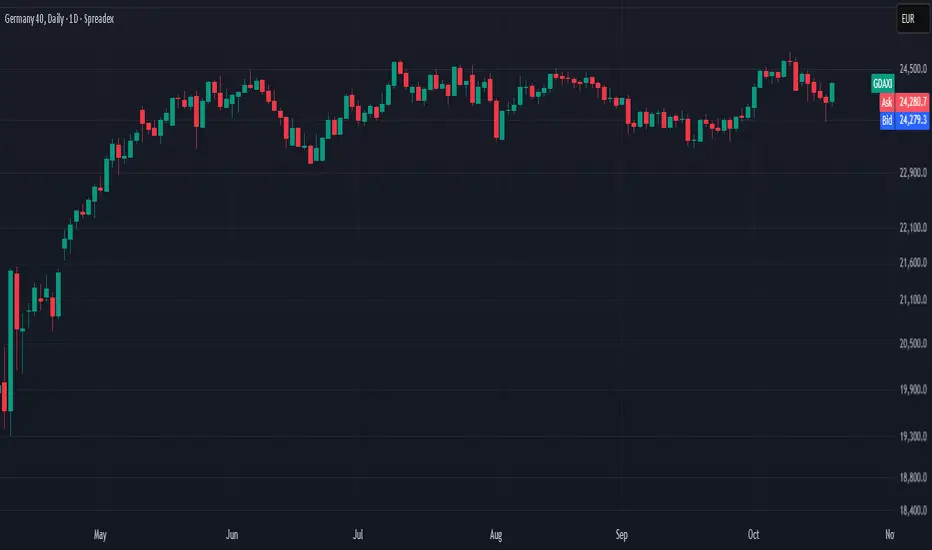
Technical Analysis WeeklyGermany 40 has re-entered its trading range after a failed bullish breakout. Price trades at 24,057, slightly below its VWAP of 24,206. RSI at 48.4 suggests subdued momentum. Support lies at 23,683, while resistance is 24,729.
UK 100 maintains a bullish trend but is undergoing a corrective phase. Price has pulled back to 9,394, below its VWAP of 9,403. The RSI at 51.4 indicates weak bullish momentum. Support is at 9,287, and resistance stands at 9,558.
Wall Street remains in a bullish trend but continues to correct lower, currently at 46,303, on top of its VWAP. RSI at 52.6 shows a neutral stance. Support lies at 45,630, and resistance is estimated at 46,911.
Brent Crude is turning bearish within its broader range. Price has fallen to 6,094, below the VWAP of 6,422. RSI at 30.9 indicates strongly bearish momentum. Support sits at 5,983, while resistance is at 6,860.
Gold extends its bullish run in a strong impulsive phase, trading at 4,259, significantly above the VWAP of 4,015 but down a bit from all time highs. The RSI at 75.5 signals less overbought conditions. Support is way down at 3,677, and resistance is at 4,353.
EUR/USD holds its trading range, now trading at 1.1666, right next to its VWAP. RSI at 49.0 signals neutral momentum. Support is at 1.1556, and resistance is at 1.1782.
GBP/USD stays in a bullish trend but is correcting sideways, trading at 1.3423, slightly above the VWAP of 1.3400. RSI at 49.8 shows consolidation. Support is at 1.3299, with resistance at 1.3514.
USD/JPY is in a pullback following its bullish range-breakout, currently at 150.67, just above its VWAP of 150.30. The RSI at 54.2 reflects moderate bullish momentum. Support lies at 146.60, and resistance is at 154.01.
DAX key trading level at 23970 The DAX remains in a bullish trend, with recent price action indicating a potential overbought pullback within the broader uptrend.
Support Zone: 23970 – a key level from previous consolidation. Price is currently testing or approaching this level.
A bullish rebound from 23970 would confirm ongoing upside momentum, with potential targets at:
24490 – initial resistance
24580 – psychological and structural level
24770 – extended resistance on the longer-term chart
Bearish Scenario:
A confirmed break and daily close below 23970 would weaken the bullish outlook and suggest deeper downside risk toward:
23870 – minor support
23770 – stronger support and potential demand zone
Outlook:
Bullish bias remains intact while the Dax40 holds above 23970. A sustained break below this level could shift momentum to the downside in the short term.
This communication is for informational purposes only and should not be viewed as any form of recommendation as to a particular course of action or as investment advice. It is not intended as an offer or solicitation for the purchase or sale of any financial instrument or as an official confirmation of any transaction. Opinions, estimates and assumptions expressed herein are made as of the date of this communication and are subject to change without notice. This communication has been prepared based upon information, including market prices, data and other information, believed to be reliable; however, Trade Nation does not warrant its completeness or accuracy. All market prices and market data contained in or attached to this communication are indicative and subject to change without notice.

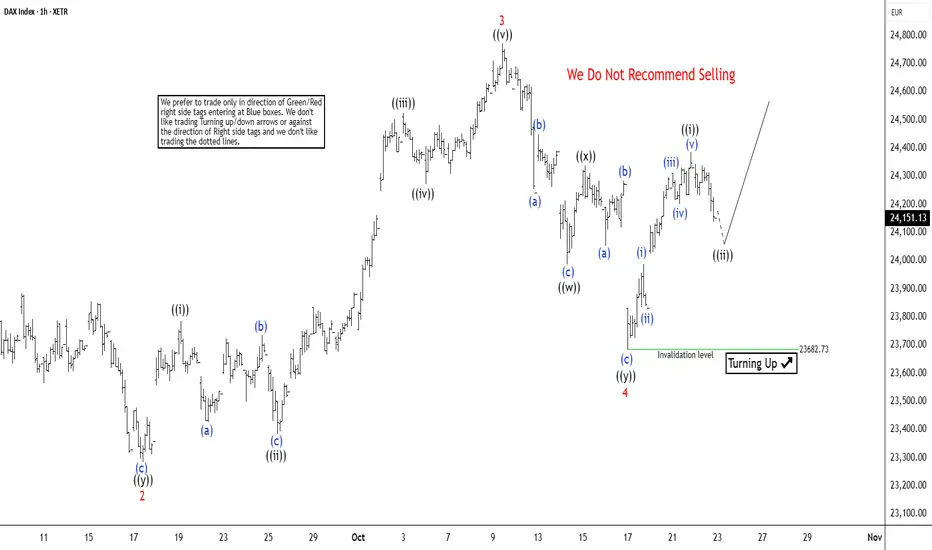
DAX Extends Gains in Five Wave Diagonal FormationThe short-term Elliott Wave analysis for the DAX Index indicates it is nearing the completion of a cycle from its April 2025 low, unfolding as wave (5). From the June 19 low, wave (5) has developed as an ending diagonal Elliott Wave structure. The rally from this low saw wave 1 peak at 24639.1, followed by a wave 2 pullback concluding at 23284.67. The Index then advanced in wave 3, structured as a five-wave impulse. From the wave 2 low, wave ((i)) reached 23785.24, with a corrective dip in wave ((ii)) at 23383.84. The subsequent wave ((iii)) climbed to 24524.11, followed by a wave ((iv)) retracement to 24269.94. The final wave ((v)) culminated at 24771.34, completing wave 3.
Wave 4 unfolded as a double zigzag structure. From the wave 3 high, wave ((w)) declined to 23986.93, wave ((x)) rebounded to 24339.27, and wave ((y)) fell to 23682.73, finalizing wave 4. The Index has since turned upward in wave 5. From the wave 4 low, wave ((i)) reached 24384.24. A wave ((ii)) pullback is expected to correct the cycle from the October 17 low before the Index resumes its ascent. As long as the pivot at 23682.73 holds, pullbacks should attract buyers in a 3, 7, or 11 swing, supporting further upside in the near term.
DAX: Move Down Expected! Short!
My dear friends,
Today we will analyse DAX together☺️
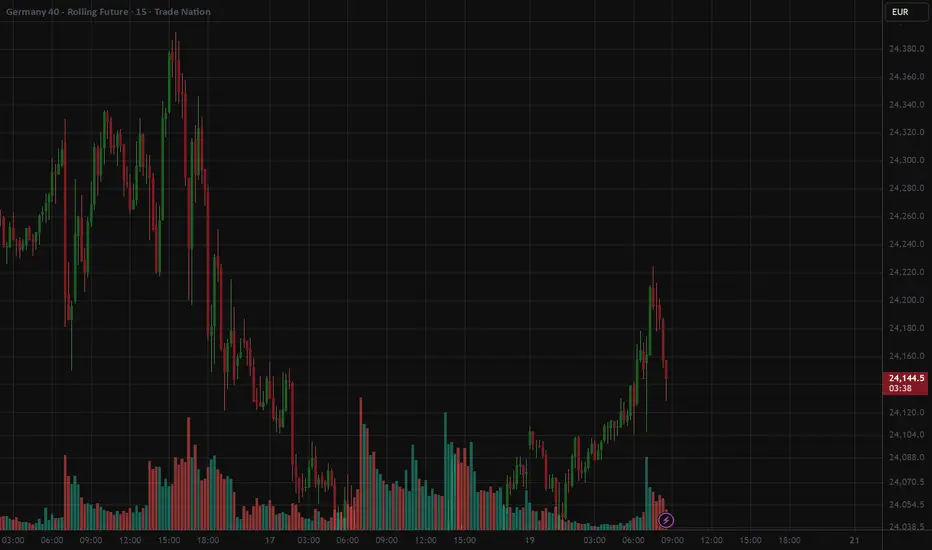
The recent price action suggests a shift in mid-term momentum. A break below the current local range around 24,153.59 will confirm the new direction downwards with the target being the next key level of 24,035.02 and a reconvened placement of a stop-loss beyond the range.
❤️Sending you lots of Love and Hugs❤️
Buy DAX 4H on tradeback in bull movementBuying with the trend below previous low of close. Fundameltally Buying bull move on retracement with Risk Reward 1:4.
will move stop to break even if 100 pts of profit is reached.

#DAX, next leg downPreviously, I called for a short of DAX for a move down to 23700/23800 (). We got 450 points down, hit my 23700 level and rebounded 700 points, to perfection.
Market seemed weak now; could see another leg down, back to 23680 and possibly to 23200.

GER40 waiting good price for long
introday long for ger40. Now it's too expensive to buy. I''l wait it lower


Buying DAX 4 hr time frame in bullish movement on retracement upwards support line suggests that the bull move in DAX may still be valid. Looking for old highs for a high risk reward trade with the market trend.
Long DaxPossible long entries on the Dax.
Fundamentals & correlations:
- Positive commentary from Trump surrounding the US China tariff deal has seen a shift in risk sentiment today with precious metals down and equities rebounding
- US earnings have shown positivity this week with banking sector concerns fading
- EUROSTOXX, NL25 and US indices have broken previous bearish structure and are back towards previous highs, paving the way for the Dax
- German GDP did turn lower in Q2 to -0.3% but is forecasted to rebound to 0.1% amid lower interest rates and stable inflation
Technical setup
- Price has broken previous downtrend channel and lower high
- Mondays volume profile printed a POC higher than the previous showing a shift in price acceptance
- Tuesday price opened higher above Monday VA again support the shift in price acceptance
- Price has retraced back to Mondays VAH and low volume cave as support
- Further confirmation could be taken on the break above the current high and retracment back to a fib 50-61.8% level
- If price pulls back further from current level and fib retracement could be taken from 1hr low to provide further support areas
- Eurozone PMI's and US inflation data due to release on Friday so in trade management would be needed ahead of these

German DAX Analysis — 22 Oct 2025Bias: Bullish
The bias remains clearly bullish. Last week, price delivered into the discount of the weekly Buyside Imbalance Sellside Inefficiency (BISI/FVG), and since then, the 4H structure has shifted bullish.
For today, price has two possible scenarios:
1️⃣ As we are already trading within a 4H discount FVG, we could see continuation to the upside after a sweep of Asia’s session lows.
2️⃣ Alternatively, price may take a deeper retracement into the Daily FVG formed today before delivering higher.
Either way, maintaining a bullish bias while waiting for confirmation at key levels would be ideal.
This is my personal outlook, not financial advice.

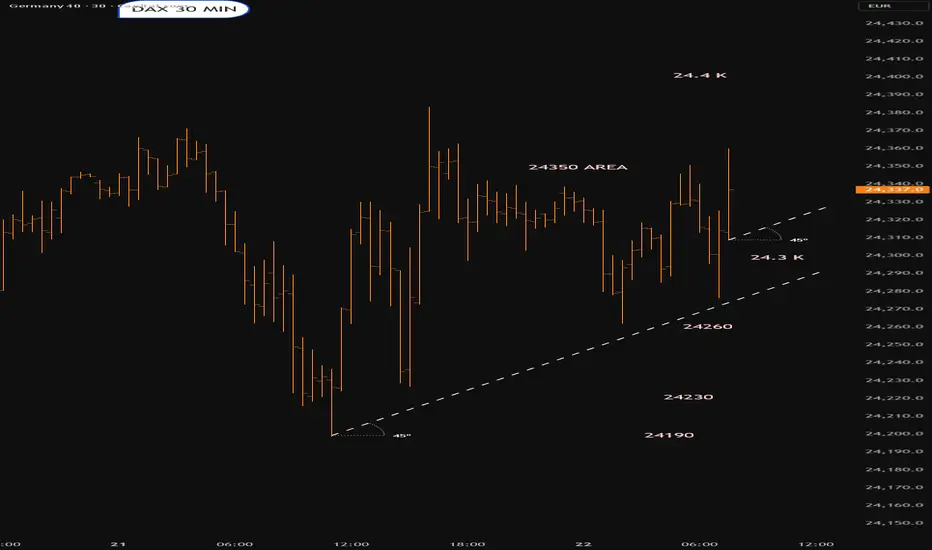
Dax into the open.22nd OctoberThat looks to be the pattern we are trading.Could quite easily pop to 24.5 K
Lets see what happens

DE40 probability of upward movement I'm waiting for confirmation of the upward movement.
I take into account real volume, FVG, divergence and 1H time frame which working exellent with my divergence indicator.
Will see...
patience pays off !!!

DAX Bullish breakout retest?The DAX remains in a bullish trend, with recent price action indicating a potential overbought pullback within the broader uptrend.
Support Zone: 23970 – a key level from previous consolidation. Price is currently testing or approaching this level.
A bullish rebound from 23970 would confirm ongoing upside momentum, with potential targets at:
24490 – initial resistance
24580 – psychological and structural level
24770 – extended resistance on the longer-term chart
Bearish Scenario:
A confirmed break and daily close below 23970 would weaken the bullish outlook and suggest deeper downside risk toward:
23870 – minor support
23770 – stronger support and potential demand zone
Outlook:
Bullish bias remains intact while the Dax40 holds above 23970. A sustained break below this level could shift momentum to the downside in the short term.
This communication is for informational purposes only and should not be viewed as any form of recommendation as to a particular course of action or as investment advice. It is not intended as an offer or solicitation for the purchase or sale of any financial instrument or as an official confirmation of any transaction. Opinions, estimates and assumptions expressed herein are made as of the date of this communication and are subject to change without notice. This communication has been prepared based upon information, including market prices, data and other information, believed to be reliable; however, Trade Nation does not warrant its completeness or accuracy. All market prices and market data contained in or attached to this communication are indicative and subject to change without notice.
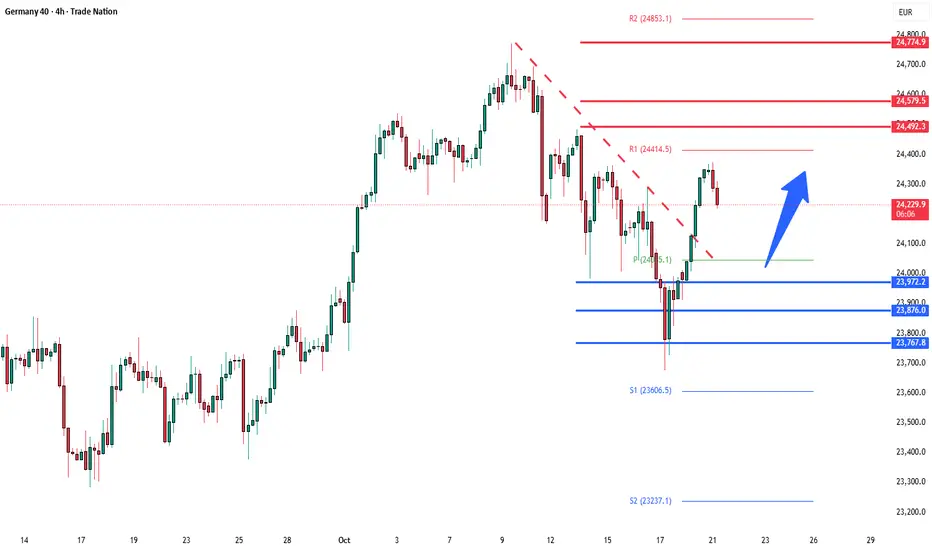
DAX Technical Forecast: Bullish Momentum Faces Key ResistanceGER40 (DAX) Technical Forecast: Bullish Momentum Faces Key Resistance
Analysis as of 18th Oct 2025 (Close: 23,971.7)
Market Context: The DAX exhibits robust bullish momentum, but is now testing a critical juncture. A confluence of technical factors on higher timeframes suggests the next move will be decisive for both intraday and swing traders.
Multi-Timeframe Analysis (Top-Down View)
Swing Bias (D1/4H): Bullish Above 23.7k
The daily chart reveals a strong uptrend, with price holding firmly above key moving averages (50 & 200 EMA). However, we are approaching a significant Wyckoffian Supply Zone and a potential Bullish Crab Harmonic pattern completion near the 24,200 - 24,300 resistance cluster. The RSI on the D1 is in bullish territory but not yet overbought, leaving room for further upside.
Intraday Bias (1H/30M): Cautiously Bullish
The 4H and 1H charts show price consolidating in a bullish flag formation. The Ichimoku Cloud on the 1H acts as dynamic support, while the Anchored VWAP from the recent low confirms a strong bullish trend. A break above the 24,050 level could trigger the next leg up.
Key Chart Patterns & Theories in Play
Elliott Wave: We are likely in a Wave 3 extension on the daily chart. A pullback to the 23,700 support would be a healthy Wave 4 before a final Wave 5 push.
Gann Analysis: The Square of 9 highlights 24,200 and 24,450 as potential time/price resistance targets for this swing.
Head and Shoulders? No traditional pattern is present. The primary risk is a Bull Trap if price rejects from the 24.3k resistance without a significant volume breakout.
Actionable Trade Setups
🟢 Swing Trade (Buy the Dip)
Entry: 23,700 - 23,800 (Zone of confluence with 50 EMA & Fibonacci 0.382 retracement)
Stop Loss: 23,500
Take Profit 1: 24,200
Take Profit 2: 24,450
🔴 Intraday Long (Momentum Break)
Trigger: A confirmed break and close above 24,050 on the 1H chart.
Entry: On retest of 24,000 as support.
Stop Loss: 23,900
Take Profit: 24,250
⚫ Intraday Short (Counter-Trend)
Trigger: A clear bearish rejection (e.g., Bearish Engulfing candle) at the 24,200 resistance with RSI divergence.
Entry: Upon rejection signal on the 30M chart.
Stop Loss: 24,350
Take Profit: 23,900
Key Levels
Resistance 3: 24,450 (Gann Target)
Resistance 2: 24,300 (Harmonic Completion)
Resistance 1: 24,050 - 24,100 (Immediate Hurdle)
Support 1: 23,850 (Recent Swing Low)
Support 2: 23,700 (Critical Bullish Defense)
Support 3: 23,500 (Trend Invalidation)
Conclusion
The DAX remains in a firm uptrend. The optimal strategy is to seek long entries on pullbacks towards key support. Be vigilant for a potential reversal at the 24.2k-24.3k resistance zone. Trade what you see, not what you hope.
Risk Warning: Trading carries significant risk. This analysis is for educational purposes and does not constitute financial advice. Always manage your risk and conduct your own due diligence.
GER40, LONG, 17.10.25Reasons for entry:
1. Full fill bullish daily and weekly bullish imbalance.
2. Discount zone.
3. Grab liquidity and inversion bearish imbalance.
4. LRLR liquidity to take profit.
5. Divergence 1h.

How China Is Quietly Taking Over Europe’s Industrial FutureThe Lack of Rare Earth Elements Pushes Europe into Major Concessions to China.
Europe’s growing shortage of rare earth elements is forcing it to make unprecedented concessions to China — so deep that analysts now warn the continent could see the collapse of entire industrial sectors within the next five to six years.
Automotive, shipbuilding, aviation, and railway manufacturing are all at risk. To stay afloat, European manufacturers — especially in Germany — are reportedly transferring valuable production know-how and proprietary technologies to Chinese partners in a desperate attempt to survive just a few more months or years.
China, meanwhile, is using this knowledge to strengthen its own technological base. The scenario is alarmingly familiar: just as China mastered and surpassed the West in electric vehicles, it is now poised to outpace Europe across nearly every remaining industrial field.
Investing in major German corporations is rapidly becoming meaningless. These companies will either shut down or be bought out entirely. The battle for industrial dominance has already been decided — China has won against Europe. What remains is the larger confrontation with the United States, a conflict that will likely unfold on Europe’s back, among the ruins of its once world-leading industries.
