ADABTC gives an long idea for ADAUSDTwe have a nice little range going on here, it would be logical to long the bottom of the range with the confluence of monthly level and 0.5 fibs retracement. targeting the mid-range of the channel that has been respected very well. buy looking at this idea, if ADABTC were to drop 8 to 10 percent it would mean that ADAUSDT could take the lows at 0.4 dollars which gives a possibility for an SFP pattern and a high R; R setup on USDT Pair. trigger for long on USDT pair would be for the price sweeping the lows and immediately go back above.
ADABTC.P trade ideas

CARDANO: TOO SIMILARHi guys, searching for similarities with previous bear market I found this.
The pair is vs Btc and seems we are in the last bull trap before the next leg down, hoping the last.
Do you think the pattern is similar or not?
Let me know.


head and shoulder in ada btcafter break out we can move forward 50% gain in ada/btc piar, add to watch list for good break out and pullback.

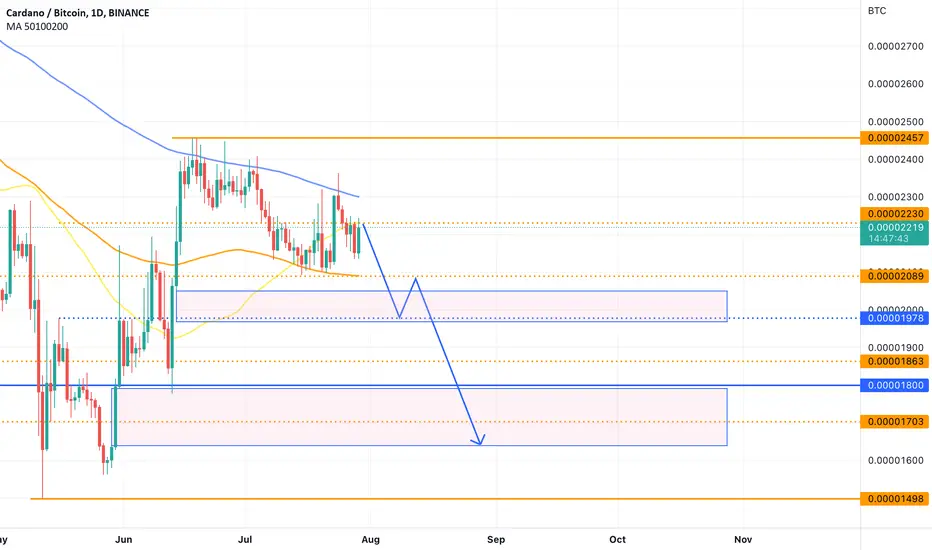
ADABTC possible scenarioAdabtc seems to weaken and this is possible pathway that i’m thinking of specially to fulfill the FVG on daily charts that are shown on chart…lets see if it works out
Always a student
Ada just put a lower high against btc.Lower low in the coming weeks is a possibility, following the bearish trend.

ADABTC Shows bullishness, despite bearish sentiment. $ADABTC is bottoming out, yet many are overly bearish at the bottom.
This is typical of markets.
Either way, trading the BTC pair for a lot of tokens is imperative for getting the full picture.
BTC, NOT USD, is the king in this market, and thus, it is what you should trade against, using your analysis of bitcoin as a macro guide. The net USD result will be your alt coin gain in BTC multiplied by the USD value. If BTC's moves cause volatility in the price of alts, how can you chart them correctly without consulting the pair?

ADA looks very strong against BTCI really like what I see on ADA's BTC chart. There are a lot of reasons to be bullish:
1) Bullish breakout of the purple falling wedge
2) Breaking back above very strong, long-term support
3) Breaking 60 on the daily RSI
4) Breaking above the zero line on the daily MACD
I'm long here

ADA / USD - Gravestone DOJIOn the above 10-day chart price action is overbought (green columns) and the last 10-day candle just printed a Gravestone DOJI at the same time RSI support fails. Bearish candles on this time frame are powerful, don't ignore.
Two possible targets for support @ -10% and -40 are identified.

Smart people are buying ADA | you should see this!They are already buying ADA, price is down because BTC is down when BTC goes up ADA will conquer the market, the proof is in this chart, the downtrend is broken!

Cardano 50% Jump Mapped (vs Bitcoin)The ADABTC chart remains the same as we saw recently; strongly bullish.
We have prices trading above EMA100 (blue) and EMA50 (magenta).
We have a very strong RSI and bullish MACD.
We have the inverted head & shoulders pattern...
The next target is mapped on the chart at 50%.
First target is set at 18%.
Additional details on the chart.
Many great opportunities will be developing in the days to come.
Get back online.
Become active.
Get ready for profits & fun.
Namaste.

Possible path for ADABTC!Here is the idea that i think possibly Ada will outperform Btc after breaking the box and pull back If btc keeps ranging around this zone in short term.
Lets see if its gonna work out
Always a student

ADA Green Light | Time to buy?Hello guys, look at this beautiful chart right here, as we can see a weekly downtrend has been broken and I believe it's a bullish sign.

ADABTC Bearish divergence on RSIBearish divergence on ADA vs Bitcoin on Daily Chart.
Most possibly there will be crush of ADA or pump of Bitcoin

Cardano/ADA Inverse Head & Shoulders Moves Ahead vs BitcoinSome people are wondering if Altcoins will recover or when will they recover and so on...
Cardano is already recovering and remains printing higher highs and higher lows since Mid-May.
This is true for ADAUSD and ADABTC.
( Check the related ideas below for a full leveraged trade for the ADAUSD pair )
Here we can see the inverse Head & Shoulders Pattern.
Prices trading above EMA50 with a very strong RSI.
Cardano can continue growing in the weeks to come.
Namaste.

Cordano to bitcoin change trand hypotizeCordano to bitcoin change trand hypotize
Buy: 0.0002152
SL: 0.0000194
Bads:
- high volatility


ada/btcnot much to say just resistance supports and probabilities of where ada is going now not financial advice merely my humble opinion

Cardano Volume Breakout (Easy 100%+ Next)We have very high volume today on the ADABTC (Cardano) trading pair as prices move to close above EMA10.
The RSI is also looking good.
We are going big on ADAUSDT, this pair also looks bullish for the coming weeks.
You can find additional details on the chart.
Namaste.


ADA - Cycle bottom Whilst everyone is glaring at the USD chart, it's important to identify a possible bottom with the BTC value. I have outlined two possible entries. Last cycle ADA did more then 100x. I think its possible to see 20x return next cycle.

Cardano/BitcoinBitcoin has dropped enough. Now is the time to buy Cardano because it is supported at this price

Wyckoff trading using the example of ADA/BTC Accumulation schemePay attention to the phases and letter designations on the graph that I showed on the ADA / BTC pair. (Cardano). A diagram of the accumulation phases is shown. Which are relevant for trading now. Several trading methods are combined on the chart:
1) Trading by the Wyckoff method.
2) Trade in horizontal channels.
3) Trade from important areas (price reversal points).
4) Trading in secondary local trends.
Now the price is at the important zone of the mirror level which, from the development of the situation, can act as support or resistance. Channel pitch 30%. You can work in two directions.
_________________________________
About Wyckoff's trading method.
The forerunner of volume analysis (VSA) is Richard Wyckoff. Roughly speaking, the whole point of the method can be expressed - trade for a major market player. The creator of this technique himself was a man who had a system-forming influence on stock trading. It was not a poor theorist who got rich after publishing books! He was a very successful trader and earned impressive capital in his day. The very method that he was allowed to achieve and the entire 40 years of experience in trading, he published in his book in the public domain is already closer to his death Wall Street Ventures and Adventures Through Forty Years. At the end of his life's journey, Wyckoff became more altruistic, and decided to share the knowledge that led him to wealth. He died in 1934.
The Wyckoff trading method was developed in the early 1930s. It consists of a number of principles and strategies originally developed for traders and investors. Wyckoff devoted much of his life experience to studying market behavior, and his work still has an impact on much of modern technical analysis (TA). Currently, the Wyckoff method is applied to all types of financial markets, although initially it was focused only on stocks.
During the creation of his work, Wyckoff was inspired by the trading methods of other successful traders (especially Jesse Livermore). Today, he enjoys the same respect as other key figures such as Charles Dow and Ralph Nelson Elliott. But for example, unlike Elliot’s theory, which is good in theory, but not always applicable in practice, the Wyckoff method is many times more effective for making money not in theory, but in practice.
_________________________________________
According to Richard Wyckoff's trading method, there are 3 laws:
1) The law of supply and demand.
2) The law of causation.
3) The law of communication efforts and results.
The first law states that the value of assets begins to rise when demand exceeds supply, and accordingly falls in the reverse order. This is one of the most basic principles in the financial markets, which does not exclude Wyckoff in his work.
We can represent the first law in the form of three simple equations:
1) Demand> supply = price increases.
2) Demand
