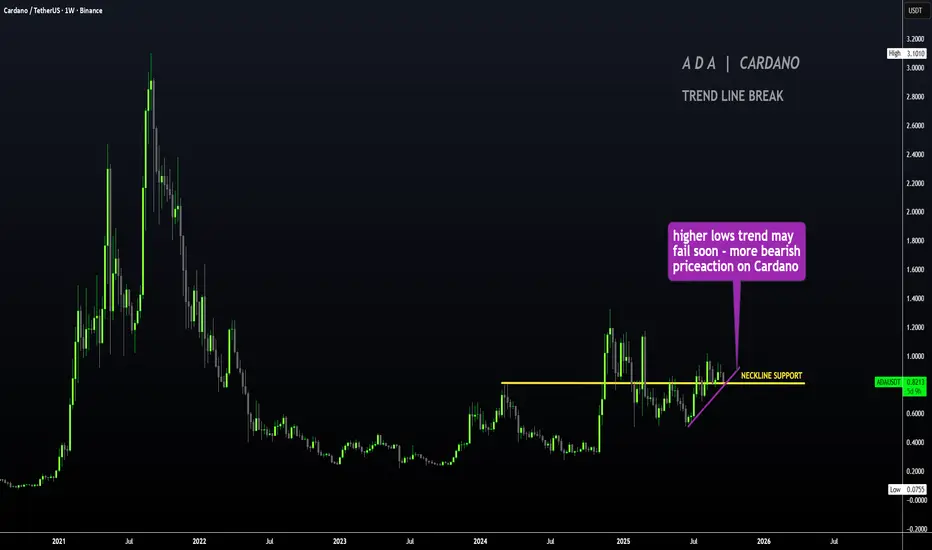
ADA - Failure to LAUNCH, BEARISH Short TermHello Traders
Cardano / ADAUSDT is not looking good for the short term after the higher lows trendline has been broken (trendline analysis / support analysis).
The 4h shows a bearish drop with a nasty red candle:
Also, if we consider a technical indicator - the moving averages - the price has fallen far under the 200d MA, for the first time in months. This is not a good sign, unless we can recover towards the upside within a week and stay right under it like a few days ago:
If there is no return to the upside, a coupe of bounce zones we can watch in the near to longer term include :
👋 Thanks for your support
BYBIT:ADAUSDT
Trade ideas

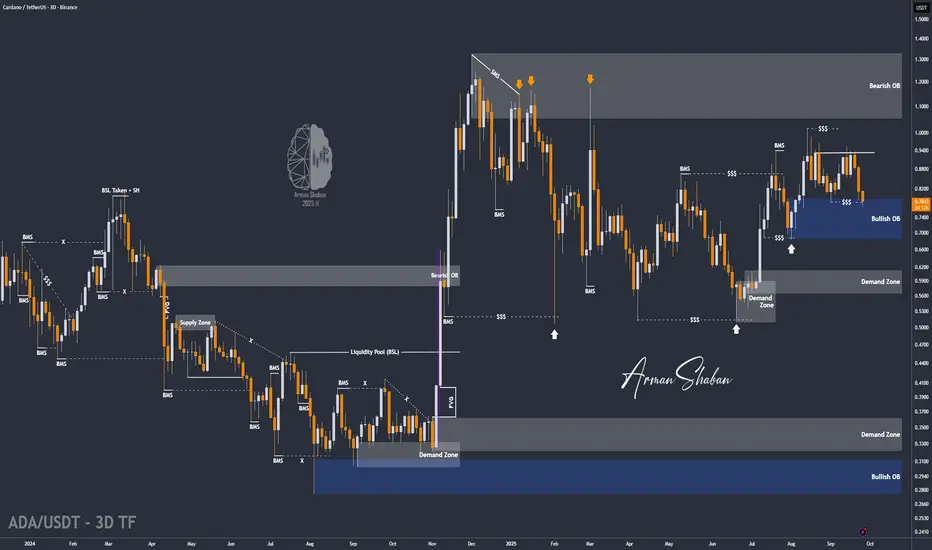
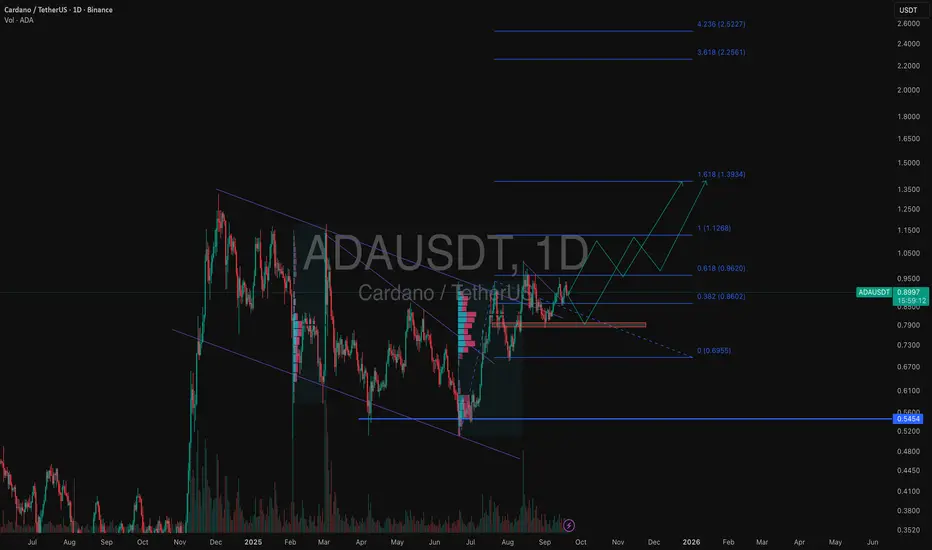
ADA/USDT | ADA Testing $0.68–$0.78 Demand – Next Pump Ahead?By analyzing the Cardano (ADA) chart on the 3-day timeframe, we can see that the price started correcting as expected and has now reached $0.78, entering the key $0.68–$0.78 demand zone. Now we need to see whether this zone can stop ADA from dropping further.
If the price holds in this strong demand area, we could expect a big bullish move. The short-term targets are $0.85, $0.95, and $1.00, while the mid-term targets are $1.05, $1.17, and $1.33.
Please support me with your likes and comments to motivate me to share more analysis with you and share your opinion about the possible trend of this chart with me !
Best Regards , Arman Shaban
#ADAUSDT (4H Chart)#ADAUSDT
(4H Chart)
🔹️ Cardano Short-Term Analysis 🔹️
🟡 The current price is holding above the yellow support box, and from this area, we expect growth.
🔴 Target is the red box in the 0.88 – 0.90 USD range.
🟢 After touching the red box, a correction toward the green box is expected.
🔰 The green box is the best support for Cardano and a strong level for spot buying.
🚀 After touching the green box, the final target for Cardano will be a new high around 4 USD.
📌 Summary: Bullish Scenario ✅
Move towards the red box, correction to the green box, and then a rally toward a new all-time high.
🆔 @Rasoolahmadi

Cardano dumpt tonight to $0.7255Sl: 0.8042
tp: 0.7255
expecting more selling pressure / supply to come in soon. Time sensitive
2.32 RR approx.
To learn how I analyze the market visit my x profile.

ADAUSDT – TECH SHORT SELL CALL BY THE CHART ALCHEMIST | 1-H TFADAUSDT – TECH SHORT SELL CALL BY THE CHART ALCHEMIST | 1-HOUR TF
27 SEPT 2025 | 12:00 GMT
The crypto coin is moving in a bearish channel (marked in light pink), having touched the top and now heading towards the bottom.
📢 Technical Analysis by Mushtaque Muhammad (The Chart Alchemist)

Cardano (ADA): Seeing Good Market Structure Break | Bullish AFCardano might be making another attempt to rise after the significant downturn we experienced in the markets. Quite optimistic about ADA!
More in-depth info is in the video—enjoy!
Swallow Academy

BUY AND HOLDHello friends
You see that after the good rise we had, the price is correcting, which is a natural thing and there is no need to worry, and in these corrections, you can buy in steps with capital and risk management and move with it to the specified goals.
Note that the holding period is at least 3 months, so be patient and observe capital management.
*Trade safely with us*

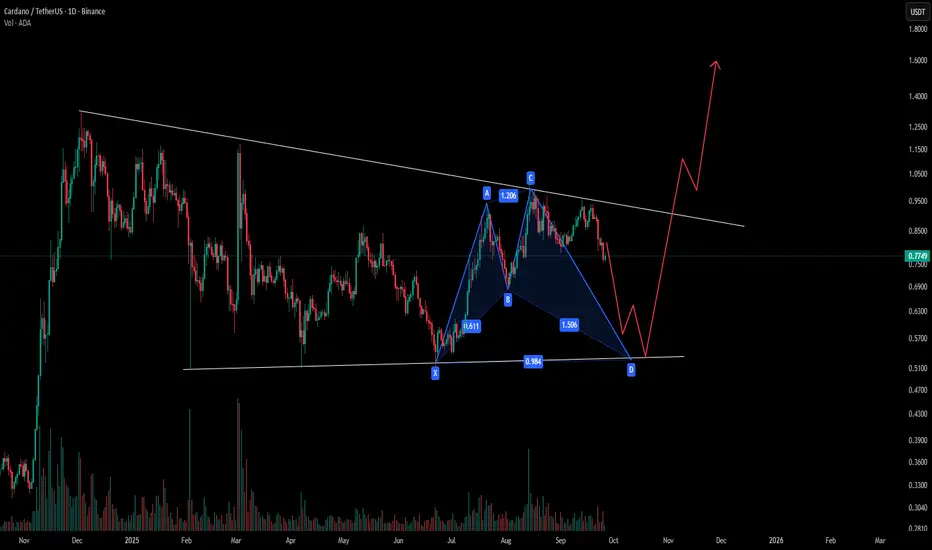
ADA analysisFrom the current structure, I think price may continue lower to retest the trendline support before setting up for a reversal.
The harmonic pattern visible on the chart also supports this idea — suggesting that the market could complete the pattern with a touch of the trendline before turning back higher.
If this plays out, I see potential for ADA to bounce strongly and work its way back toward the 2024 highs.
It’s also worth highlighting that Cardano remains a fundamentally strong project in the crypto space, and that broader strength gives more weight to the long-term bullish outlook once technical retracements play out.
🎯 Conclusion: This is my analysis — not financial advice. I don’t want to see people lose money in the markets, but from a technical standpoint, the chart points to a likely move into the trendline first, followed by a possible recovery toward prior highs.
👉 For more structured market insights and professional analysis, follow along.
ADA long to $0.8450Just went long on cardano.
Aiming for $0.8450 area
Roughly 3rr
Sl: 0.8124
Time sensitive

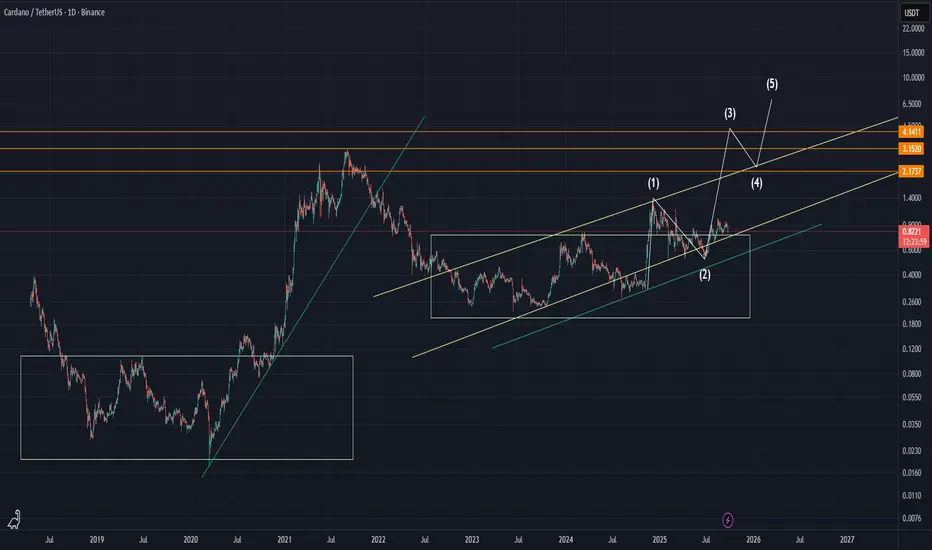
Get Ready for Cardano’s Wave 3Hello Everyone,
Cardano appears to be gearing up for Wave 3 of the Elliott Wave cycle. After a relatively slow and corrective Wave 2, which often tests traders’ patience, the next impulsive wave could be starting soon. Many traders tend to give up during Wave 2 due to the mental pressure it brings—but those who stay prepared may benefit the most from Wave 3.
Stay alert and get ready for what’s coming.
Best regards,
Sam
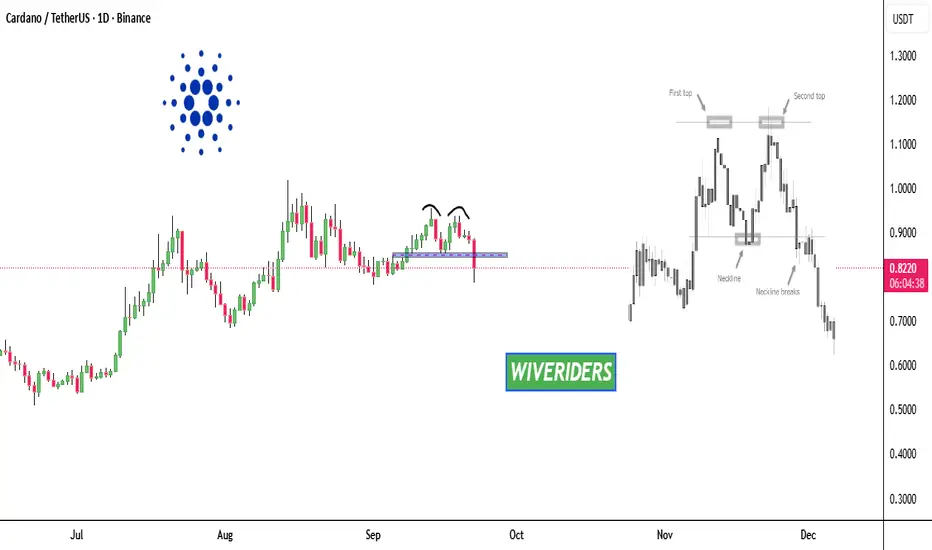
ADA has formed a bearish Double Top pattern 📊 CRYPTOCAP:ADA Price Update
ADA has formed a bearish Double Top pattern ⚠️
At the moment, ADA remains in a bearish trend 📉 with no signs of price stabilization yet.
ADAUSDT Bearish Head and Shoulders Pattern formedADAUSDT formed a bearish head and shoulders pattern on 1D time frame which indicates towards ~ 0.50

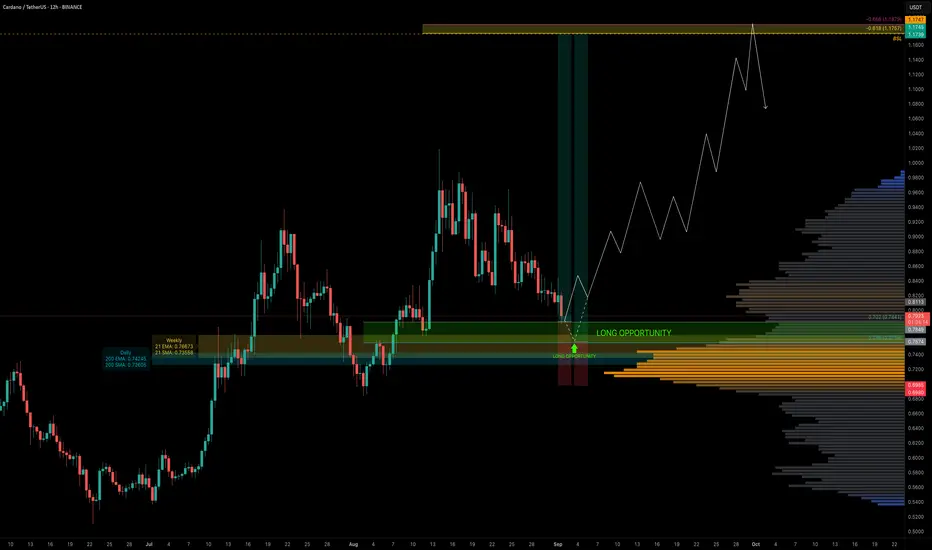
ADA — Fib Harmony With EMA/SMA SupportADA has been in a downtrend for the past 18 days and is now approaching a cluster of key support levels. Today, price tapped the 0.702 Fib retracement ($0.7841) — an optimal area for long entries.
The main focus, however, is the 0.786 Fib retracement, which aligns with a liquidity pocket and multiple layers of confluence, making it the most ideal entry zone.
🧩 Confluence at 0.702–0.786 Fib Zone
0.702–0.786 Fib retracement → prime long entry range
Liquidity pocket → sitting around the 0.786 Fib
200 EM ($0.7424) / 200 SMA ($0.726) (daily)
21 EMA ($0.766) / 21 SMA ($0.735) (weekly)
Pitchfork lower support line → intersecting the zone
0.618/0.666 Fib Speed Fan → adding another support layer
🟢 Long Trade Setup
Entry Zone: 0.702–0.786 Fib retracement
Best Entry: Around the 0.786 Fib
Stop-Loss: Below $0.70 (to be adjusted after seeing more price action)
Target (TP): $1.1757 (–0.618 Fib, in confluence with key high & buy-side liquidity at $1.1747)
Potential Move: +50%
R:R: ~1:4.5 up to 1:7 (depending on entry)
Technical Insight
ADA is testing deeper retracements within its current downtrend, the 0.702–0.786 Fib zone combines structural, dynamic, and liquidity-based confluence.
The added support of the weekly 21 EMA/SMA strengthens this area as a pivotal level for bulls to defend.
If held, this zone could fuel a swing long setup with great upside potential.
The $1.1747–$1.1757 zone is both a high-confluence take-profit area and a potential short opportunity, given the liquidity resting above that level.
🔍 Indicators used
LuxAlgo — Liquidity Sentiment Profile (Auto-Anchored)
Multi Timeframe 8x MA Support Resistance Zones → to identify support and resistance zones such as the weekly 21 EMA/SMA
➡️ Available for free. You can find it on my profile under “Scripts” and apply it directly to your charts for extra confluence when planning your trades.
_________________________________
💬 If you found this helpful, drop a like and comment!
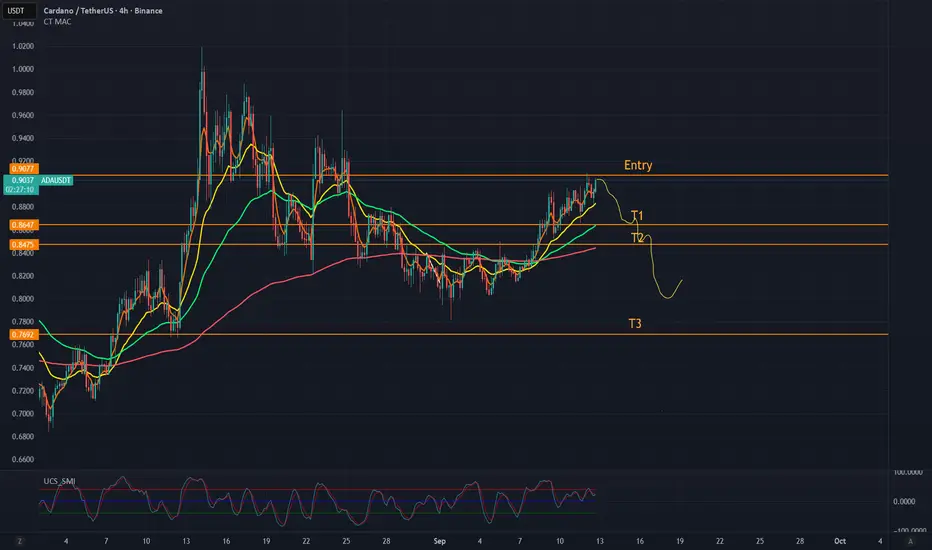
[Crypto] - Cardano (ADA) - ShortPerfect Entry for a Short Position at this Level. (0.9040)
I'm expecting a larger drop of BTC within the next days, ultimate goal there round about 106000,-
As Alts are moving most of the time in the same direction, sometimes with even more power, I looked for the best one to short and came to ADA.
It is currently at a great level for a reversal.
Targets:
T1: 0,8650
T2: 0,8470
T3: 0,7700
Target 3 would be my ultimate goal if BTC drops to my expected 106000 level.
Have fun, no trading advise as always and if there are questions, feel free to drop me a comment.
ADA/USDT; FREE SIGNALHello friends
According to the market cycle, you can see that every time after the price growth we had a correction and now it seems that the price wants to exit the correction and have a new growth. If the support levels continue, the price can move to the specified targets.
*Trade safely with us*

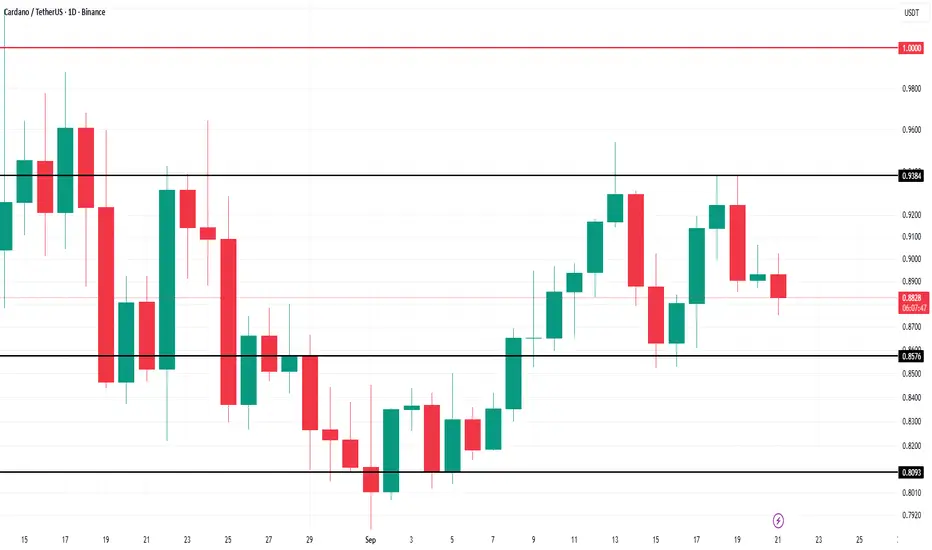
Cardano Whales $500 Million ADA Selling To Delay Price Rise To $Cardano’s price sits at $0.888 at press time, holding slightly above the $0.880 support. However, the current environment suggests a risk of losing this critical level if bearish sentiment intensifies. The vulnerability to downside remains clear as whale selling persists.
Should ADA fall through $0.880, the next key support sits at $0.837. A drop to this level would extend recent losses and may prompt further liquidation from smaller holders, creating additional downward pressure. This could stall ADA’s path to recovery.
Conversely, a successful bounce off $0.880 could open a short-term rally toward $0.931. Flipping this resistance into support would improve market sentiment, enabling ADA to target $0.962. Breaking this barrier would invalidate the bearish thesis and bring Cardano closer to $1.
Cardano: accumulation zone and looming liquidations near $1ADAUSDT has moved into a corrective channel after its recent rally, consolidating around $0.90 and testing the upper boundary. Support at $0.8890 is still intact, making the structure look like accumulation before a new leg up. The near-term outlook suggests a breakout toward $0.92 and $0.93, with a more cautious path involving a pullback to $0.8960–0.8940 before another push higher.
Fundamentally, Cardano remains a top altcoin thanks to its strong community and smart contract ecosystem. But the current market focus is on a very practical factor: a breakout above $0.96–1.00 could trigger massive short liquidations estimated between $70M and $100M. Such a liquidation cascade could accelerate ADA’s rally toward $1 and beyond. On the flip side, if resistance holds, a return toward $0.87 and lower remains possible.
In short, the $0.96–1.00 zone is a powder keg break it and ADA can explode higher, fail it and bulls will have to wait for another attempt.
Cardano long to $0.9542Just recently opened a long position on cardano. Aiming for $0.9542 but scaling out along the way.
Sl: 0.8840
Partial tps on chart

ADA/USDT | Cardano Battles $0.93 – Breakout Targets $1+ Ahead!By analyzing the Cardano (ADA) chart on the 3-day timeframe, we can see that after rising from $0.85 to $0.93, the price faced a correction and is now trading around $0.89. The $0.93 level has turned into a key resistance, and if ADA manages to break above it, we can expect a stronger bullish move.
The possible upside targets for this rally are $1.00, $1.05, $1.17, and $1.33.
Please support me with your likes and comments to motivate me to share more analysis with you and share your opinion about the possible trend of this chart with me !
Best Regards , Arman Shaban

Ada/usdtIn the 1-hour timeframe, if Cardano manages to break its resistance level at 0.900, it may move toward the higher target of 0.9554.
When entering a position, the stop-loss should be placed at 0.8890

ADAUSDT | 15 M | Market Structure | Bearish Price Trend| 2 of 2On the 15M chart, after the last LL, price has stopped pushing lower and is now moving sideways in a range.
1. There is no fresh LL or HH, indicating indecision.
2. This suggests the market is in consolidation, pausing before its next move.
Our course of action:
1. Do NOT trade inside the range → risk of chop and poor R:R.
2. Wait for confirmation:
i. A bearish break of structure from the range → signals continuation short, in line with the 1H bias
ii. A bullish break of structure → would signal a potential shift, but longs should only be treated as quick scalps since the 1H is still bearish.

ADAUSDT | 1 H | Market Structure | Bearish Price Trend| 1 of 2On the 1H chart, price is showing bearish sentiment.
1. On the 1H chart, price is showing bearish sentiment.
2. We have a series of Lower Highs (LH) and Lower Lows (LL).
3. Multiple Breaks of Structure (BoS) confirm that sellers remain in control.
4. This sets our higher time frame bias to bearish, meaning we should primarily look for short setups unless structure flips bullish.
