ADA/USDT | Low-Risk Swing Setup with 215%+ Upside Potential🚀 Trade Setup Details:
🕯 #ADA/USDT 🔼 Buy | Long 🔼
⌛️ TimeFrame: 1D
--------------------
🛡 Risk Management (Example):
🛡 Based on $10,000 Balance
🛡 Loss-Limit: 1% (Conservative)
🛡 The Signal Margin: $463.61
--------------------
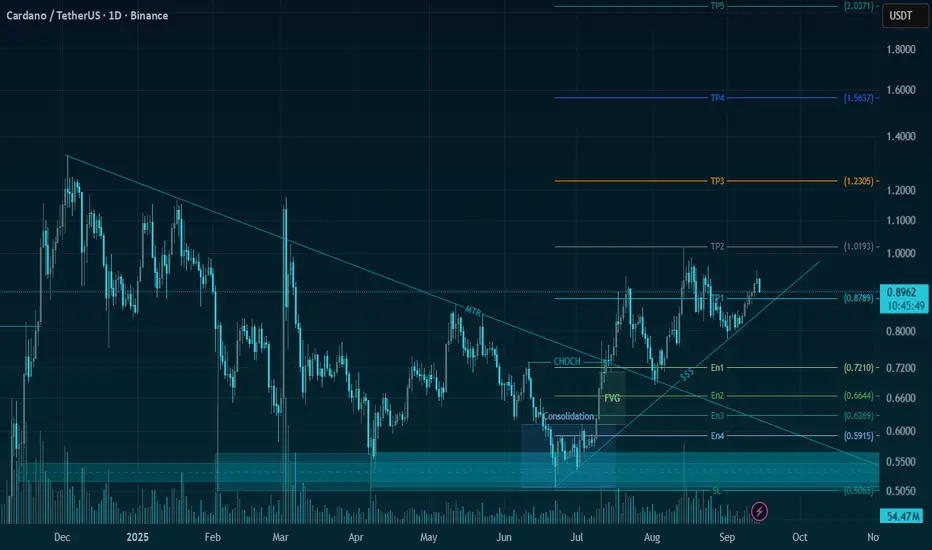
☄️ En1: 0.721 (Amount: $46.36)
☄️ En2: 0.6644 (Amount: $162.26)
☄️ En3: 0.6269 (Amount: $208.62)
☄️ En4: 0.5915 (Amount: $46.36)
--------------------
☄️ If All Entries Are Activated, Then:
☄️ Average.En: 0.6458 ($463.61)
--------------------
☑️ TP1: 0.8789 (+36.09%) (RR:1.67)
☑️ TP2: 1.0193 (+57.84%) (RR:2.68)
☑️ TP3: 1.2306 (+90.55%) (RR:4.2)
☑️ TP4: 1.5637 (+142.13%) (RR:6.59)
☑️ TP5: 2.0372 (+215.45%) (RR:9.99)
☑️ TP6: Open 🔝
--------------------
❌ SL: 0.5065 (-21.57%) (-$100)
--------------------
💯 Maximum.Lev: 3X
⌛️ Trading Type: Swing Trading
‼️ Signal Risk: 🙂 Low-Risk! 🙂
--------------------
🔗 www.tradingview.com
❤️ Your Like & Comments are valuable to us ❤️
Trade ideas
Cardano The chart for Cardano (ADA) on the 4-hour timeframe shows a strong bullish move, reaching a peak around 0.9200 before pulling back. The price has created higher highs and higher lows, indicating a bullish trend. Currently, the key resistance level is at 0.9200, with support levels around 0.8600 and 0.8400. If the price manages to break above the resistance at 0.9200, the next target could be around 1.0000, as shown in the chart. However, if the price fails to break through and continues to pull back, it may retest the support levels at 0.8600 and 0.8400. The market appears to be in a consolidation phase, with a potential continuation of the upward trend if the resistance breaks.

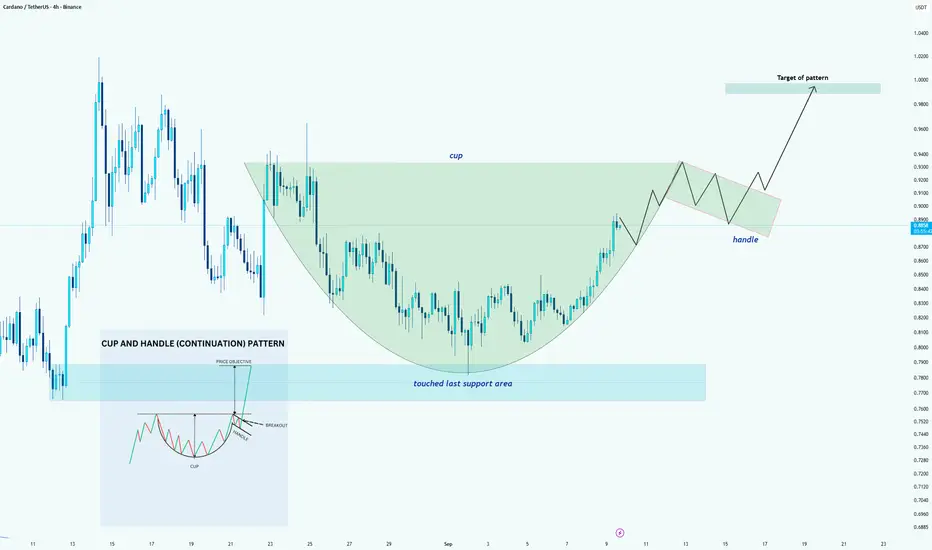
ADA/USDT – Cup & Handle PerspectiveHello guys!
Currently, the chart is showing the formation of a potential cup and handle pattern. The rounded bottom of the cup has already developed, suggesting that market participants are gradually regaining buying interest after the recent decline.
However, it’s important to note that:
The handle has not yet formed, and
A breakout confirmation is still missing.
This means the pattern is not yet validated —> it’s only a perspective and assumption at this stage. For the setup to confirm, we would need:
A consolidation forming the handle, and
A clean breakout above the neckline area.
If the breakout occurs with solid volume, the measured target of the pattern could push the price toward the $1.00 level, which also aligns with psychological resistance.
Cardano (ADA): Expecting Another 11% of Market Price Movement$Cardano has finally broken the EMAs, with buyers keeping the bullish momentum and pushing for higher highs on the smaller timeframes. From here, we are looking for the local resistance to be reached, which would give us around +11% market movement from the current price.
Keep an eye on the candles close to market price for a better understanding of the structure and confirmation.
Swallow Academy

ADA/USDT New DISCOUNT ARRAYNew DISCOUNT ARRAY
Price is currently inside a 4HR FVG.
It has completed a sweep of origin bar low = higher-probability setup (liquidity grab).
Target previous highs.
🚩 Invalidation: If the supporting FVG breaks with a clear breakaway candle, this setup is void.

ADA – Cardano Swing Long IdeaADA – Cardano Swing Long Idea
📊 Market Sentiment
Market sentiment remains strongly bullish as the FED is expected to deliver a 0.25% rate cut, with speculation building for a possible 0.5% cut in September. Monetary policy shifts are being driven by both inflation trends and weakening labor market data. The latest August and September job reports were soft, signaling that the economy is cooling rapidly. This environment continues to fuel expectations for a major bullish run in the weeks ahead.
📈 Technical Analysis
Price found support on September 1st at the bullish HTF trendline and has been moving upward since.
Price is currently at the HTF Key Resistance level, showing accumulation rather than sharp rejection, with deviations pushing upward. This indicates strength and a bias toward higher prices.
📌 Game Plan
1)Watch for a daily close above the bearish trendline.
2)Look for the HTF Key Resistance to be broken and confirmed with a daily close above.
🎯 Setup Trigger
Entry after the retest of the HTF Key Resistance level ($0.885).
📋 Trade Management
Stoploss: Daily close below HTF Key Level ($0.85 area)
Targets:
TP1: $0.96
TP2: $1.02
💬 Like, follow, and comment if you find this setup valuable!
⚠️ Disclaimer: This content is for informational and educational purposes only and does not constitute financial, investment, or trading advice. Always do your own research before making any financial decisions.

ADA/USDT – 5th Wave Breakout or Extended 4th Wave?KUCOIN:ADAUSDT might have completed its 4th wave of the larger 5 wave structure, but confirmation depends on breaking out of the current channel.
The daily RSI is nearing overbought, so there’s still a chance for a minor dip before continuation. Current upside target sits between 1.085 -1.20 USDT , aligning with the larger channel and forming a higher high. If this plays out, it likely completes a first wave of a bigger five-wave structure, followed by a cooldown.

ADA/USDT 1HR time-frame
Coming off a BULLISH, DAILY FVG and painting a fresh, 1HR FVG, while respecting ORDERFLOW.
ADA/USDT, looks primed to challenge a 1hr BEARISH FVG and possibly yesterday's high.
🚩 Invalidation: If the Daily FVG breaks with a clear breakaway candle, this setup is void.

ADA/USDT 1W chartbreakout.................................
support $ 0.234
TARGETS ARE GIVEN IN THE CHART


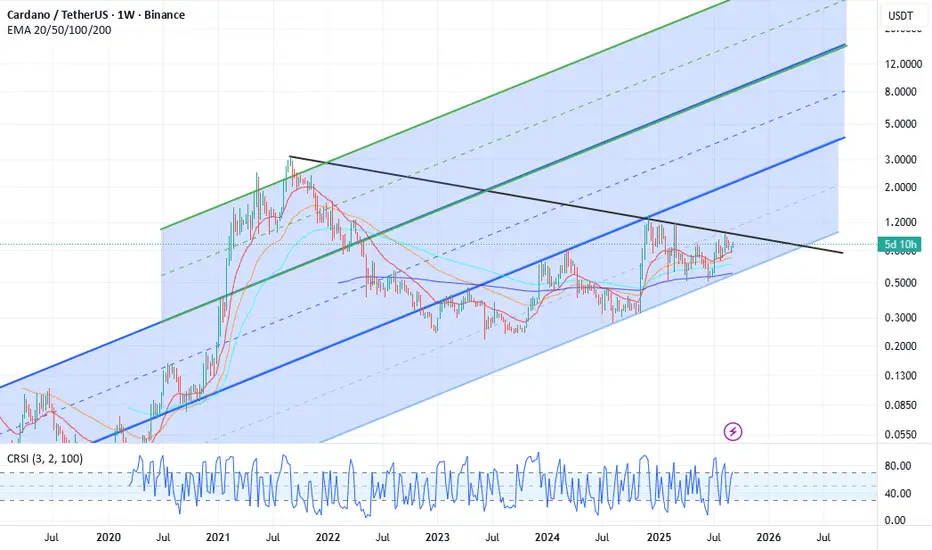
Cardano Ready for a Major Move – Huge Potential for $ADACardano has significant potential, but from a technical perspective we still need to see a decisive confirmation candle above the black trend line before a sustained breakout can be confirmed. If we break this trend line with strong momentum, the next mid-term targets are $1.20 and $1.60.
On the fundamental side, there is a strong pipeline of catalysts: BTC DeFi on Cardano enabled by its shared UTXO structure, the upcoming Leios upgrade for scalability, Hydra L2 for faster transactions, and the launch of the first Cardano partner chain Midnight, which focuses on privacy and selective disclosure to meet enterprise demand.
Looking further ahead, the possible targets for 2026 are in the $3 to $8 range, which align with the mid-line of the second ascending channel.
Considering both the technical setup and the fundamentals, I see substantial upside potential for Cardano in late 2025 and into 2026, with the possibility of outperforming BTC, ETH, and SOL as adoption and utility expand.
$ADA - bullish area above 0.800$ support. CRYPTOCAP:ADA - bullish area above 0.800$ support.
Back to 1.00$ soon? 📈

Ada on 15 min chartAnother bearish pattern forming on the 15 min chart can be a good daytrade/scalp if it close below the pattern .
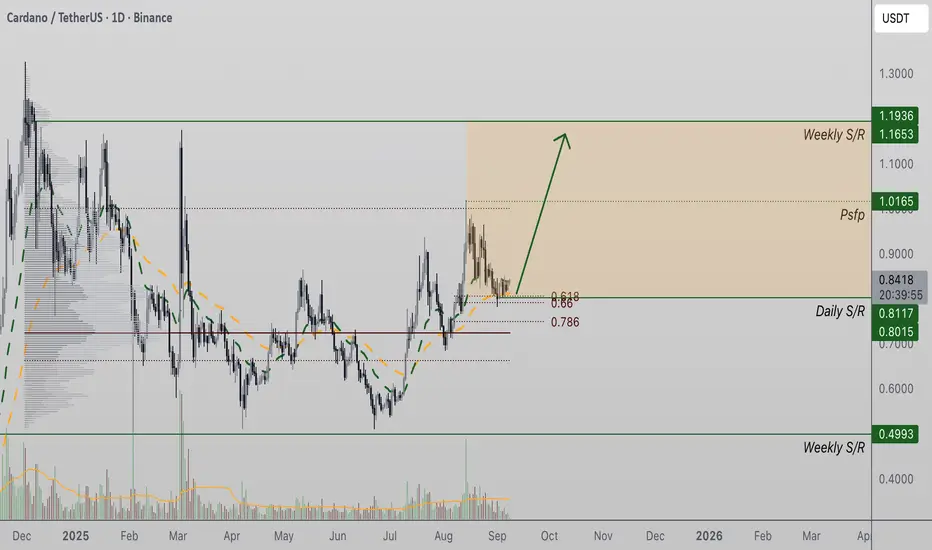
Cardano (ADA) Defends $0.81 Support, Targets $1.16 and BeyondADA price action has shown resilience at $0.81, a level supported by both the 0.618 Fibonacci retracement and daily timeframe structure. This confluence provides a strong foundation for bullish continuation, keeping the market structure intact despite the recent corrective move.
ADA Key Technical Points
- Support Zone: $0.81 combines 0.618 Fibonacci support with daily structural demand.
- Upside Targets: Initial objective lies at $1.16, with a broader target of $1.19.
- Market Structure: Higher highs and higher lows confirm ADA’s ongoing bullish trend.
Analysis
The $0.81 region has become a pivotal level for ADA. Its alignment with both Fibonacci and daily support makes it a strong foundation for price to base upon. The repeated ability of this area to absorb sell pressure highlights demand and reinforces the bullish narrative, even as volume temporarily declines.
From a structural perspective, Cardano continues to print higher highs and higher lows, confirming the strength of its bullish trend. Corrective moves into key support zones such as $0.81 are considered healthy resets within an uptrend rather than signals of exhaustion. This pattern of accumulation suggests buyers remain firmly in control of the broader trend.
Looking forward, the $1.16 region represents the next significant upside target. A decisive break above this level would further validate the bullish structure and clear the path toward $1.19. Both targets align with previous resistance levels and Fibonacci extension objectives, providing a clear roadmap for continued expansion once momentum returns.
What to Expect in the Coming Price Action
As long as $0.81 support holds, ADA remains firmly bullish. A rotation toward $1.16 appears likely, and a breakout beyond that level could drive price action toward $1.19 in the short to mid-term.
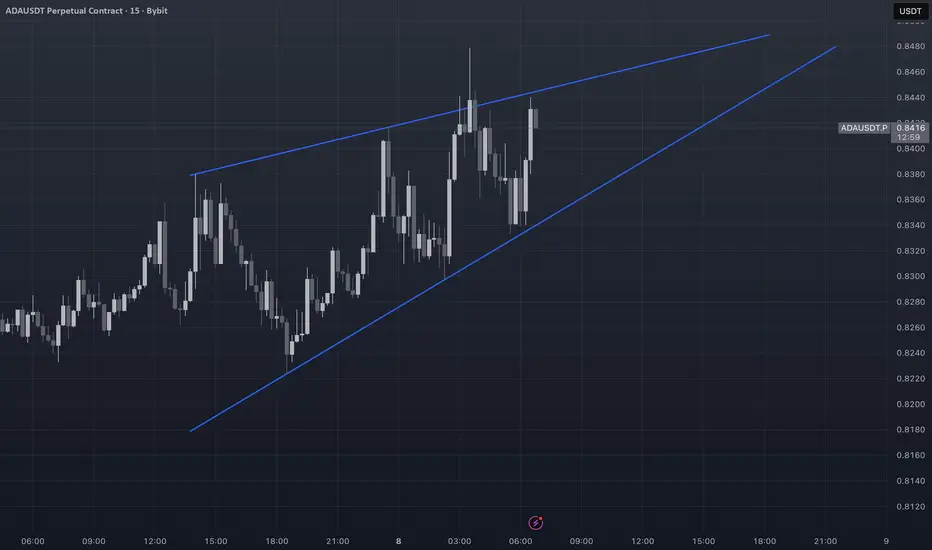
ADAUSDT — The 0.83 Tug-of-WarTraders, ADA’s been fighting over 0.83 like it’s the last chair in musical chairs. Buyers defend, sellers swing — but one side is about to lose rhythm.
High Timeframes (Weekly → 2D → 12H)
– Weekly HL base after vertical run + fade. Supply = 0.90–1.00. Demand = 0.72–0.76. Pullback volumes light = corrective.
– 2D rectangle: support 0.81–0.83, resistance 0.86–0.88. Imbalances at 0.82–0.84, deeper 0.78–0.80.
– 12H: Active 0.82–0.86 range, mid ~0.84.
• Break >0.86–0.88 = path to 0.90+.
• Lose <0.82 = test 0.80–0.78.
Orderflow / Profile
– POC 0.828–0.832.
– VAL 0.818–0.822 / VAH 0.845–0.848.
– Sellers consistently lean on 0.85–0.86; buyers defend 0.82.
Derivatives
– OI steady, funding flat, CVD heavy.
– Liquidations light, balanced.
Inter-Market
– BTC mid-range, BTC.D <60%, ETH stable → backdrop supportive as long as ADA holds 0.82–0.83 POC/VAL band.
Conclusion
ADA is in auction chess between 0.82–0.86. Acceptance outside = next directional leg. Until then, it’s balance play.
Candle Craft | Signal. Structure. Execution.

ADA RangeI continue to monitor a potential distribution on ADA, focusing primarily on finding an accumulation to push the price back to the highs. In this local 5-day range, I'm waiting for a confirmation/invalidation of this distribution to deviate the low and accumulate. The extreme supply looks good for a model 2, but a model 1 could also be possible. Confluence via BTC and USDT.D would be ideal. Since the preplanning extends far into the future, I will most likely adjust this again if I have time.

ADA/USDT possible long senarios I have marked up my chart with 2 possible scenarios. If choice one fails, move onto choice two. If both fail, move on. All the best.

Cardano (ADAUSDT) 4H – Rejection Zone Ahead?Cardano has been trading sideways but is approaching a major supply zone (0.85 – 0.95).
This red area has acted as strong resistance in the past, and a fresh rejection here could trigger a sell-off back toward 0.70 support.
🔴 Resistance Zone: 0.85 – 0.95
⚫ Support Zone: 0.70 – 0.72
📉 Bias: Bearish if rejection confirms.
---
💭 What do you think, ADA traders?
Will Cardano break above the red zone this time? 🚀
Or are we set for another rejection and deeper drop? 📉
Drop your thoughts below 👇 and don’t forget to hit like ❤️
---
👉 This structure makes it:
Simple (levels marked clearly).
Engaging (questions force replies).
Sharable (clean chart, clear idea).

ADA Battles $0.82 – Can Bulls Break $0.87 Resistance?Cardano (ADA) is trading around $0.82–$0.83 on the 4H chart, holding above its key support but still capped under resistance. In today’s video, I focus only on the short-term price structure: support at $0.8157–$0.8014, deeper levels at $0.7724 and $0.7620, and resistance at $0.8484, $0.8710, and $0.9347. A breakout above $0.8710 would be a key step for ADA to confirm recovery momentum.
The mid-term bias remains for more upside, but ADA must prove strength step by step. With Bitcoin showing bullish signals this morning and today’s NFP release increasing volatility, ADA’s reaction at these levels will define whether bulls can take control or if we see another retest of support.


Tp hit Regarding the positions and contracts that I posted i could only open 3 position ADA ANKR and 1INCH and we could hit our tp's right on time but today surely I'll stay out.
BTW thank you for your supports I appreciate it 🙏

ADA Buy/Long Setup (1D)Cardano, in our view, is currently within a major bullish structure, with wave D having just completed.
It now appears that the price is inside bullish wave E.
We have identified two specific entry levels for re-entering Cardano. At each entry level, you can take one step into a buy position.
The target is around \$1.20.
Please note that this analysis is based on the daily timeframe, so it may take some time to play out.
The invalidation level is the same as our stop loss. If this level is reached, the setup will be invalidated.
For risk management, please don't forget stop loss and capital management
Comment if you have any questions
Thank You

High-Quality ADA Long Setup (4H Chart)🚀 High-Quality ADA Long Setup (4H Chart)
This trade is forming on carefully marked zones and clear trends.
🔑 Key Highlights
1. 4H Resistance Zone
Price has tapped this strong resistance zone 5 times already.
The more it gets tested, the higher the probability it will break on the next attempt.
2. Entry Zone
We are not entering immediately — patience is key for high R:R setups.
Ideal entry lies between the 0.38 – 0.618 Fibonacci retracement levels.
A high-volume cluster around the 0.5 Fib level suggests that price may pull back here before gaining upward momentum.
Closely monitor this area on lower timeframes for confirmation.
3. Stop Loss (SL)
A long wick below the recent bearish candle indicates it’s unlikely price revisits that level before moving up.
This becomes our protective stop loss.
4. Target Zone
First target is the next major resistance on the 12H / Daily chart, depending on how candles close at higher timeframes.
📊 (Chart attached for reference)
⚡️ Final Note
I share one high-quality setup per week — remember, it’s the clarity of the setup that matters, not the outcome of a single trade.
(I also teach how to read candlestick behavior separately.)
