Is it a time for Cardano - 1 USD TARGETOn the Cardano (ADA/USDT, 4h) chart, after a previous decline, the price has stabilized around the $0.81–$0.82 zone, which represents a key support area. This level has repeatedly acted as a strong barrier against further declines and could now serve as a foundation for a potential rebound.
In recent sessions, the market has been moving within a narrow price range, suggesting a period of accumulation before the next significant move. The moving averages (EMA 20 and EMA 50) are close to each other, indicating that selling pressure is weakening. Additionally, the RSI has leveled off around the 40–50 range, signaling that the bearish momentum may be fading and the market could be preparing for a recovery.
If ADA holds above $0.81, there is a strong possibility of an upward move toward $0.87–$0.88, followed by a continuation to around $0.95, where a key technical and psychological resistance level is located.
In summary:
The current price action suggests the formation of a local bottom. Holding the $0.81 support zone could trigger a bullish wave, with a near-term target around $0.95 USD.
Potential TP - 0.95 $
Trade ideas

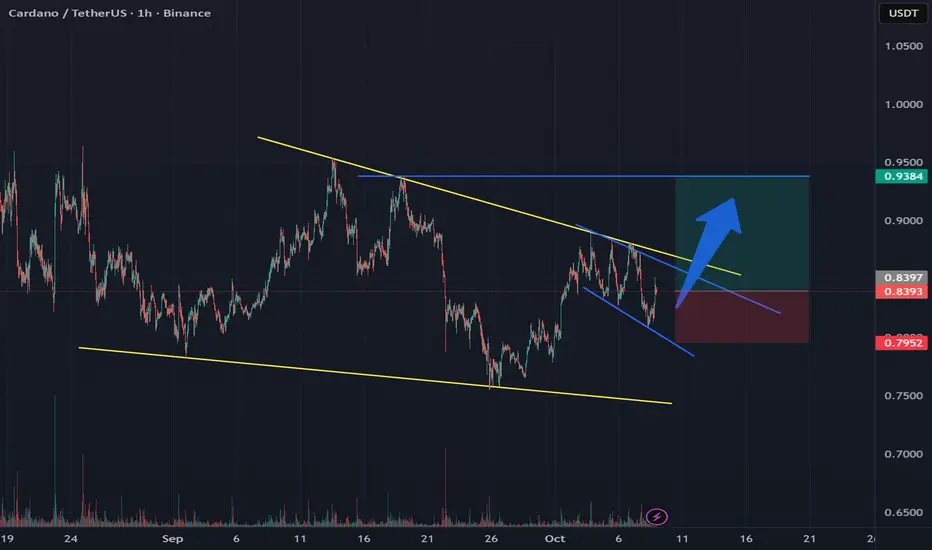
ADA forms double bullish wedge patternsADA has formed a bullish falling wedge pattern on the global timeframe, within which a local bullish expanding falling wedge pattern has formed
If the local pattern plays out, the price will immediately break through the global pattern, causing a high-probability upward movement
Current price: $0.8397
If the local pattern plays out, the price could reach $0.8600 , then if the global pattern is broken, the price could move higher
If the price declines and breaks through the lower boundary of the local pattern at $0.7952 , the price could fall to the lower boundary of the global pattern, causing the price to continue moving within the global pattern, and the local pattern would be broken
More detailed analysis, additional charts, and key levels to watch are available on our site
ADAUSDT 1D#ADA is trading within a symmetrical triangle on the daily chart and is currently trying to hold the price above the daily SMA100. Consider entering this coin after a solid breakout above the triangle resistance. In that case, the potential targets are:
🎯 $0.9378
🎯 $0.9945
🎯 $1.0512
🎯 $1.1320
🎯 $1.2348
⚠️ Always remember to use a tight stop-loss and maintain proper risk management.

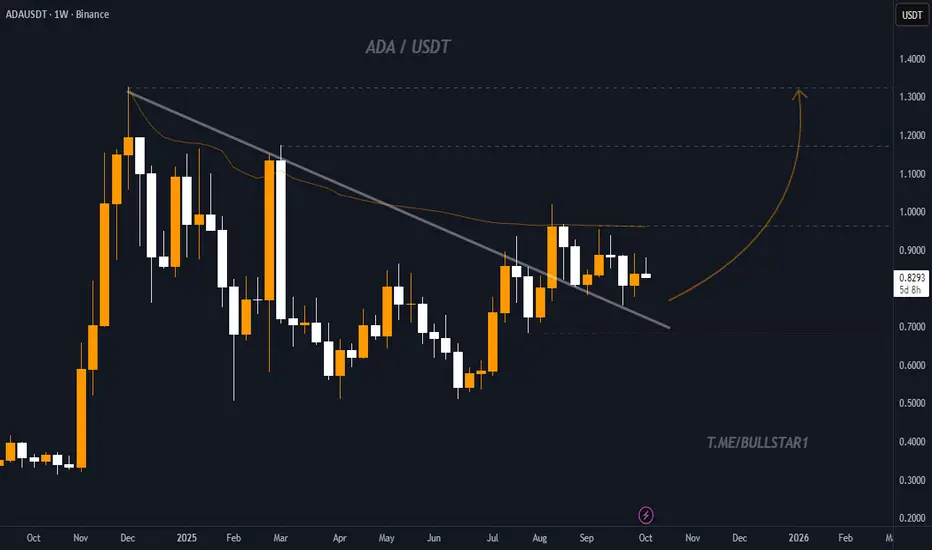
ADA / USDT – Weekly Breakout Structure Forming Toward $1.30Cardano (ADA) is showing early signs of a potential mid-term breakout after months of consolidation.
On the weekly chart, price has broken above the descending trendline that acted as resistance since early 2025. The candles are now forming a higher low structure, suggesting accumulation before a new impulse move.
The chart indicates a possible continuation toward the $1.00–$1.30 zone in the coming weeks if momentum strengthens and BTC maintains stability. The key resistance levels are $0.95 and $1.30, while support lies around $0.70.
- Trade Idea:
- Entry zone: $0.80 – $0.83
- Target 1: $0.95
- Target 2: $1.30
- Stop Loss: Below $0.70
This setup aligns with the broader market recovery phase and potential altcoin rotation expected in Q4 2025. Patience and proper risk management are advised as ADA continues to build momentum above the breakout structure.
ADAUSDTADAUSDT
I expect price to go down a little bit and fill up the fvg, after that i expect the price to hit the fib lvl 0.618 and from there to go up.
It is possible to hit also the fib lvl 0.5 and from there to take off.
Buy order from the fib lvl 0.618 with sl under the OB and tp at around 0.950 with tp 50% when the price hit the trendline

ADA IS BULLISH Ada Breaks 1hr resistance , that is a good Bullish signal to go long targeting daily order block

Cardano Price Gains Capped by Long-Term Holder PressureCardano’s price currently trades at $0.87, hovering just below its immediate resistance of $0.88. The token remains approximately 14% away from the psychologically important $1.00 level, a threshold that could reignite market enthusiasm if successfully breached.
Given the mixed outlook from investors and technical indicators, ADA is likely to continue its sideways movement. The cryptocurrency may remain rangebound between $0.83 and $0.88 until decisive buying volume emerges.
However, if long-term holders pause their selling and market sentiment improves, ADA could break past the $0.88 barrier and rise toward $0.93. Such a move would restore bullish confidence and potentially pave the way for a broader recovery phase in the weeks ahead

ADA Multi-Year Downtrend Nearing EndCardano CRYPTOCAP:ADA is forming higher lows and looks ready for a big breakout once it moves above the red resistance line. Price is currently in the accumulation zone, which means smart money might be loading up here.
Plan:
Buy Zone: Between 0.75 and 0.88
Stop Loss: Below 0.66 (if it drops there, the setup fails)
Targets:
TP1: 1.09
TP2: 1.35
TP3: 1.70
TP4: 2.18
TP5: 3.10
Strategy:
Start with a small position here. Add more only after a confirmed breakout above 0.90.
Once the first target hits, book some profits and move your stop loss to entry.
Note:
This is a long-term setup, could take several months to play out. Always do your own research (DYOR).

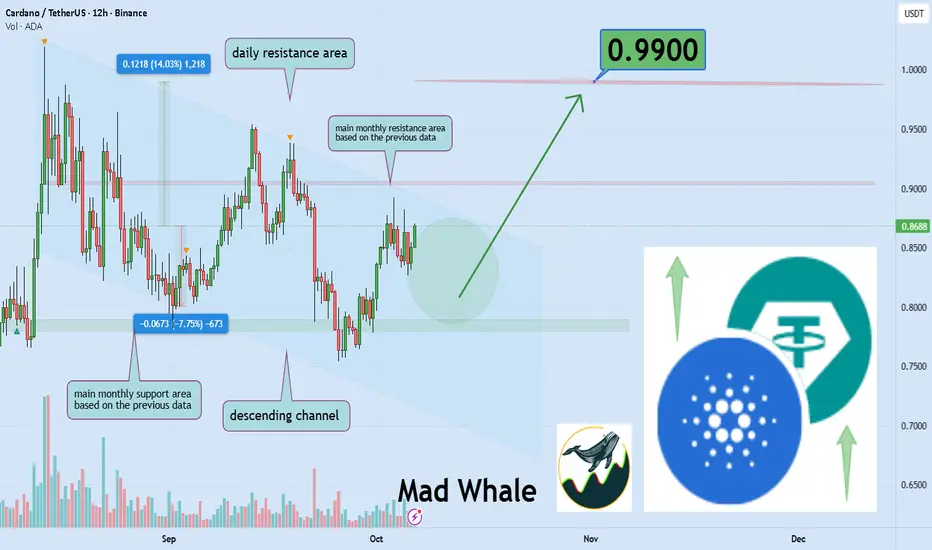
Cardano close to Critical Resistance, Targeting 14% Move to $099Hello✌️
Let’s analyze Cardano’s price action both technically and fundamentally 📈.
🔍Fundamental analysis:
Cardano (ADA) is moving forward with major upgrades focused on speed and scalability. If completed smoothly, it could strengthen ADA’s network use and ecosystem growth. 🔗
📊Technical analysis:
BINANCE:ADAUSDT is testing the top of its descending channel and a strong monthly resistance; a clean breakout could drive a 14% rally toward $0.99. 📈🔗
📈Using My Analysis to Open Your Position:
You can use my fundamental and technical insights along with the chart. The red and green arrows on the left help you set entry, take-profit, and stop-loss levels, serving as clear signals for your trades.⚡️ Also, please review the TradingView disclaimer carefully.🛡
✨We put love into every post!
Your support inspires us 💛 Drop a comment we’d love to hear from you! Thanks, Mad Whale
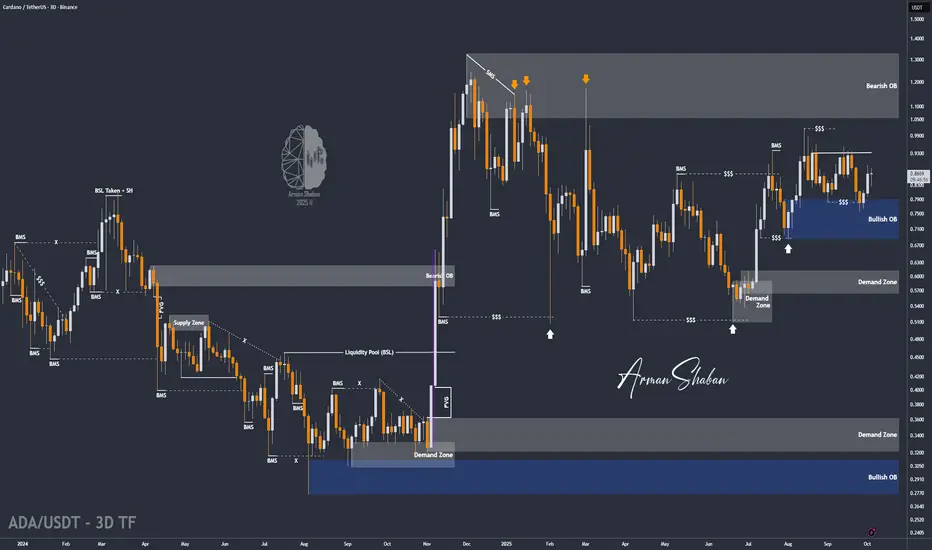
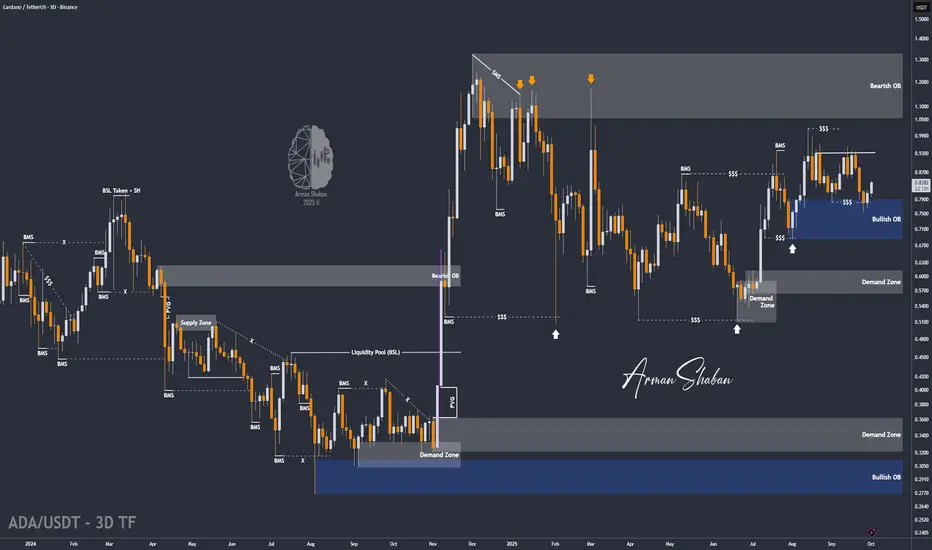
ADA/USDT | ADA Keeps Rising – Ready for the $1 Breakout?By analyzing the Cardano (ADA) chart on the 3-day timeframe, we can see that the price has continued its strong upward move as expected and is now trading around $0.87, just a step away from hitting the next target at $0.95.
The momentum remains strong, and I expect to see even more bullish movement soon.
Short-term upside targets are $1.00, $1.05, $1.17, and $1.33.
Please support me with your likes and comments to motivate me to share more analysis with you and share your opinion about the possible trend of this chart with me !
Best Regards , Arman Shaban
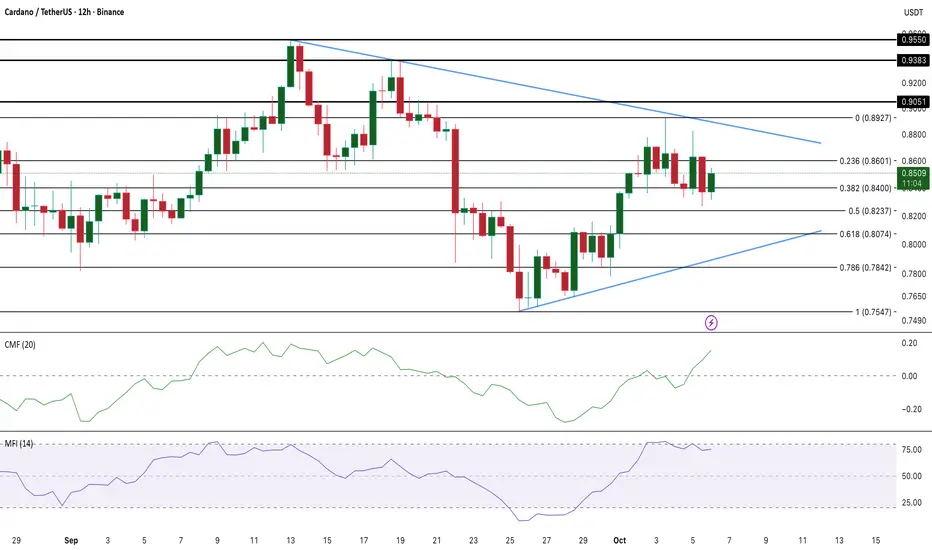
Cardano Price Analysis Hints at Breakout Beyond $0.89 BINANCE:ADAUSDT (ADA) is coiling near a key decision point after days of tight trading. The ADA price is hovering around $0.83, caught inside a symmetrical triangle that signals indecision between buyers and sellers. On the chart, resistance sits between $0.86 and $0.89, while support holds near $0.82 and $0.78.
A daily close above $0.89 would confirm a breakout, setting up a potential rally toward $0.93 and $0.95. The structure remains valid as long as the $0.78 support zone holds firm.
Momentum indicators on TradingView show a mixed picture. The Chaikin Money Flow (CMF) recently turned positive at 0.12, hinting at steady inflows from large buyers. However, the Money Flow Index (MFI) is slipping, making lower highs that reveal weak retail participation. This divergence—big wallets accumulating while smaller traders hold back—explains the current sideways movement.
On-chain data supports this cautious optimism. Whale addresses holding 10 million–1 billion ADA have added roughly 70 million ADA (about $59 million), suggesting quiet accumulation. But until the price clears $0.89, Cardano remains in wait-and-see mode.
A clean breakout above $0.89 could finally flip BINANCE:ADAUSDT sentiment bullish, while a drop under $0.78 risks invalidating the setup.

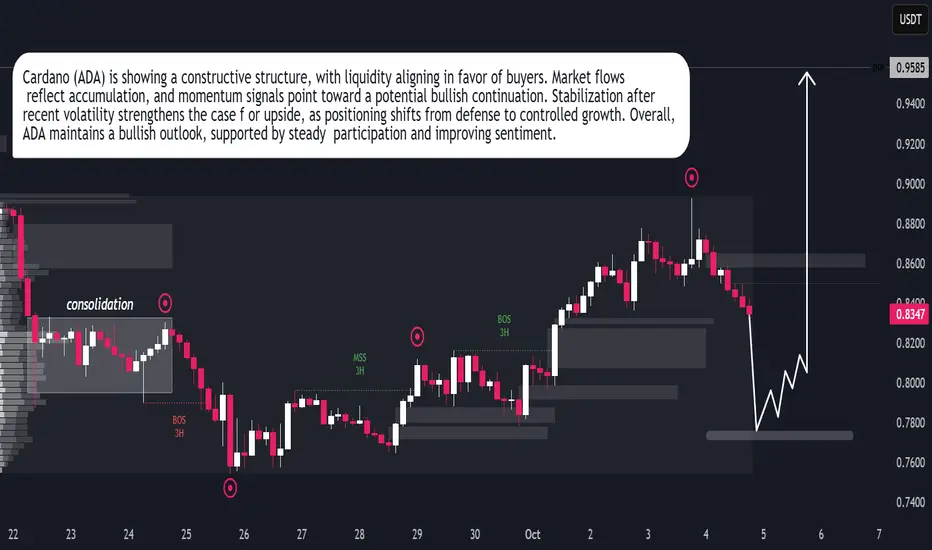
Cardano (ADA) Ready for Bullish ExpansionCardano (ADA) Ready for Bullish Expansion
Cardano (ADA) is building strength as market conditions favor accumulation over distribution. Liquidity behavior shows steady inflows, suggesting participants are positioning for upward continuation. The recent stability reflects confidence, with sentiment gradually tilting toward growth. Momentum indicators align with this view, reinforcing the prospect of a bullish expansion phase. ADA’s structure signals resilience, and the market tone supports the case for sustained upside in the near term.
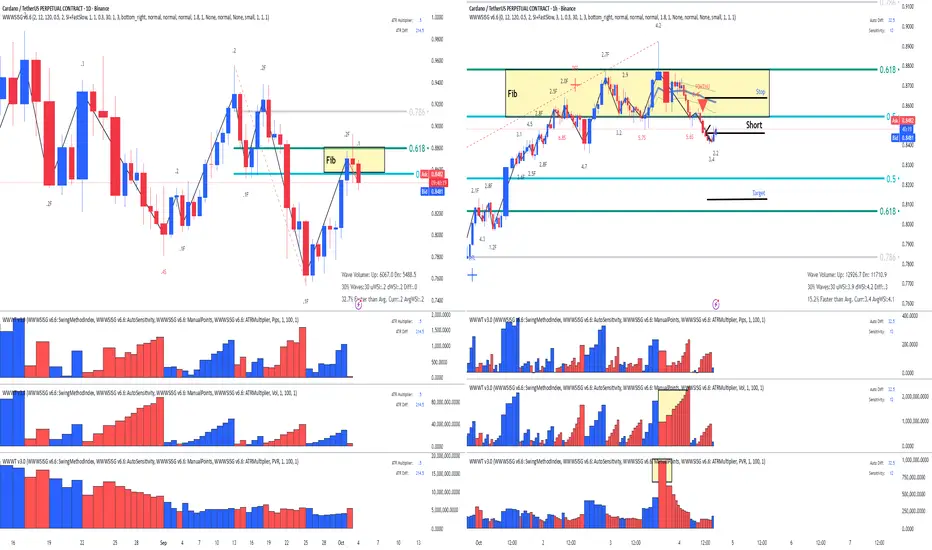
ADA- Cardano - Entered Short - This is Why!On the Left is the Daily Chart and the Location is a Fib Area.
Analyzing the 1Hr chart for my entry:
1. As previous said Location is Fib - this is a great location for seller to come in
2. Fake Break on Fib 61.8
3. Indcreasing PVR on the up wave as we approach Fib 61.8 and High PVR volume at the top.
4. Hightest down volume wave after a very long time
5. Placed AVWAP and waited for a Plutus short singal below it
6.... and finally the short signal arrives PDHTMU (Push Down and then Hard to Move Up) with a high Speed Index of 8.4S
Target in the middle of Fib, but as long as we get to 50Fib we move are stop to breakeven or trail it.
Enjoy!
ADA/USDT: Holding Trendline Support with Breakout Setup FormingADA/USDT is holding above the 0.8135 upward trendline following a pullback from resistance, signaling early signs of stabilization. The current structure shows lower highs capped by a red descending trendline, while projection points suggest a potential breakout toward the 0.9385 level.
As long as the 0.8135 support remains intact, the bullish outlook stays in play, favoring continuation toward 0.9385, with momentum building for a possible challenge of the 1.0212 resistance zone. Buyers appear to be gradually regaining control.
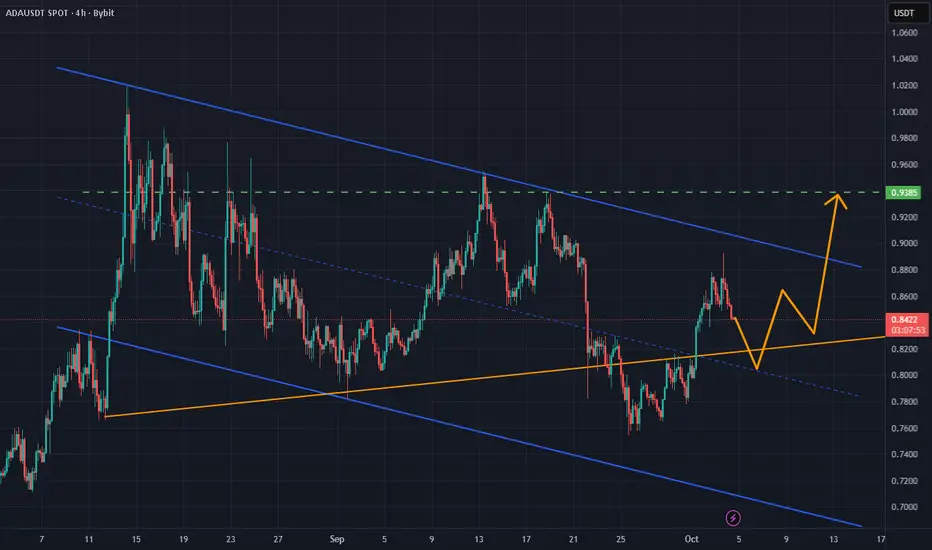
Lingrid | ADAUSDT Next Rally Phase Bull ContinuationBINANCE:ADAUSDT is stabilizing above the 0.8135 upward trendline after a pullback from resistance. Price action shows a sequence of lower highs capped by the red trendline, while the blue arrow projection signals potential breakout toward 0.9385. As long as 0.8135 holds, bullish continuation toward 0.9385 remains favored. Momentum structure suggests buyers are preparing to challenge the resistance zone near 1.0212.
⚠️ Risks:
A breakdown below 0.8135 could shift bias back to the 0.7412 support.
Broader crypto market weakness may cap upside momentum.
Unexpected macroeconomic or regulatory news could trigger volatility against the setup
If this idea resonates with you or you have your own opinion, traders, hit the comments. I’m excited to read your thoughts!

ADA - The goal has been achieved and broken. Next goal in focusThe target is in sight but the volume profile does not confirm, which means it can go higher
ADA/USDT | ADA Breakout Setup – More Upside AheadBy analyzing the Cardano (ADA) chart on the 3-day timeframe, we can see that the price has started to rise as expected and is now close to the first target at $0.85, giving us more than 11% gains from the previous analysis so far.
All other points from the last analysis remain valid. The next short-term targets are $0.95 and $1.00, while the mid-term targets are $1.05, $1.17, and $1.33.
Please support me with your likes and comments to motivate me to share more analysis with you and share your opinion about the possible trend of this chart with me !
Best Regards , Arman Shaban
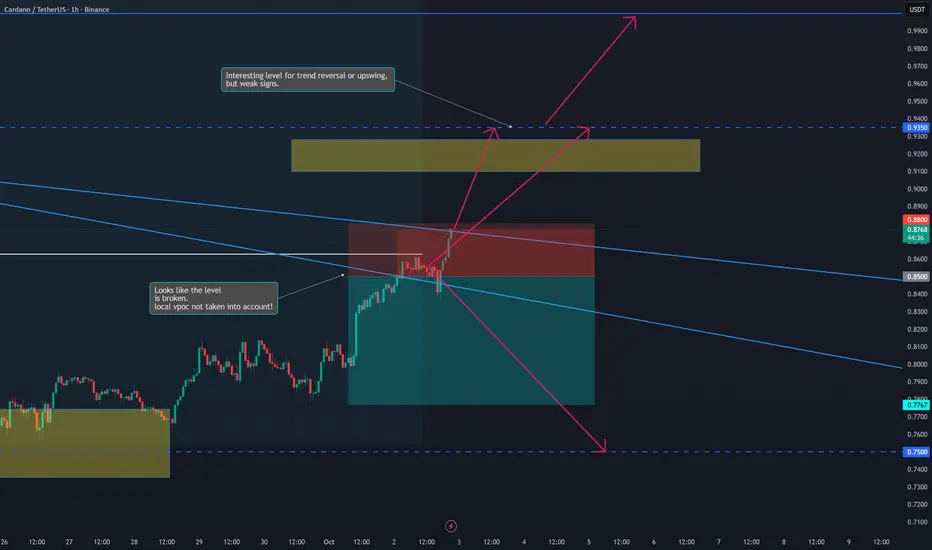
ADA update.The target was reached, but it couldn't hold.
I hadn't taken the local POC into account.
This means that several strategies are fighting against each other, and it's possible that the course will still turn, but very imprecisely.
The POCs are levels that have a strong pull, but often also serve as a boost.
Like a star that attracts objects, and if they aren't captured in its orbit, they are swept away with momentum.
They are very unsuitable for turning entries.

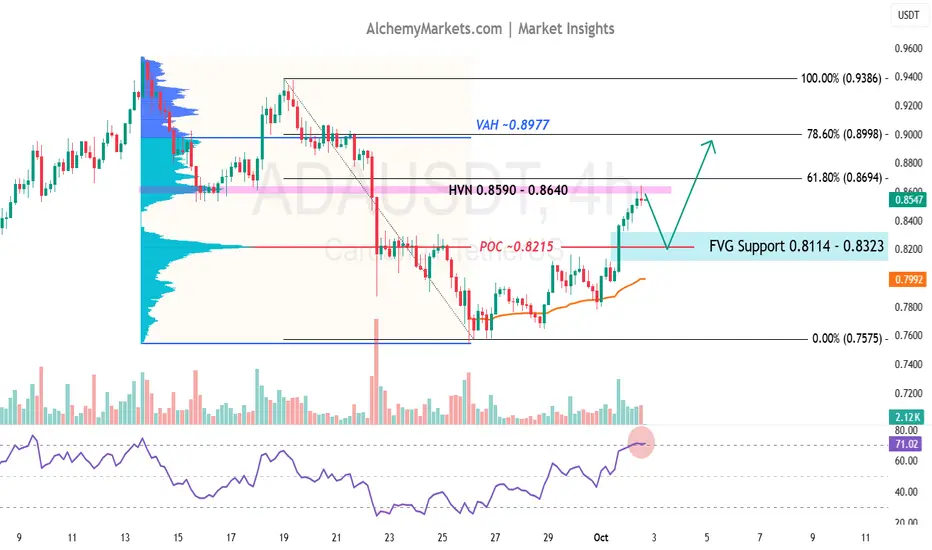
ADA/USDT – Simple 4H Analysis with Potential UpsideADA/USDT – Simple 4H Analysis with Potential Upside
As crypto rallies off the back of the government shutdown, ADA has convincingly reclaimed a critical Point of Control (POC) at $0.8215 . That means the heaviest traded level from the last down-leg couldn’t reject price — a bullish sign.
Now ADA is pressing into resistance: a high-volume node overlapping with the 61.8% retracement of the down-move.
Adding to the bullish bias is the 4H Fair Value Gap (FVG $0.8114–$0.8323) , which aligns neatly with the POC. But note: candles are shrinking on this grind higher, hinting a pullback may come first. That FVG is the zone to watch if it does.
📌 Levels to watch
$0.8114–$0.8323 – FVG support / POC
$0.8590–$0.8640 – HVN / 61.8% fib resistance
$0.8977–$0.8998 – VAH / 78.6% fib resistance
Key takeaway: ADA could retrace from here or a little higher at the 61.8% retracement , where volume-backed resistance sits. If it does, keep an eye on the FVG/POC support to provide a bounce and set up a test of the VAH — a critical level as it aligns with the weekly trendline.
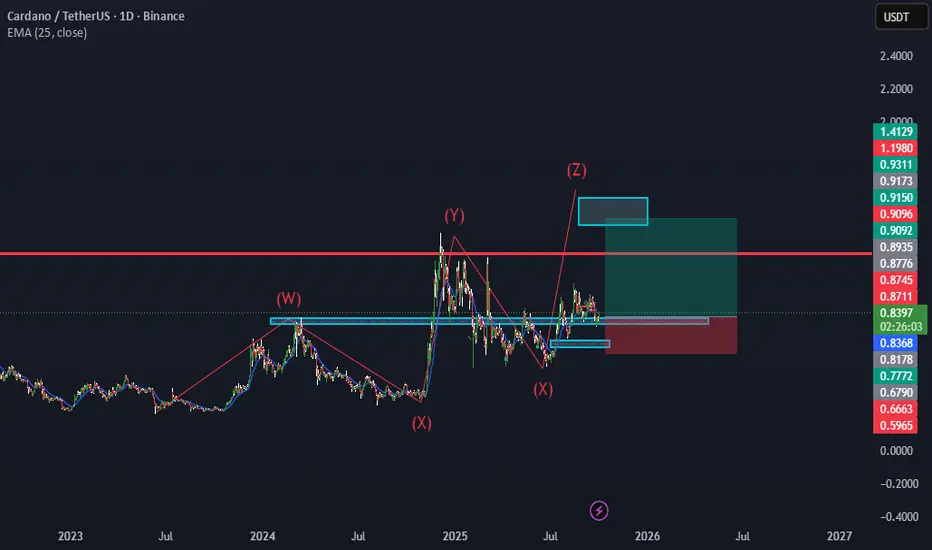
Ada WILL CONTINUE TO Z ,after the impulsive waves that carddano made will we see the wave z to continue the trend
ADA Possible turnaroundPossible turnaround. Some things point to a short-term turnaround, but could also serve as a boost. Definitely potential for movement.

Cardano: Still Boring or Finally Ready to Move?🧐🔁 Cardano: Still Boring or Finally Ready to Move? 🚦📈
Welcome to the Altcoin Series, kicking off this weekend with none other than Cardano (ADA).
Later on I will explain why i will be 'Divorcing Alts' and just trade them, but that time will be at the cycle end, not now.
It’s Saturday, July 12th — a classic retail weekend after a solid macro pump. Salaries are hitting accounts, the charts are alive again, and it's time to look at structure over sentiment.
🔍 A Personal Note on ADA
I was fortunate to exit near the top during the Cardano Summit in Athens (2021) — not just due to chart structure, but after meeting with developers and understanding how deeply Haskell shapes this ecosystem. And what a challenge that seemed!
Haskell, while academically impressive, has proven difficult to scale, and in practice, it's slowed down development. Expectations were sky-high, but reality hit hard. And let’s be honest — Cardano has been boring for years.
But that boredom may be hiding something...
I’ve still been 'going Long' under key levels, because when you zoom out — Cardano is still U.S.-centric , regulation-aware, and deeply rooted . In a time when the U.S. might look to lead crypto adoption, especially with figures like Trump signaling support , Cardano could become part of that narrative.
⚙️ Technical Setup
The recent pump from Nov–Dec 2024 was rejected right at $1.193 — our second test of that critical resistance. But now, we’re staring down a potential third test, with Test #3 marked on the chart near $1.15, and this time, the context is shifting.
✅ TOTAL3 structure is bullish
✅ Retail energy is back
✅ Altcoin momentum is quietly building
🔑 Key Levels
Support Zone:
🟢 $0.70–$0.71 — the current base to hold
Target Zones:
🔹 $1.15–$1.19 — Third test of resistance
🔹 $1.47
🔹 $1.89
🔹 $3.02
🔹 Top Extension Target: $3.65
A break above that descending level could turn this "boring" coin into one of the cleanest long continuation setups of the cycle.
📌 We trade technicals, not hope:
✅ Buy over support
✅ Exit under resistance
✅ Control risk, always
So… will Cardano keep boring us? Or is it finally time for a show?
One Love,
The FXPROFESSOR 💙
