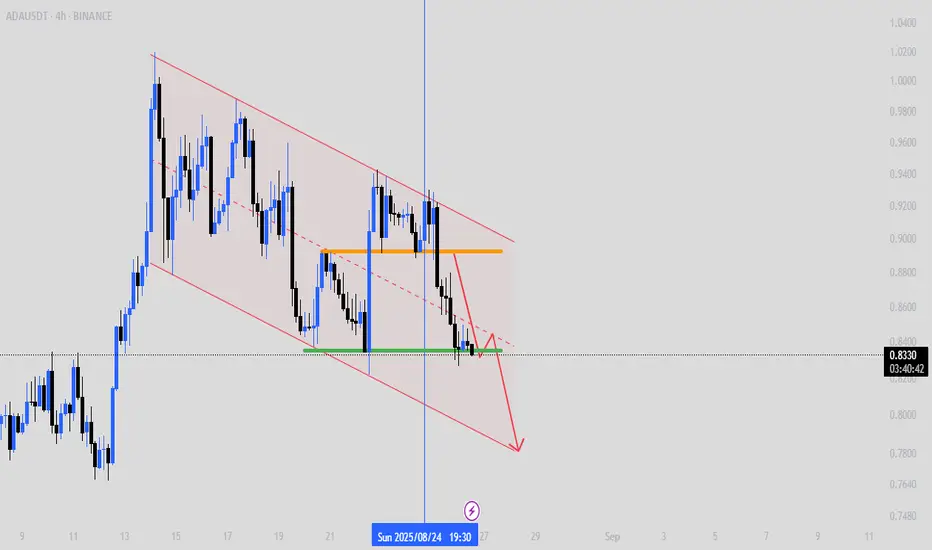
ADA Cardno Possible retracement into the purple rectangle .
like previously , it might be a turning point for ADA .
$0.96 Breakthrough is a positive sign for ADA = LONG
Trade ideas

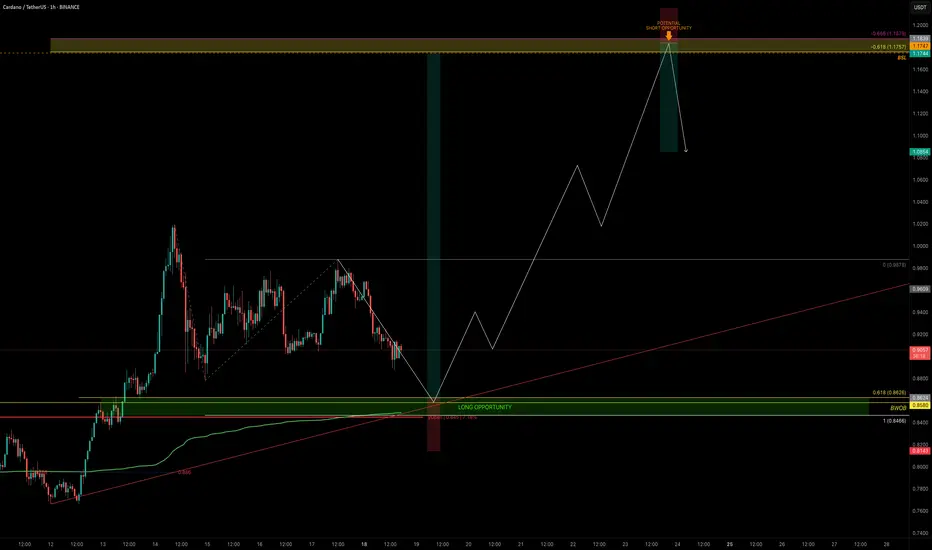
ADA — Is Cardano Ready to Break $1?ADA is coiling just beneath the $1 psychological barrier. The chart is setting up for a decisive move: the high-probability long entry aligns with the yearly open (yOpen), supported by multiple confluences.
🧩 Confluence Factors: 7
Yearly Open (yOpen): $0.845
1.0 Trend-Based Fib Extension: $0.8466 (aligned with yOpen)
Weekly Bullish Order Block: $0.8580
0.618 Fib Retracement: $0.8626
Anchored VWAP (green line): Supporting this zone
Sell-Side Liquidity (SSL): Positioned below recent lows
0.886 Fib Speed Fan: Adding further structural support
🟢 Long Trade Setup
Entry Zone: $0.863 – $0.847
Stop-Loss: Below yOpen (~$0.84)
Take-Profit Zone: $1.1747 (Buy-Side Liquidity sweep)
R:R: 1.6+ depending on SL placement
🔴 Short Opportunity
A secondary setup could arise on a sweep of the key high ($1.1757–$1.1879 BSL zone). This would only be valid with confirmation of rejection.
Entry Zone: After sweep/rejection above $1.1747
Stop-Loss: Above ~$1.20 (post-sweep rejection)
Target: Around $1.10
✍️ Confirmation is critical: the long requires strong defense of the confluence zone, while the short requires a failed breakout and rejection above key high (BSL).
Key Levels to Watch:
Support Zone: $0.863 – $0.847
Resistance / GP Zone: $1.1757 – $1.1879
🔍 Indicators used:
DriftLine — Pivot Open Zones → For identifying key yearly/monthly/weekly/daily opens that act as major S/R reference points
➡️ Available for free. You can find it on my profile under “Scripts” and apply it directly to your charts for extra confluence when planning your trades.
_________________________________
💬 If you found this helpful, drop a like and comment!
ADA Setup – Double Bottom at 61.8% FibADA has retraced to the 61.80% Fibonacci support while forming a double bottom—a setup that’s typically bullish. This confluence zone has often acted as a springboard for reversals and could offer a favorable long spot opportunity if support holds.
Trade Setup:
Entry Zone: $0.75 – $0.82
Take Profit Targets:
🥇 $0.98 – $1.15
🥈 $1.50 – $1.60
Stop Loss: Close below $0.72

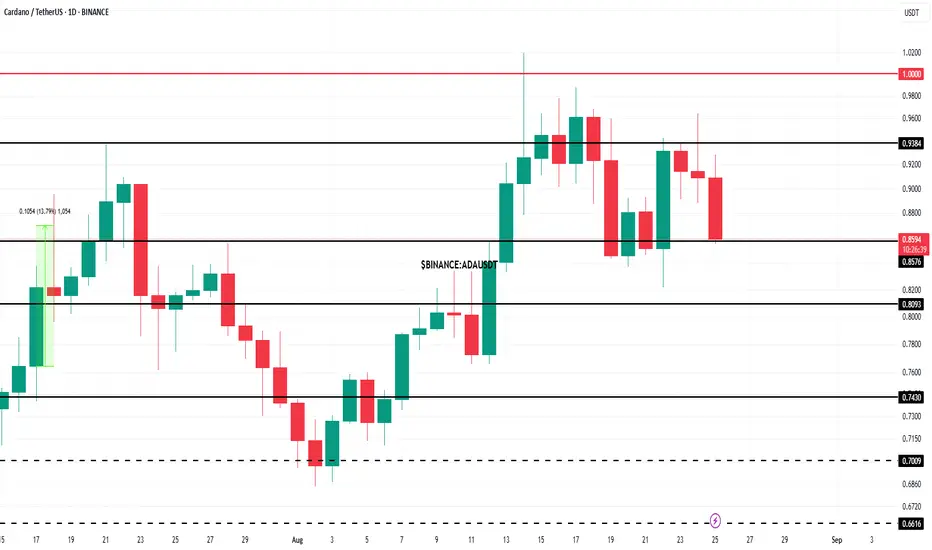
ADA/USDT | Cardano (ADA) Eyes Further Gains – Key Targets Ahead!By analyzing the Cardano (ADA) chart on the 3-day timeframe, we can see that after a corrective move down to $0.83, the price has gained strong buying momentum and has so far managed to rise to $0.87. If the price can hold above this key support level, we can expect further bullish continuation.
The potential upside targets are set at $0.93, $1.00, and $1.05.
Please support me with your likes and comments to motivate me to share more analysis with you and share your opinion about the possible trend of this chart with me !
Best Regards , Arman Shaban

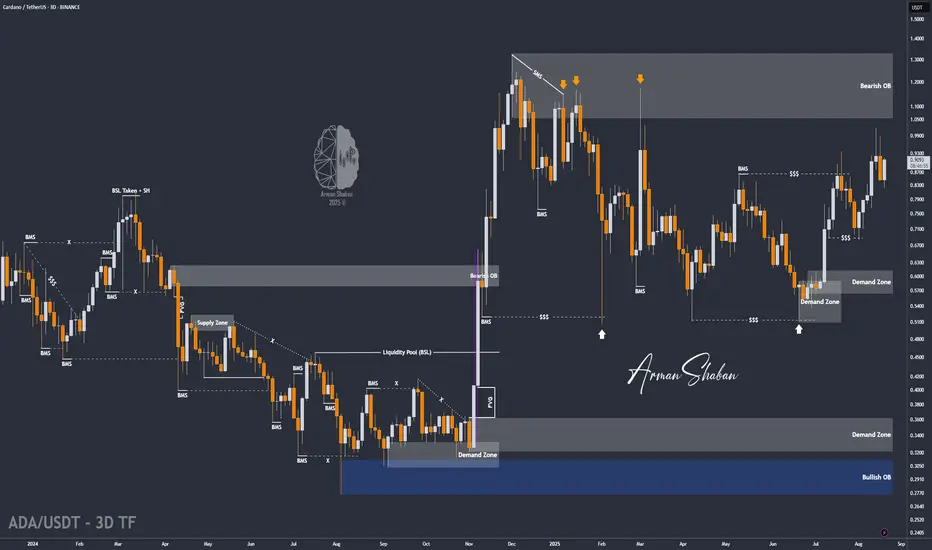
ADA Cardano to make a new ATH?!Cardano (ADA) is one of the OG cryptos from 2017 and also part of the US crypto strategic reserve as announced by Trump on 3/3/25. ADA|USD pair needs to break the key $5 level for it to make higher new ATHs. Price action on ADA is about to moon as it starts to make its wave 3 move.
ADA.D is currently at c. 0.8% dominance of the crypto market. When Alt Season kicks off, I expect ADA.D to top out around 3.4% - 4.4% of the crypto market. If ADA was to make a new ATH in dominance it would be around 5% and above. Keep an eye out on these levels as potential sell ranges. If things got 'stupidly' bullish, It could reach up to 7% as a key grand fib level.
ADA|BTC pair, currently presenting an inverse head and shoulders and getting closer to the neckline. Which is a bullish sign for ADA.D as it should make its wave 3 move in ADA|BTC pair.
Cardano (ADA) USD Targets:
Target 1: ~$5.00
Target 2: ~$8.20
Target 3: ~$13.50
Target 4: ~21.50 (Moonshot)
ADA : BUY OR SELL?Hello friends
Well, after the decline we had, the price was able to create a small channel in the specified support area, which indicates the accumulation of the price, and if the support is maintained and the channel is broken, the price can move to the specified targets.
Otherwise, and if the support is broken, the decline will continue with a valid formation...
*Trade safely with us*

Cardano's Long-Term Setup Looks Too Clean to IgnoreCRYPTOCAP:ADA (Cardano) is forming a strong bullish structure with clear higher lows and is now approaching a major monthly resistance trendline. This setup hints at a potential breakout.
The $0.35–$0.40 zone has held well as support, and if ADA breaks above the red resistance line, it could signal the start of a long-term uptrend. Momentum is quietly building.
DYOR, NFA
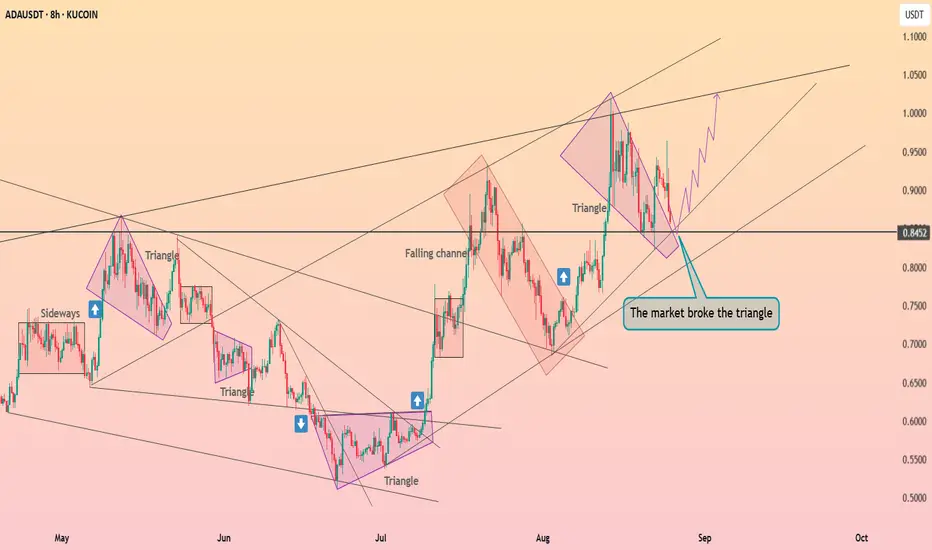
Cardano broke the triangle ┆ HolderStatBINANCE:ADAUSDT on the 8h timeframe broke cleanly out of a triangle pattern around $0.85. The market had earlier respected support from a falling channel and is now showing a bullish structure of higher lows. Continuation above $0.88 could trigger a rally toward $0.95 and $1.00, while maintaining $0.84 as the key invalidation level.
ADAUSDTThis symbol was tested on the blue vertical line, my idea was that the channel would break from the top and the price would go up, but it didn't. Now you can act according to the red arrow. That is, if it reacts to the middle of the channel and falls, then enter after breaking the green line.
ADA Correction Finds Support at $0.84, Eyes ContinuationCardano (ADA) has corrected back toward the $0.84 region, a zone of strong confluence with the 0.618 Fibonacci retracement and the 50-day moving average. If this support holds, ADA could resume its bullish structure and target the $1.19 level in the coming sessions.
After a series of higher highs and higher lows, ADA has retraced into a critical support zone. The $0.84 level aligns with several technical indicators that often act as strong foundations for continuation within an uptrend. With the broader market leaning bullish and ADA respecting key structural levels, traders are closely watching whether this pullback will serve as a springboard for the next leg higher.
Key Technical Points:
- Support at $0.84: This level is backed by the 0.618 Fibonacci retracement and the 50-day moving average.
- Continuation Target $1.19: Holding this zone opens the path toward $1.19, the next upside objective.
- Bullish Market Structure: ADA continues to print higher highs and higher lows, keeping its uptrend intact.
Main Analysis:
The correction toward $0.84 is part of a natural retracement process within a bullish structure. Rather than weakening the trend, such pullbacks are often healthy, allowing the market to reset before continuation. The 0.618 Fibonacci retracement is a well-recognized technical level for reversals, especially when paired with the 50-day moving average, which is now acting as dynamic support.
Market structure also favors the bulls. ADA has consistently printed higher highs and higher lows, confirming the presence of sustained momentum. The ability of buyers to step in at increasingly higher levels signals confidence in the trend. As long as $0.84 holds as support, the probability of ADA rotating higher remains elevated.
The $1.19 level now stands out as the next logical target. This zone represents a measured extension of the current bullish trend and will likely act as resistance when tested. However, a break through this level would confirm ADA’s strength and open further upside potential.
Volume behavior will be crucial to watch. Declining volume during the pullback suggests that selling pressure may be weakening, while an influx of bullish volume at support would validate the demand zone and confirm market readiness for continuation. Should this occur, ADA’s path toward $1.19 becomes increasingly probable.
What to Expect in the Coming Price Action:
If ADA maintains support at $0.84, backed by the 0.618 Fibonacci and 50-day moving average, a bullish continuation toward $1.19 is likely. A decisive break above that target would reinforce ADA’s uptrend and pave the way for further gains. Conversely, a breakdown below $0.84 would weaken the bullish case and could trigger a deeper retracement before the uptrend resumes.

Cardano Price To Bounce As IOHK Audit Report Nears ReleaseBINANCE:ADAUSDT price is currently $0.85 , holding steady above the $0.83 support level. The Ichimoku Cloud shows a bullish outlook, suggesting positive momentum for ADA. Investors are keeping a close eye on price movements, with potential for further gains if market conditions remain favorable for the altcoin.
A key catalyst for potential price growth is the upcoming audit report of Input Output Global’s ADA holdings. Charles Hoskinson, BINANCE:ADAUSDT founder, requested the audit to address transparency concerns after allegations of $600 million in misappropriated ADA . The report could play a crucial role in boosting investor confidence and market sentiment.
If the audit report meets investor expectations, BINANCE:ADAUSDT could see a price increase, potentially pushing it to $0.90. Successfully securing this level as support may pave the way for further gains, reaching $1.00. Such a move would solidify Cardano's position and help avoid a drop below the $0.83 support level.
ADA USDT TARGET ZAMANI🌊🐋 Cardano (ADA) – The Giant Awakens for a New Era! 🐋🌊
💰 Current Price: $0.89 – this is just the ignition. The real fireworks haven’t even started yet.
🔥 ADA has been through accumulation, silence, and endless waiting. But every cycle tells the same story: once ADA breaks its chains, it moves with unstoppable force. This time, the targets are not small – whales are looking far beyond $1, beyond $2… straight into the legendary $3+ zone.
🎯 Whale Targets Ahead:
$1.05 → First breakout confirmation – the spark that ignites the fire.
$1.25 → Whale accumulation phase – where big money enters aggressively.
$1.45 → Momentum explosion – ADA turns into a rocket. 🚀
$2.00 → Psychological barrier – massive FOMO triggers retail rush.
$2.50 → Acceleration zone – liquidity floods in, whales dominate the market.
$3.20 → Final Moonshot 🌕✨ – ADA completes its full cycle and proves once again why it’s called a sleeping giant.
⚡ Why Whales Love This Setup:
1. Deep liquidity pools = easy accumulation.
2. Strong breakout structure = perfect technical entry.
3. Market sentiment shifting = ADA back on everyone’s radar.
⏳ The clock is ticking. Whales don’t wait for confirmations, they create them. By the time the crowd realizes, ADA will already be sprinting past $2 on its way to $3+.
🚀 ADA isn’t walking… it’s preparing for liftoff.
The only question: will you ride with the whales, or watch them disappear into the skies?

ADAUSDTI have conducted a technical analysis of 1150 using the Janne School methodology, combining both numerical and temporal analysis. Based on my findings, I believe that 1150 is poised to reach a target price of 44 rs. My analysis incorporates various

ADAUSDTmy entry on this trade idea is taken from a point of interest below an inducement (X).. I extended my stoploss area to cover for the whole swing as price can target the liquidity there before going as I anticipate.. just a trade idea, not financial advise
Entry; $0.8472
Take Profit; $0.9872
Stop Loss; $0.8260

ADA Long to 2$ADA Long to 2$
as this coin is in the channel I expected to move to the top of channel again and then it will reached to 3$.

adausdt short trade i didnt get confirmation to short but i think in this zone it has great potential to reverse price and going down
lets see what happen

ADAUSDT – TECHNICAL BUY CALL | 1D TF | 6:45 PM GMT ADAUSDT – TECHNICAL BUY CALL | 1D TF | 6:45 PM GMT
The coin recently broke structure on the bullish side, pulled back, and then surged in a spike fashion, achieving a high of 1.016. After a retest and another pullback, the pullback now seems to be over, and the coin is ready to move upward.

ADA/USDT | Cardano Breaks All Targets – Next Stop: Above $1?By analyzing the Cardano (ADA) chart on the 3-day timeframe, we can see that the price has surged exactly as expected, beautifully hitting all three targets at $0.85, $0.93, and $1! This move delivered an impressive 48% return. Following Jerome Powell’s remarks about the possibility of interest rate cuts in the coming months, Cardano saw renewed demand and has already risen from $0.82 to $0.91 so far. I expect this bullish momentum to continue, with a potential break and hold above the $1 level soon.
Hope you made the most out of this analysis!
Please support me with your likes and comments to motivate me to share more analysis with you and share your opinion about the possible trend of this chart with me !
Best Regards , Arman Shaban
Cardano aims to reach $1 ┆ HolderStatBINANCE:ADAUSDT is forming a bullish structure with consistent higher highs and lows. Buyers remain in control, with potential continuation toward $1.00–$1.05. As long as the market holds $0.85 support, trend structure favors bullish outlook.

ADAUSDT - LONG? - Passive Buyers Absorbing Aggressive BearsHi all!
ADAUSDT looks primed for an upside breakout in continuation of its higher timeframe trend. Price has been compressing and consolidating around 0.8500 — which lines up with the 0.5 HTF Fibonacci retracement.
📌 Upside Targets:
First objective: sweep the weak high from 14 August and fill the imbalance around 1.0400.
If sentiment stays bullish, the next target is the 1.1000 zone, which aligns with the 0.886 HTF Fibonacci retracement.
📌 Entry Trigger:
Look for a 1H close above 0.8700. That would confirm short-term bullish sentiment and open the path higher.
📌 Confluences Supporting the Long Bias:
Fibonacci Confluence → 0.5 retracement support at 0.8500 + 0.886 retracement at 1.1000.
Intermarket Correlation → ADA has a ~85% correlation with ETHUSDT and a ~79% correlation with BTCUSDT. With ETH showing bullish structure, ADA statistically tends to follow.
Open Interest Dynamics → OI has been bleeding out since 20 Aug, yet price barely reacts. Leverage is being flushed out, but spot/passive buying keeps absorbing liquidity.
CVD Data → Both CVD spot and CVD futures are trending down while price holds firm and even swings higher. This hidden bullish divergence = absorption in action.
📌 Invalidation:
A daily/1H close below 0.8420 invalidates the setup.
⚠️ My View:
The confluence here is strong — Fibonacci structure, intermarket correlation, OI flush, and CVD absorption all point to underlying strength. Until 0.8420 breaks, I’m leaning bullish with eyes on 1.0400 first, then 1.1000.

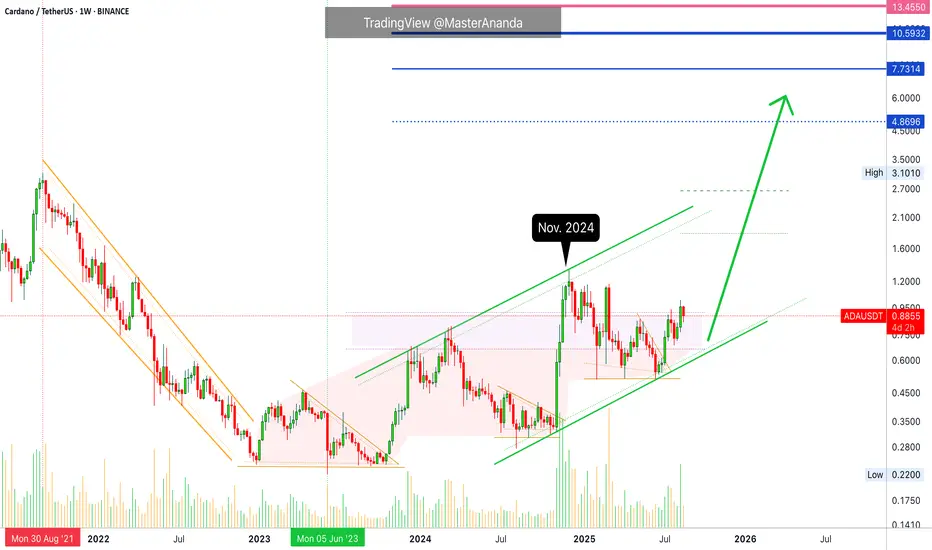
Cardano Bullish · Remember The Bigger Picture (Long-Term Growth)Remember the bigger picture, Cardano is growing.
Good afternoon my fellow Cryptocurrency trader, I hope you are having a wonderful day.
The rise started in June and so far we have only a very small wave. If you look back at November 2024 you can see how much growth was produced in just four candles, really strong.
The fact that this move started fast and had too much force, also meant an early demise and this led to a correction. The new wave started in June and four weeks green is only a small advance. After these four weeks green in early July we have two red weeks followed by additional growth.
Now we have a total of 9 candles since the June low. Compare this to the November 2024 wave, it had 5 candles total, the entire move. Here comes the alternation.
The previous wave was short in duration, fast and steep. The current wave will be long in duration and take its time to develop. Cardano has been rising not since June 2025 nor August 2024 but since June 2023, a very strong and prolonged bullish cycle. We are only missing a bull run phase. The market is in no hurry though, it can produce a bull run phase in two months just as it can do it in six months. We will know better as the bull market unravels.
Last week ADAUSDT produced the highest volume since last year on a single session. This is pretty good and interesting. This volume comes up after the move is already a month old. The volume is higher than normal but not super high. This tells us that whatever is happening now is only the start of something bigger.
Cardano will continue growing is the message coming from this chart. Cardano has so much more to give. How will it all develop? I don't know. But I can tell you that Crypto will continue to grow, the charts are saying long-term... We will see how it goes.
Namaste.
CardanoAda usdt daily analysis
Time frame 4hours
Risk rewards ratio >4.2 👈👌
Target 1.2 $
The great asset to hold and trade one of the 10 tops

