Trade ideas

Rising Wedge Forms — Potential Rejection on ADAPrice action is currently trading within a rising wedge pattern, a structure that is typically bearish and often precedes corrective moves.
The market is now testing key resistance, which aligns with both the 0.618 Fibonacci retracement and a lower-high structural barrier, forming a strong confluence zone where rejection is likely.
- Bearish Formation: The rising wedge suggests weakening bullish momentum.
- Resistance Confluence: The 0.618 Fibonacci and lower-high structure align at current resistance.
- Downside Target: A rejection from this zone opens the probability of a rotation toward $0.51 daily support.
From a technical standpoint, this setup indicates that upward momentum is losing strength, with limited space for continuation unless resistance breaks decisively.
If rejection confirms, traders should anticipate a pullback toward $0.51, completing the wedge breakdown and resetting the next major support test.

ADA/USDT | Cardano Climbs 20% – Can Bulls Push It Above $0.70?By analyzing the Cardano chart on the 3-day timeframe, we can see that after dropping to $0.49, the price found strong demand and rallied up to $0.60.
Currently, ADA is trading around $0.58, and we need to see if it can hold above $0.55. If it does, we can expect a bullish continuation toward the $0.70+ levels. This analysis will be updated soon!
Please support me with your likes and comments to motivate me to share more analysis with you and share your opinion about the possible trend of this chart with me !
Best Regards , Arman Shaban

ADA Retraces to Key Support | Long Spot OpportunityCardano (ADA) has retraced into a major support zone between $0.50 – $0.52, a level that previously acted as a strong base for bullish moves. This pullback could offer a high-probability long setup, especially if buying volume confirms price stabilization.
🟢 Trade Setup – Long Spot
Entry Zone: $0.50 – $0.52
Take Profit Targets:
• TP1: $0.59
• TP2: $0.67
• TP3: $0.85
Stop Loss: Just below $0.485

Scalp Long – ADA💎 Scalp Long – ADA
Price is consolidating before a potential breakout from the downtrend. RSI is in the buying zone, and buying volume is rising sharply, showing strong accumulation pressure. A powerful breakout is anticipated with an attractive risk-reward setup.
🎯 Trade Setup:
→ TP: 0.6086 | SL: 0.5292 | RR: 1 : 3.79
Momentum and volume alignment suggest a high-probability breakout long, favoring bullish continuation once confirmation occurs.

DeGRAM | ADAUSD seeks to the $0.5 level📊 Technical Analysis
● ADA/USD remains locked within a descending channel, with the price recently rebounding from support near $0.50 but facing strong resistance around $0.60. The structure shows repeated bearish continuations through flag and triangle formations, reflecting sustained selling momentum.
● A rejection from the resistance line could confirm another leg down toward $0.50, the key demand level defining medium-term support.
💡 Fundamental Analysis
● Cardano sentiment remains muted amid declining DeFi inflows and network activity, while broader crypto risk aversion caps upside momentum.
✨ Summary
● Resistance: $0.60. Support: $0.50. Bias remains bearish with potential continuation toward $0.50 after another failed breakout attempt.
-------------------
Share your opinion in the comments and support the idea with a like. Thanks for your support!

ADA - BEARISH SETUPCRYPTOCAP:ADA – Bearish Pressure Building 🔴
Current structure isn’t inspiring confidence.
We’ve got a potential bearish channel forming on the H4, with a close below previous support, not ideal.
Next likely move? A drop toward 0.5150 – 0.500 $ if sellers keep pushing. 📉
Key levels on my radar:
✅ Daily downtrend (still controlling price)
✅ Resistances: 0.6200 – 0.7280 – 0.700 $
✅ Demand zone (daily): 0.5150 – 0.500 $
Warning: If we break 0.500 $ with volume, things could get ugly fast 0.440 – 0.400 – 0.3800$ becomes the next target. 😱
My stance?
No reason to rush. I’d rather see a strong bullish reversal (above the downtrend) before even thinking about longs.
Patience pays. Stay disciplined. 💎

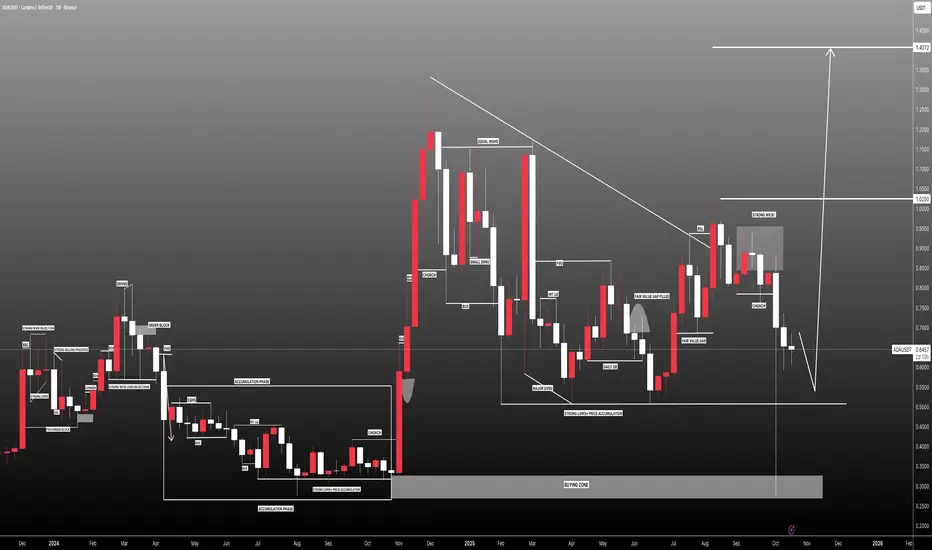
Cardano (ADA)Cardano (ADA/USDT) is currently trading within a large ascending channel, showing a steady recovery structure since the 2022 bottom. The price recently retraced toward the lower boundary of this channel, aligning with a strong support zone around $0.55–$0.60.
As long as ADA holds above this level, the overall structure remains technically bullish. A breakout from the triangle resistance could open the way for a potential rally toward $1.00–$1.20 in the medium term.
In the broader view, a confirmed breakout from the channel’s upper range could push ADA toward higher macro targets around $2.80–$3.00, which corresponds to major Fibonacci and structural confluences.
If Bitcoin and Ethereum continue their uptrend, ADA could be one of the strong catch-up plays in the next altcoin cycle, given how much it has lagged behind the majors.

#ADAUSDT: Two Targets Both Possible, Let's See How Price MoveADAUSDT collapsed following the announcement of new tariffs on China, which caused fear in the cryptocurrency market and affected minor currency pairs. This led to a significant drop in the price of ADAUSDT. A minor decline may occur before the price reverses. There are two potential targets for the price to reach.
Entry area:
- We have identified the key area where a price reversal is likely to occur.
We wish you the best of luck and trade safely.
Team Setupsfx
$ADA Resistance Clash – Breakout or Pullback?BINANCE:ADAUSDT CRYPTOCAP:ADA Resistance Clash – Breakout or Pullback?
ADA's 1H chart pushing bullish, rebounding from support ~0.54 to test resistance at 0.60—successful break targets 0.62 fast, but rejection could see dip back to 0.56 on weak volume.
Uptrend resilient.
Key indicators: RSI climbing to 55 (momentum building), 50MA support, MACD bullish signal. 🌿📈
#ADA #Cardano #AltcoinPioneers

ADA JESSE LIVERMORE SPECULATIVE ACCUMULATION CYLINDERADA is currently experiencing a Jesse Livermore Accumulation Cylinder described in 1925
Typically this pattern resolves with powerful moves to the upside when presenting in a basing pattern
Other assets that underwent this pattern before explosive moves up are
Palladium
Platinum
Silver
Uranium
MOS
IPI
LEU
LTBR

ADAUSDTBINANCE:ADAUSDT is wait for breakout trendline for start bullish trend so we wait for this breakout and ADA give best signal for buy.

$ADA Support Test Passed, Breakout Lurking?BINANCE:ADAUSDT CRYPTOCAP:ADA Support Test Passed, Breakout Lurking? 📊🔮
ADA's 1H trend stays bullish, rebounding sharply from core support ~0.550 with solid volume—buyers locking in!
High likelihood of hold, targeting breakout above 0.615 resistance to 0.65.
Deeper dip risk minimal (watch 0.54), but trail stops.
Eyeing RSI ~54 (upward shift), 50 EMA bounce, and MACD turning green.
Cardano climbing! 🚀
#ADA #CryptoTrading #AltcoinSurge

ADA PO3On the ADA/USDT chart, there’s a clean PO3 (Power of Three) setup. I expect the 0.435 support to hold well and act as Phase 2 (accumulation). After that, I’m looking for a transition into Phase 3 with upside expansion. MACD and RSI are also in descending trends; if those break in confluence with the PO3 breakout, it could lead to a strong move higher.

ADACRYPTOCAP:ADA is showing compression and building energy for a move. Based on the current structure, a breakout is expected within 150 days, with a potential upside of around 200% from current levels. The setup looks clean and accumulation appears to be nearing completion.

$ADA - fat finger it Charlesat vwap from the low and above range low
shall check domi its been flirting with 60% and getting knocked back down the red candle on it is loading which should give the btc pairs an impulse up
so basically nursing this and algo and scalping others ..
invalidation with an acceptance below range
lets see what we get !!

ADAUSDTNothing special, after October 10, we found a "bottom" in this cycle, where it will probably move in a chaotic direction, shedding shorts and longs on its way. The yellow dotted line indicates the area where a "turn" is possible (it is possible to make some decisions, political or drastic regulatory changes or in that spirit)
Red showed resistance zones in case of a possible reversal. And a break of the negative trend on TF 1D.There is also weak support, which may act as a "hope" zone with a possible slight increase and a rapid decline in price to the lows that we have already tested on October 10, and clearly rested in the support zone.
But I wouldn't be surprised if we're in the near future, it will bounce back significantly below October 10th.

ADA/USDT | ADA Setting Up for 10% to 100% Gains, Don’t Miss ThisBy analyzing the Cardano (ADA) chart on the 3-day timeframe, we can see that price is currently trading around $0.67.
Based on the current structure, I expect ADA to start a strong bullish move after a short period of consolidation.
The expected potential returns are around +10% short-term, +40% mid-term, and over +100% long-term. This analysis will be updated soon!
Please support me with your likes and comments to motivate me to share more analysis with you and share your opinion about the possible trend of this chart with me !
Best Regards , Arman Shaban

ADAUSDT.P - October 27, 2025Based on the current price action, the ADAUSDT.P 15-minute chart shows a potential high-risk short setup targeting a move lower from the resistance level around $0.6794. A confirmed aggressive rejection at this resistance is necessary to validate a short entry, with a target around $0.6462 and a stop loss at $0.6946.

ADAUSDT — Dual Wave ConfluenceTwo independent cycles now point to the same liquidity zone.
The wine wave (macro) has entered its BC retracement phase, and its BC target aligns perfectly with the green micro-wave’s C-target , forming a rare dual confluence at the same level. This overlap creates a liquidity magnet — a structural point where both wave systems expect equilibrium before a bullish expansion.
Price is currently reacting inside the BC demand zone , finalizing the correction before expansion toward the macro C projection at 0.7575 .
The alignment between both scales confirms that momentum and liquidity are synchronized for continuation.
Strengths :
Perfect alignment of macro BC and micro C targets
Discount entry within structural demand
Defined invalidation below BC low
High asymmetric RR toward 0.7575
Weaknesses :
Requires bullish displacement confirmation from demand zone
Possible short-term inducement before expansion
Invalidation if structure breaks below BC
Bias : Bullish continuation
Target : 0.7575 (macro C projection zone)

CARDANO(ADA)- Potential buy setup toward 0.762$cardano is showing signs of strength after a minor pullback. as long as the current support zone holds, a bullish continuation toward the 0.762$ resistance area seems likely. overall, ADA remains technically positioned for further upside momentum.
#ADA #CARDANO

ADA Breakout Analysis: Bulls Target 0.7280, 0.8000, and 0.8750ADA Breakout Analysis: Bulls Target 0.7280, 0.8000, and 0.8750
Cardano (ADA) has recently broken above a symmetrical triangle, signaling a potential bullish continuation after a period of accumulation.
This breakout suggests renewed buyer interest and the potential for price expansion toward higher resistance levels.
The next key targets identified are:
0.7280 (first resistance zone and breakout confirmation area)
0.8000 (psychological and structural resistance)
0.8750 (extended target in line with the projected triangle breakout move)
As long as ADA holds above the breakout zone near 0.6500, the bullish bias remains valid.
A pullback toward the breakout zone could serve as a retest opportunity before another leg higher.
You may find more details in the chart!
Thank you and Good Luck!
❤️PS: Please support with a like or comment if you find this analysis useful for your trading day❤️

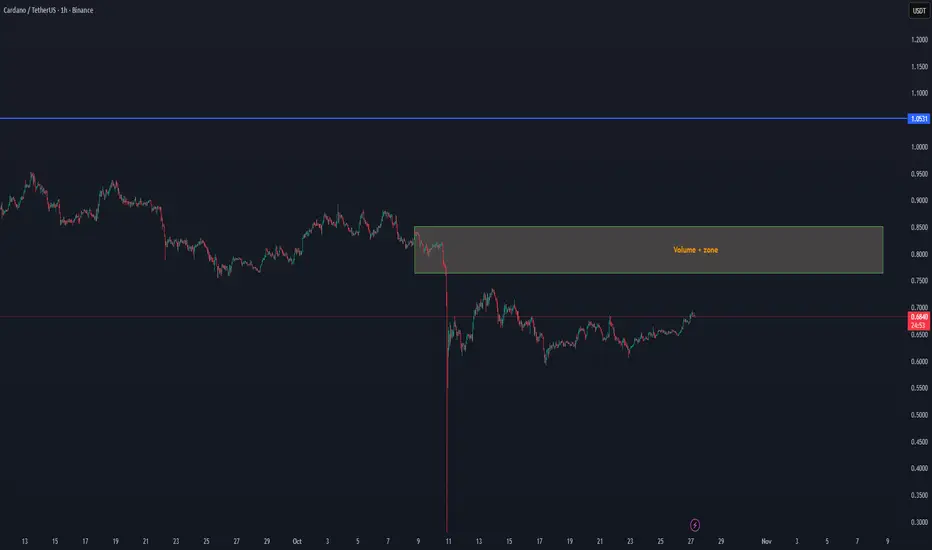
ADA/USDT – Volume Zone Retest Setup🔹 ADA/USDT – Volume Zone Retest Setup
ADA is showing early signs of strength after recovering from the last drop and is now building momentum below the Volume+ Zone between $0.75 – $0.85.
The current structure shows stable volume forming on lower time frames, which can indicate accumulation before a possible retest of the upper range.
If momentum continues, ADA can look to re-enter the volume zone, where the next confirmation area will define continuation potential toward $1.05 resistance.
For now, we follow volume development — a clean breakout and hold above the zone would confirm the next expansion phase.