DeGRAM | ADAUSD is testing the resistance line📊 Technical Analysis
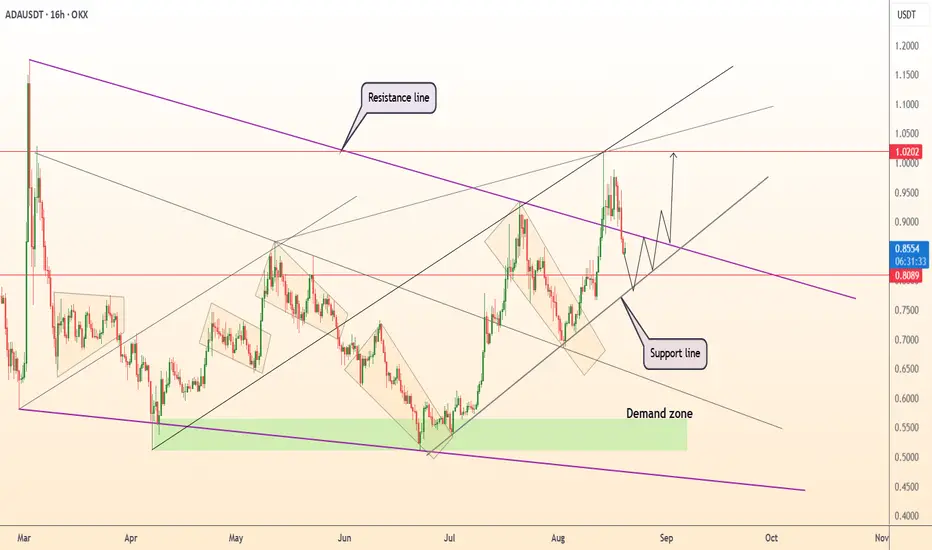
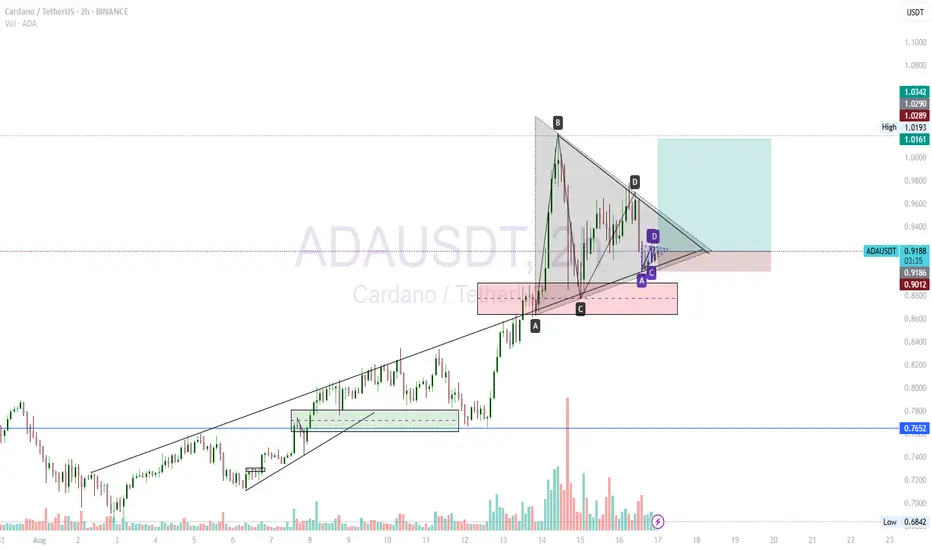
● ADAUSD recently bounced off a rising support line near $0.85, staying within a broader ascending channel. The initial rebound sets sights on the key resistance at $1.02 (formerly a breakout zone).
● A breakout above this $1.02 level would confirm upward momentum and could propel ADA toward $1.10–$1.15, in line with the channel’s upper boundary and prior swing highs.
💡 Fundamental Analysis
● Regulatory clarity under the Clarity Act reclassified ADA as a commodity, boosting institutional confidence. Grayscale's ADA ETF approval odds now sit at 80–83%, backed by $1.2 billion in ADA custodied by major firms.
● ADA futures volume has surged to a five‑month high of $7 billion, and DeFi TVL on Cardano has risen 56% to over $420 million—underscoring growing on‑chain demand.
✨ Summary
Bullish above $0.85; breakout above $1.02 targets $1.10 → $1.15. Invalidation triggers if price closes below $0.85.
-------------------
Share your opinion in the comments and support the idea with a like. Thanks for your support
Trade ideas
ADA bullish reversal possibilityADA seem to be returning back to uptrend. At least it should grow to the top of that consolidation range around 1.1-1.2
Dips to 2024 close at 0.845 may be expected. Wicks can go below that level (down to 0..8), but for bullish bias to stay strong price shouldn't lose that level.

Weekly trading plan for AdaThe current corrective phase resembles a triangle, so I see two clear scenarios.
If it is indeed a triangle, then a breakout of the trendline would open the way for growth into the resistance zone at 1.10–1.17 .
If the price breaks local support, the triangle scenario is invalidated, as this would simply be a regular ABC correction phase, with the price potentially moving back down to the monthly pivot point .

ADAUSTP LONG TERM BYBIT:ADAUSDT.P maybe we gonna be see this flag formation on ADA I think its blow up before the rate

ADA/USDT : Heavy Pullback Expected Before Major Price Surge📊 Pattern Overview
Cardano is shaping a classic contracting triangle on the daily timeframe, with all legs unfolding as 3-wave zigzags, fully compliant with NeoWave rules.
• Wave A: $1.33 → $0.51 (zigzag decline)
• Wave B: $0.51 → $1.18 (zigzag rally, ~82% retrace of A)
• Wave C: $1.18 → $0.52 (zigzag decline, ~99% retrace of B)
• Wave D: $0.52 → $0.92 (zigzag rally, ~61% retrace of C, currently in progress)
• Wave E: Expected $0.92 → $0.51 (projected zigzag, targeting channel support)
This setup aligns with a contracting triangle, with converging trendlines projecting an apex around November 2025.
⸻
📉 Near-Term Expectation
• Wave E is anticipated to pull ADA back toward $0.51 (long-term channel support).
• This would complete the triangle and set the stage for a powerful bullish thrust.
⸻
🚀 Post-Triangle Outlook
• A bullish breakout from the triangle could target:
• $1.5 (TP1)
• $1.8 (TP2)
• This aligns with NeoWave projections of a 75–125% thrust of the channel width.
• Break of $0.92 (BOS) will be the confirmation trigger for the rally.
⸻
🎯 Trading Plan
• Entry: Wait for pullback to ~$0.51 (Wave E completion) and BOS confirmation.
• Targets: $1.5 – $1.8
• Stop Loss: Below $0.45
• Risk Management: 1–2% capital per trade, trail stops above $1.0 once thrust begins.
⸻
⚠️ Key Levels
• Support: $0.51 (channel bottom)
• Resistance: $1.0, then $1.5–$1.8
• Invalidation: Break below $0.45
⸻
✅ Summary: Patience is key. A final pullback toward $0.51 could be the last shakeout before a major bullish breakout.

Ada is readyHello friends, I hope you're doing well. Today, we're talking about this currency, ADAUSDT. The ADA has broken a very important trend line, which signals a potential new bullish rally. If ADA can close the weekly candle above 0.87, the medium-term upward movement could pave the way toward nearly $1.90. This might happen in two stages, but Bitcoin needs to show good support, and I believe this will happen. So, we’ll be waiting.

ADA/USDTLooks like price is just retesting from the break of this weekly bull flag. Next move from here should bring us close to the previous ATH

ADA opportunity ahead. ADA is retracing while showing signs of divergence. Keep in mind that the market structure remains healthy; however, a bearish response is underway. As long as BTC and ETH show weakness, altcoins will dip. Be patient.

ADA MY LOVE ✅ Profitable Trades Counted (Spot Swing):
418%
213%
75%
70%
💰 Approximate Cumulative Gain (Compounded Not Calculated)
= 776%+ gain from multiple swing trades
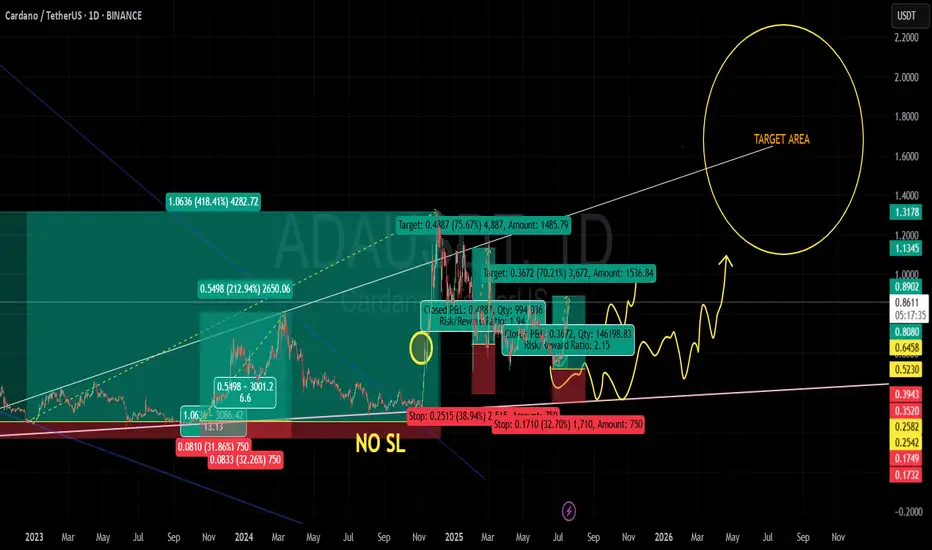
🧠 Your POV (as seen on chart)
“NO SL” indicates confidence in ADA’s long-term support zones.
trusted strong support accumulation areas (red zone) and rode through volatility.
Strong belief in continuation: yellow squiggly lines show an expectation of consolidation followed by breakout above $1.
📢 Note: “There are also multiple futures scalp trades not shown here.” – this shows you are aggressively compounding gains via different strategies.
🧠 My Technical POV on ADA (Bullish Outlook)
✅ Key Observations:
Price Recovery from macro bottom zone (~0.25–0.26).
Multiple Breakouts from falling trendlines.
Clean support-resistance flip around 0.52, 0.64, 0.81 zones.
Current price: ~$0.86, holding above mid-term trend support.
🎯 Future Key Levels:
Short-Term Targets: 0.89 (breakout level), then 1.1345
Mid-Term Targets: 1.3178, 1.60
Long-Term Potential: 2$ ,3$,5$ if BTC & ETH sustain bullish cycle
📈 Momentum:
Consolidation above 0.80 zone would likely trigger another explosive move
ADA remains undervalued compared to its 2021 ATH, making it a high R/R swing opportunity
ADA: Are you ready for a productive flight?ADA
Cardano has managed to break the downtrend line by forming 3 bottoms at one level and is currently consolidating with 4 daily candles.
If it can fully consolidate, it could move towards higher targets.
Given the technical conditions of the cryptocurrency market, I approach the bullish scenario with a probability of 70% and enter a medium-term long position.

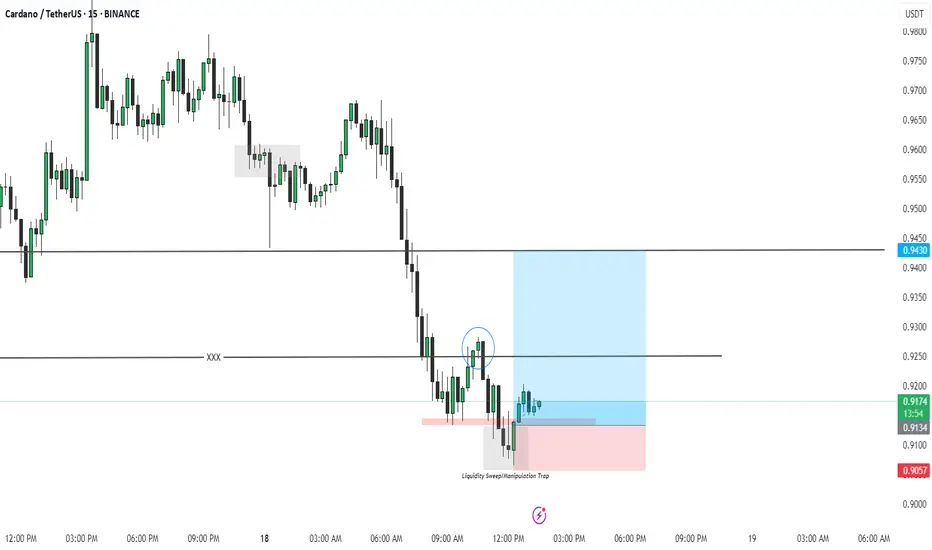
ADA/USDT – Liquidity Sweep & Reversal Setup ADA/USDT – Liquidity Sweep & Reversal Setup (15m TF)
Price recently swept liquidity below the prior low, triggering a manipulation trap. After the liquidity grab, bullish momentum started forming, confirming rejection from the demand zone.
Entry: Taken after the liquidity sweep confirmation.
Stop-loss: Placed below the manipulation low to protect against deeper downside.
Target: 0.9430 resistance zone (major supply level).
This setup is based on liquidity sweep, manipulation trap, and demand zone reaction, expecting a move back to the upside.
Risk management is key – waiting for structure confirmation before continuation.
Cardano Update · All Perfect, Straight Up!Cardano is super bullish right now. Just one day red and the next day green while trading above support.
The rise is an ongoing phenomena. Cardano has been rising since 22 June. We know there has been lots of consolidation after the 3-February low. Some challenge of resistance, some tests of support.
The bulls once more gained the upper hand. ADAUSDT is showing the highest volume 14-August since March. The highest prices since March as well have been activated again.
Resistance was found at $1.01 and notice that this is the 0.618 Fib. extension number for our next wave. This confirms the numbers are good and this reveals the next target to be $1.83. Just as we had a stop at $1.01, we will have a stop at $1.83. This is a major level but these are only short-term to mid-term targets, you know we are going high long-term.
Ok. I wanted to show you the daily and what is happening now. The truth is that everything is fine. The market conditions solid. ADAUSDT is moving forward. This chart shows a classic bullish impulse unfolding. The candles are likely to continue pushing higher, always putting pressure on resistance and breaking it, then higher with swings as well. Retraces just like late July. Hopefully only one correction.
Cardano is trading above all moving averages. The RSI is very strong. The MACD looks great. We will see more growth, additional growth, long-term. It is already happening and it will continue to happen.
Namaste.

Full analysis on ada weeklyDear Traders,
hope you like this analysis , this is the realistic targets just written here ;)
like and share

See if the price can hold above 0.8289-0.8836
Hello, fellow traders!
Follow us to get the latest information quickly.
Have a great day.
-------------------------------------
(ADAUSDT 1D chart)
From a trend perspective, the key is whether the price can hold by breaking above the first and second trend lines.
If the upward movement fails, we should check for support around 0.8289-0.8836.
Therefore, we should check whether the price remains above 0.8289-0.8836 after August 31st, which is ADA's volatile period.
-
(1W chart)
To continue the cascading upward trend, the price must rise above 1.1936-1.3678 and remain there.
If it surges, it could rise to around 2.1150.
Since the volatile period on the 1W chart occurred around the week of November 10th, a downtrend is likely thereafter.
This is because a major bear market is expected to begin in 2026.
Therefore, if the HA-High indicator falls below 0.8836, you should stop trading and assess the situation.
-
Thank you for reading to the end.
I wish you successful trading.
--------------------------------------------------
- Here's an explanation of the big picture.
(3-year bull market, 1-year bear market pattern)
I will explain more in detail when the bear market begins.
------------------------------------------------------

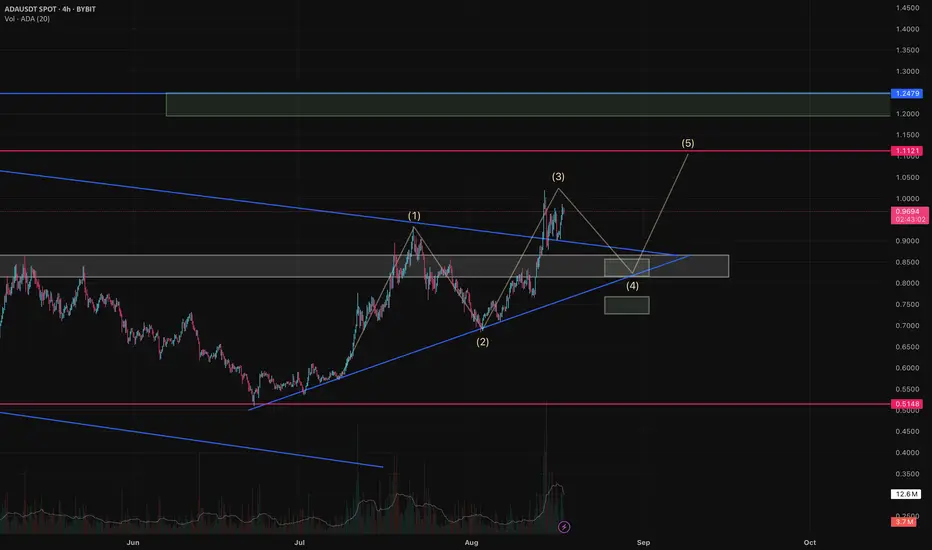
ADA After Channel Breakout — What’s Next?ADA has broken out of a downtrend channel and signals the start of a new trend. The breakout also came with higher volume that shows us that buyers are full of power.
The 3rd Elliot wave looks complete to me, so I'm expecting the market may correct into wave 4 before the next impulse up.
Scenarios:
Bullish:
Price holds above 0.82-0.85 support
Next targets are 1.11 and 1.20-1.25 later
Bearish/correction:
If 0.85 fails, price may fall to 0.72-0.75
RSI hints a correction, but the buy volume supports bulls
Key levels:
Support: 0.85
Resistance: 1.11
Target: 1.25
Disclaimer: The author’s opinion may not align with yours.
ADA Break Out Huge Bullish flag! Big RallyADA Break Out Huge Bullish flag
Buy and hold.Big rally for this time!


ADAUSTBINANCE:ADAUSDT is up-trend. We open buy in any pollback. If keep price trend above $0.9120 we see next level in $1.1310 and more.
Support: 0.9120 - 0.8240 - 0.7600 - 0.6970
Resistance: 0.9980 - 1.1310 - 1.2400
Please control risk management in your trades.⚠️

ADAUSDTADA in bull-trend. Wait for pollback for buy signal.
Entry: 0.926
Stop-loss: 0.8991
Trarget: 1.10789
Please control risk.

ADA/USDT – Symmetrical Triangle + Harmonic SetupCardano (ADA) is currently consolidating inside a symmetrical triangle pattern, with a potential breakout in the coming sessions.
🔹 Key Observations:
ABCD harmonic structure is forming, aligning with the broader triangle.
Strong demand zone around 0.90 – 0.88 acting as support.
Volume is gradually decreasing during consolidation → typical before a breakout.
Breakout confirmation expected near the triangle apex.
🔹 Trade Idea:
Entry: Inside the triangle (0.918–0.920 zone).
Stop Loss: Below 0.900 support box.
Target: 0.96 – 1.00 (triangle measured move).
This setup offers a favorable risk-to-reward ratio with confirmation from both harmonic pattern completion and price structure.
⚠️ As always, breakout confirmation is key — wait for volume spike on the move.
ADAUSDDescription:
Price is currently consolidating between key levels.
Close above → Buy: If candles close above the resistance, expecting continuation to the upside.
Close below → Sell: If candles close below the support, bearish move likely towards lower demand zones.

Lingrid | ADAUSDT The price perfectly fulfilled my previous idea . BINANCE:ADAUSDT recently rebounded from the upward trendline after testing the breakout area, showing signs of renewed bullish momentum. The structure reveals a sequence of higher lows and higher highs, supported by a sustained upward channel. As long as the 0.8500 support zone holds, the market could push toward the 1.0150 resistance area. Momentum remains positive, aligning with the prevailing bullish channel structure.
📉 Key Levels:
Buy trigger: Hold above 0.8500.
Buy zone: 0.8500–0.8400.
Target: 1.0150.
Invalidation: Break below 0.8400.
💡 Risks:
Failure to hold the 0.8400 support could shift momentum to the downside.
Broader crypto market weakness may cap upside moves.
Potential profit-taking near the resistance zone could trigger short-term pullbacks.
If this idea resonates with you or you have your own opinion, traders, hit the comments. I’m excited to read your thoughts!

$ADA/USDT has broken out of a long-term downtrend and bullish $ADA/USDT has broken out of a long-term downtrend and bullish flag pattern, showing strong upward momentum. I’ll add a small position at the current price and wait for a retest around 0.85 to add more. Stop loss if the 1D candle closes below0.80. 📈
#Bitcoin #altcoin #btc #memecoin CRYPTOCAP:BTC CRYPTOCAP:INJ CRYPTOCAP:LINK CRYPTOCAP:XRP CRYPTOCAP:PEPE #husdt #myx #velvet #MEMEFI #cat #ai. #bbtvi #LUFC #eth #ETHFI #xvg
