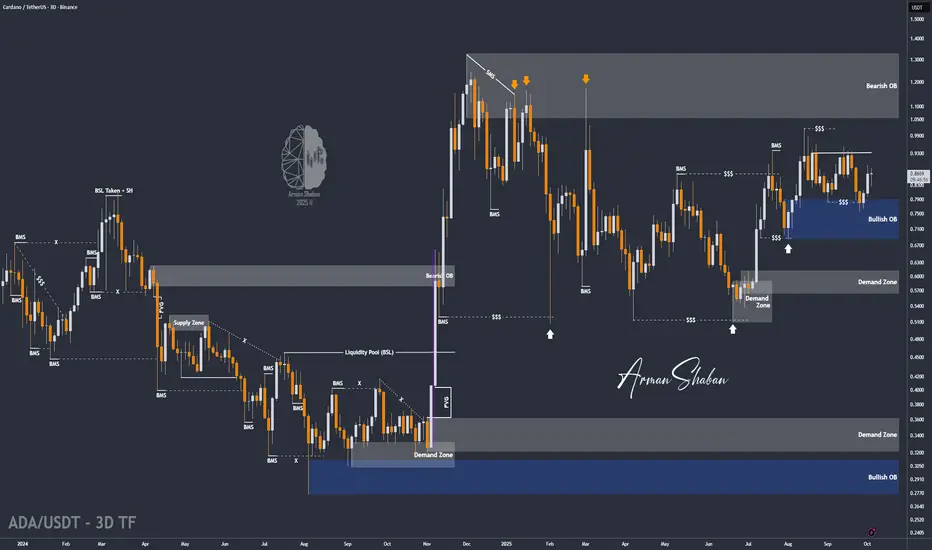
ADA/USDT | ADA’s Epic Comeback: 130% Pump After Brutal Selloff!By analyzing the Cardano (ADA) chart on the 3-day timeframe, we can see that, like the rest of the market — or even more severely — ADA faced a massive dump of over 65%, dropping below $0.275.
After a liquidity grab under that level, strong buying pressure emerged, driving the price up by 130%, reaching around $0.63. However, ADA still needs to rise about 30% more just to return to the level where this drop originally began.
This cryptocurrency remains highly promising, and if Bitcoin stabilizes above $110,000, we could expect the next bullish wave to begin for Cardano.
Please support me with your likes and comments to motivate me to share more analysis with you and share your opinion about the possible trend of this chart with me !
Best Regards , Arman Shaban
Trade ideas

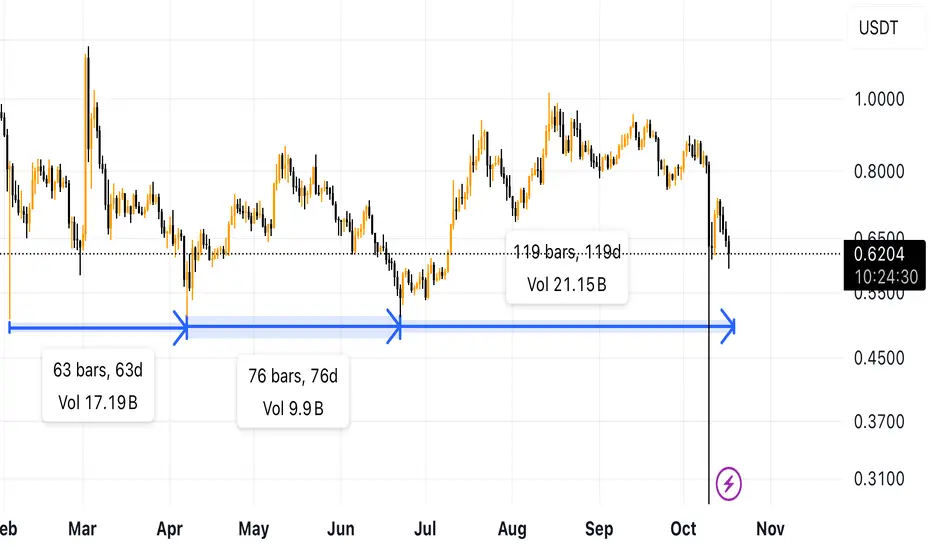
Cardano hidden bullish signHi everyone
What I want to tell you is that when a level is being touched for many times
It depends on how far are the toches!
When I compare them There is an increase in period length when each touch comes!
That just means longer time for bears to achieve that previous level
Longer time means lesser potency and force
This is what I mean
Now that’s a good sign for me to enter around these level
Manipulations are everywhere nothing for me to do with them
Spot entry is the best choice now
#ADAUSDT: Is the crypto hype finally over? ADAUSDT is likely to drop first then it can reverse and continue the bullish move upwards of previous all time high. Before we can confirm any entry on this pair we need strong confirmation which will allow us to predict a correct and accurate swing move.
If you like the work then do consider liking and commenting on the idea.
Team Setupsfx_❤️

Cardano Inflows Jump To 3-Month High As Holders Rescue ADA PriceCardano’s price currently hovers above the $0.66 support level but risks slipping below it if bearish momentum continues. A drop under this line could push ADA down to $0.60 in the coming days.
Continued whale selling could exacerbate downward pressure even if inflows remain strong. Persistent profit-taking from large holders would make sustained recovery more difficult.
However, if ADA manages to hold $0.66 and attract renewed buying interest, the altcoin could rise above $0.69 and potentially reach $0.75. Such a move would invalidate the bearish outlook and mark the start of a short-term rebound.

ADA Shows Bearish Momentum as MACD Signals Sustained Selloffs
On the daily chart, Cardano’s MACD indicator continues to flash bearish signals, suggesting that momentum remains tilted in favor of sellers. The MACD line has crossed below the signal line — a setup traders often interpret as a sign of increased selling activity and weakening market confidence.
This configuration typically indicates that bearish sentiment is strengthening, as buyers struggle to regain control.
Unless a clear shift in momentum occurs, ADA could remain under downward pressure in the near term. Traders may look for a bullish crossover or a spike in trading volume as early signs of a potential recovery.

ADAUSDT soon again above 1$ As we can see stop loss hunting end also this dump was huge and only for a few minutes price was down like that and soon we can expect next phase of gain for market and CRYPTOCAP:ADA and our target is now 1.2$ and soon can hit.
Notice: my personal view about that red reject candle in market the news did dump price but now one expect dump like that and i think this was market manipulation before something big which is coming and was cooking and this liquidation was needed to hunt and kick all traders with leverage even those smart one with low leverage on alts.
DISCLAIMER: ((trade based on your own decision))
<<press like👍 if you enjoy💚

ADA Price Target 2025 We’re currently moving within a narrowing triangle pattern. If the altcoin season continues without any major black-swan events, geopolitical tensions, or Fed actions that trigger public fear and institutional exits, we could see potential upside moves toward ~$1.2 first, and then ~$2.0 as a secondary target.
The breakout could be even stronger, but once large buyers start to quiet down ( SELL ), it’s usually wise to lock in profits and protect gains.

Cardano (ADA) - Price Action Looking Strong Bullish! Cardano (ADA) — Price Action Looking Strong 👀
Cardano just had a huge dip into the support zone. That’s exactly what you want to see from a healthy market setup.
This move likely cleared out weak hands and filled some serious buy orders in that $0.34–$0.36 range. The bounce that followed shows there’s still strong demand sitting underneath.
If ADA can hold above this zone, I wouldn’t be surprised to see it build momentum in the coming weeks as Bitcoin continues to push higher. Historically, ADA tends to lag a bit, but once it catches fire, it runs fast.
This might honestly be one of the last chances to grab ADA cheap before a bigger breakout move.
Key areas I’m watching:
🔹 Support: $0.20–$0.40 (liquidity sweep zone)
🔹 Next resistance: $1.33+ (psychological and structural breakout zone)
🔹 Bigger breakout target: $3.00-$5.00+ (breaking previous ATH if BTC keeps leading)
Not financial advice, but the setup looks clean. Structure’s shifting, liquidity’s cleared, and sentiment’s turning — this is where smart money usually starts paying attention.
ADAUSDT 3D#ADA is trading within a bullish flag on the 3-day chart. It is currently sitting on the monthly support, the 3-day SMA200, and the midline of the flag. Consider buying a small bag of #ADA here and near the daily support level of $0.5544. Our mid-term targets are:
🎯 $0.8882
🎯 $1.0062
🎯 $1.1242
🎯 $1.2923
🎯 $1.5064
🎯 $1.7785
🎯 $1.9206
🎯 $2.1246
⚠️ Always remember to use a tight stop-loss and maintain proper risk management.

ADAUSDT: Trend in daily time framePlease pay special attention to the accurate trend, and very accurate colored levels
Be careful, because the setup is very very sensitive
Don't get a position without SL.
BEST
MT

ADA/USDT - IdeaCardano chart analysis shows a bullish trend, though it’s complex due to significant liquidity at the bottom. The price may experience a short-term drop to around 0.45 USD, followed by a bullish move targeting 1.10–1.25 USD.

The bottom is somewhere around here!I still consider this coin to be a very strong asset, which will show strong growth like Ripple in 2024 and Solana in 2023.
Cardano (ADA) Holds Key Support, Eyes Move Toward 0.92Cardano’s price action is holding firm above the high-time-frame support at 0.766, a critical zone that continues to underpin the broader bullish structure. This level has acted as a strong demand region, with buyers stepping in to defend it multiple times — signaling sustained confidence from market participants. The formation of consecutive higher highs and higher lows further confirms that the prevailing trend remains bullish on both the mid and higher time frames.
From a technical standpoint, the 1.618 Fibonacci extension has been respected throughout the recent rally, suggesting that ADA is following a well-defined harmonic rhythm. The confluence of rising moving averages and volume support also reinforces the bullish narrative, indicating that any minor pullbacks may serve as healthy retracements within the uptrend.
As long as the 0.766 support level continues to hold, the next key objective for buyers lies around 0.927, where a potential reaction or short-term consolidation could occur. Overall, Cardano maintains a structurally bullish outlook, with the current setup favoring a continuation toward higher targets as momentum and trend alignment stay intact.

Is it a time for Cardano - 1 USD TARGETOn the Cardano (ADA/USDT, 4h) chart, after a previous decline, the price has stabilized around the $0.81–$0.82 zone, which represents a key support area. This level has repeatedly acted as a strong barrier against further declines and could now serve as a foundation for a potential rebound.
In recent sessions, the market has been moving within a narrow price range, suggesting a period of accumulation before the next significant move. The moving averages (EMA 20 and EMA 50) are close to each other, indicating that selling pressure is weakening. Additionally, the RSI has leveled off around the 40–50 range, signaling that the bearish momentum may be fading and the market could be preparing for a recovery.
If ADA holds above $0.81, there is a strong possibility of an upward move toward $0.87–$0.88, followed by a continuation to around $0.95, where a key technical and psychological resistance level is located.
In summary:
The current price action suggests the formation of a local bottom. Holding the $0.81 support zone could trigger a bullish wave, with a near-term target around $0.95 USD.
Potential TP - 0.95 $

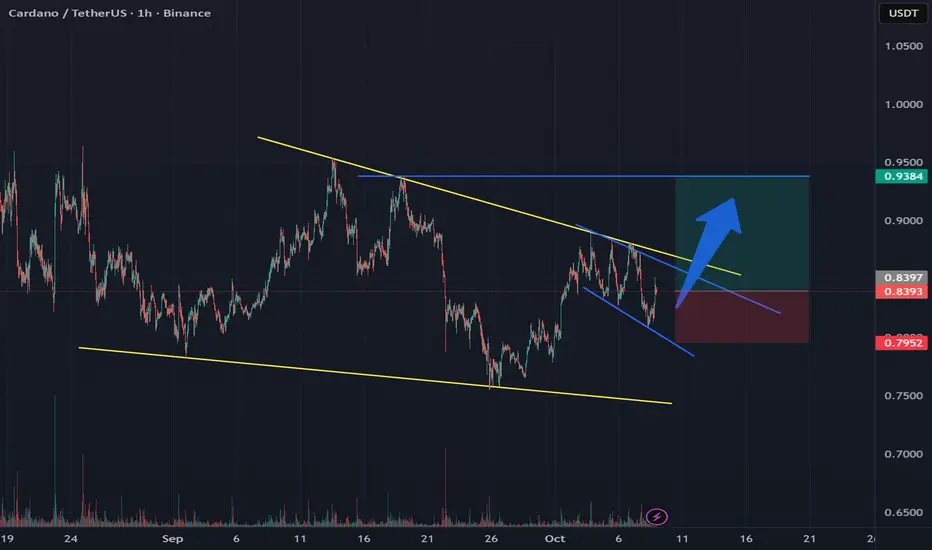
ADA forms double bullish wedge patternsADA has formed a bullish falling wedge pattern on the global timeframe, within which a local bullish expanding falling wedge pattern has formed
If the local pattern plays out, the price will immediately break through the global pattern, causing a high-probability upward movement
Current price: $0.8397
If the local pattern plays out, the price could reach $0.8600 , then if the global pattern is broken, the price could move higher
If the price declines and breaks through the lower boundary of the local pattern at $0.7952 , the price could fall to the lower boundary of the global pattern, causing the price to continue moving within the global pattern, and the local pattern would be broken
More detailed analysis, additional charts, and key levels to watch are available on our site
ADAUSDT 1D#ADA is trading within a symmetrical triangle on the daily chart and is currently trying to hold the price above the daily SMA100. Consider entering this coin after a solid breakout above the triangle resistance. In that case, the potential targets are:
🎯 $0.9378
🎯 $0.9945
🎯 $1.0512
🎯 $1.1320
🎯 $1.2348
⚠️ Always remember to use a tight stop-loss and maintain proper risk management.

ADA / USDT – Weekly Breakout Structure Forming Toward $1.30Cardano (ADA) is showing early signs of a potential mid-term breakout after months of consolidation.
On the weekly chart, price has broken above the descending trendline that acted as resistance since early 2025. The candles are now forming a higher low structure, suggesting accumulation before a new impulse move.
The chart indicates a possible continuation toward the $1.00–$1.30 zone in the coming weeks if momentum strengthens and BTC maintains stability. The key resistance levels are $0.95 and $1.30, while support lies around $0.70.
- Trade Idea:
- Entry zone: $0.80 – $0.83
- Target 1: $0.95
- Target 2: $1.30
- Stop Loss: Below $0.70
This setup aligns with the broader market recovery phase and potential altcoin rotation expected in Q4 2025. Patience and proper risk management are advised as ADA continues to build momentum above the breakout structure.
ADAUSDTADAUSDT
I expect price to go down a little bit and fill up the fvg, after that i expect the price to hit the fib lvl 0.618 and from there to go up.
It is possible to hit also the fib lvl 0.5 and from there to take off.
Buy order from the fib lvl 0.618 with sl under the OB and tp at around 0.950 with tp 50% when the price hit the trendline

ADA IS BULLISH Ada Breaks 1hr resistance , that is a good Bullish signal to go long targeting daily order block

Cardano Price Gains Capped by Long-Term Holder PressureCardano’s price currently trades at $0.87, hovering just below its immediate resistance of $0.88. The token remains approximately 14% away from the psychologically important $1.00 level, a threshold that could reignite market enthusiasm if successfully breached.
Given the mixed outlook from investors and technical indicators, ADA is likely to continue its sideways movement. The cryptocurrency may remain rangebound between $0.83 and $0.88 until decisive buying volume emerges.
However, if long-term holders pause their selling and market sentiment improves, ADA could break past the $0.88 barrier and rise toward $0.93. Such a move would restore bullish confidence and potentially pave the way for a broader recovery phase in the weeks ahead

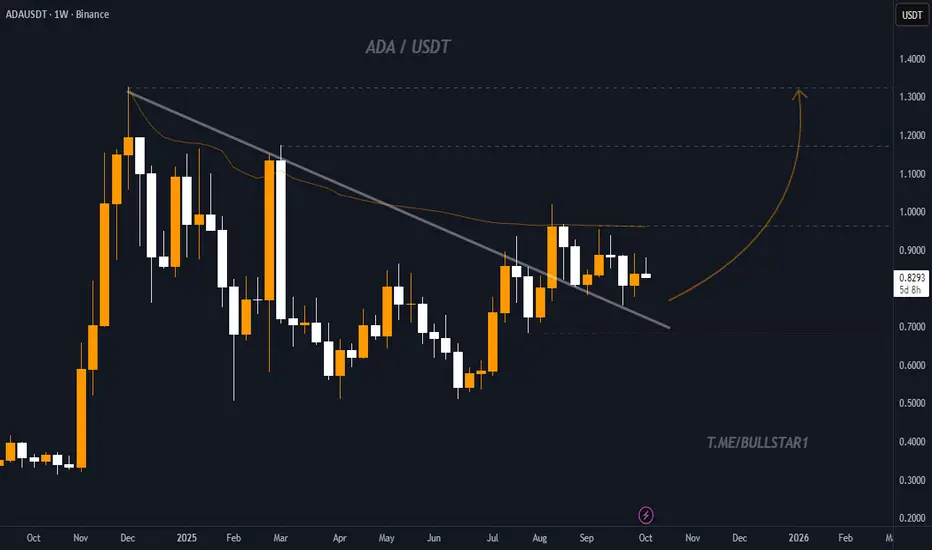
ADA Multi-Year Downtrend Nearing EndCardano CRYPTOCAP:ADA is forming higher lows and looks ready for a big breakout once it moves above the red resistance line. Price is currently in the accumulation zone, which means smart money might be loading up here.
Plan:
Buy Zone: Between 0.75 and 0.88
Stop Loss: Below 0.66 (if it drops there, the setup fails)
Targets:
TP1: 1.09
TP2: 1.35
TP3: 1.70
TP4: 2.18
TP5: 3.10
Strategy:
Start with a small position here. Add more only after a confirmed breakout above 0.90.
Once the first target hits, book some profits and move your stop loss to entry.
Note:
This is a long-term setup, could take several months to play out. Always do your own research (DYOR).

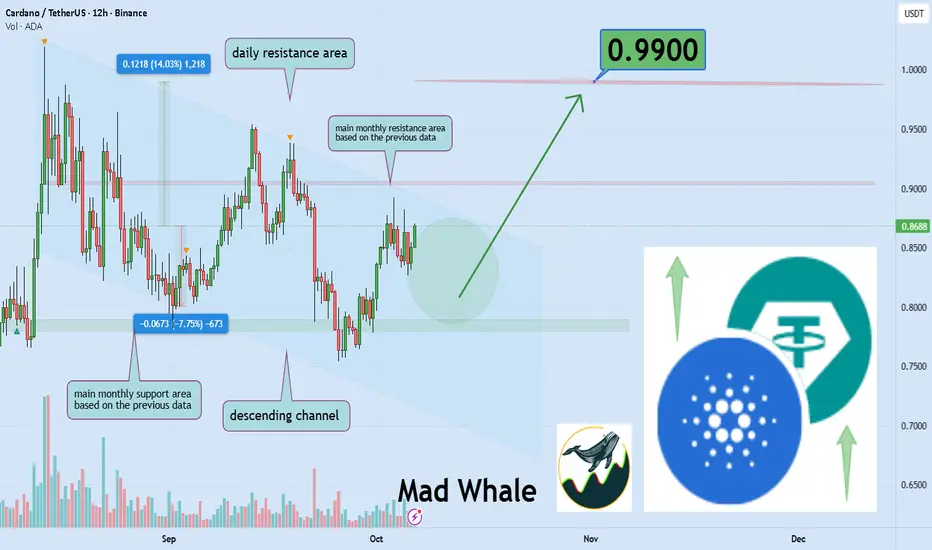
Cardano close to Critical Resistance, Targeting 14% Move to $099Hello✌️
Let’s analyze Cardano’s price action both technically and fundamentally 📈.
🔍Fundamental analysis:
Cardano (ADA) is moving forward with major upgrades focused on speed and scalability. If completed smoothly, it could strengthen ADA’s network use and ecosystem growth. 🔗
📊Technical analysis:
BINANCE:ADAUSDT is testing the top of its descending channel and a strong monthly resistance; a clean breakout could drive a 14% rally toward $0.99. 📈🔗
📈Using My Analysis to Open Your Position:
You can use my fundamental and technical insights along with the chart. The red and green arrows on the left help you set entry, take-profit, and stop-loss levels, serving as clear signals for your trades.⚡️ Also, please review the TradingView disclaimer carefully.🛡
✨We put love into every post!
Your support inspires us 💛 Drop a comment we’d love to hear from you! Thanks, Mad Whale
ADA/USDT | ADA Keeps Rising – Ready for the $1 Breakout?By analyzing the Cardano (ADA) chart on the 3-day timeframe, we can see that the price has continued its strong upward move as expected and is now trading around $0.87, just a step away from hitting the next target at $0.95.
The momentum remains strong, and I expect to see even more bullish movement soon.
Short-term upside targets are $1.00, $1.05, $1.17, and $1.33.
Please support me with your likes and comments to motivate me to share more analysis with you and share your opinion about the possible trend of this chart with me !
Best Regards , Arman Shaban