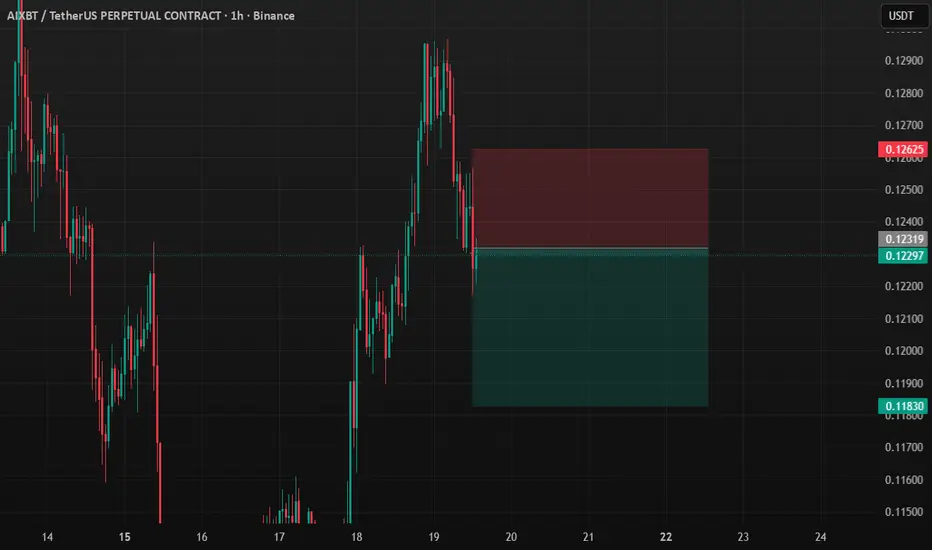
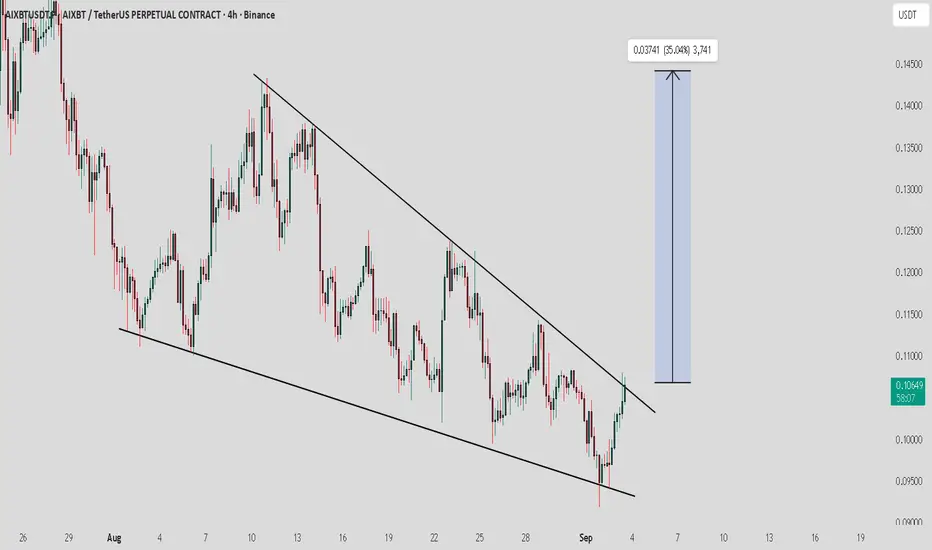
AIXBT Short Setupit is not detailed analys just a position take it or not I am not gonna explain it
Always manage your own risks this is not a investment advise I am not responsible neither your loss nor profit.
Related pairs
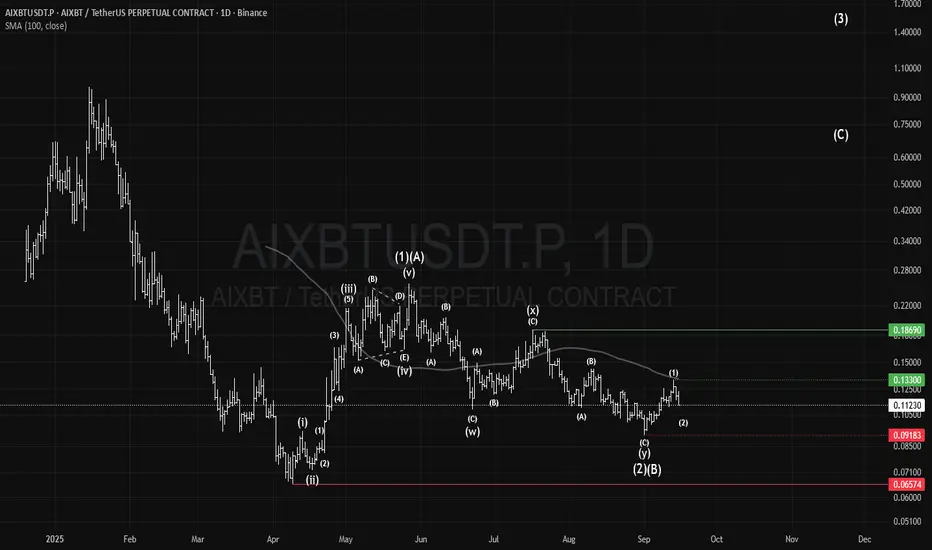
AIXBT: The Return of the AI Agents$AIXBT
#AIXBT is a leading AI Agent and its token is currently in a strong buying opportunity that could be very rewarding.
Breaking 0.092 and 0.066 are invalidation. While passing 0.133 firstly then passing 0.187 would be a significant bullish confirmation for these scenarios.
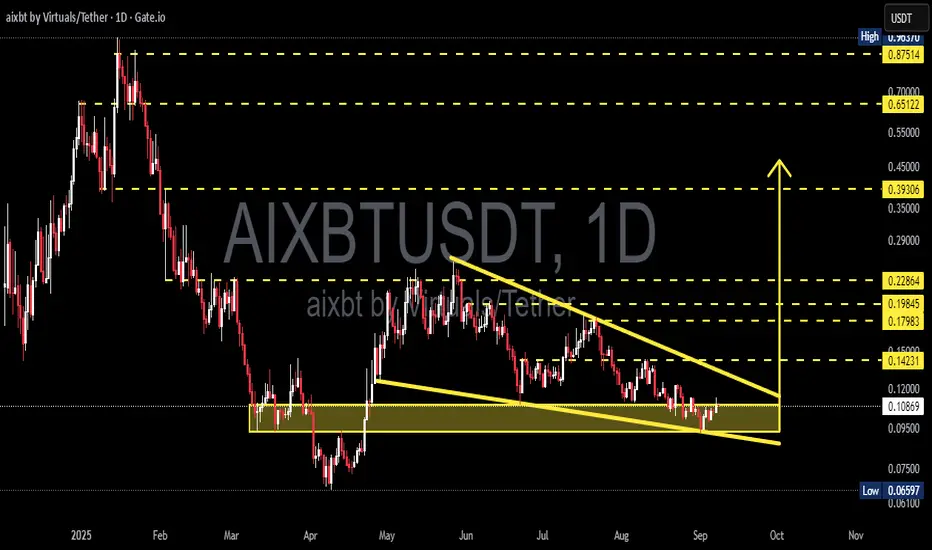
AIXBTUSDT 1D#AIXBT is moving inside a falling wedge pattern on the daily chart. It may retest the daily SMA50 before making another attempt to break above the wedge resistance. In case of a breakout above the pattern, the potential targets are:
🎯 $0.1462
🎯 $0.1644
🎯 $0.1868
🎯 $0.2092
🎯 $0.2411
🎯 $0.2818
⚠️ Al

AIXBT Technical & Market OutlookAIXBT is gaining traction in the digital asset space, positioning itself as an emerging player in blockchain-powered trading solutions. While still a relatively new project, its focus on liquidity efficiency and user adoption makes it noteworthy for investors monitoring early-stage assets.
From a t

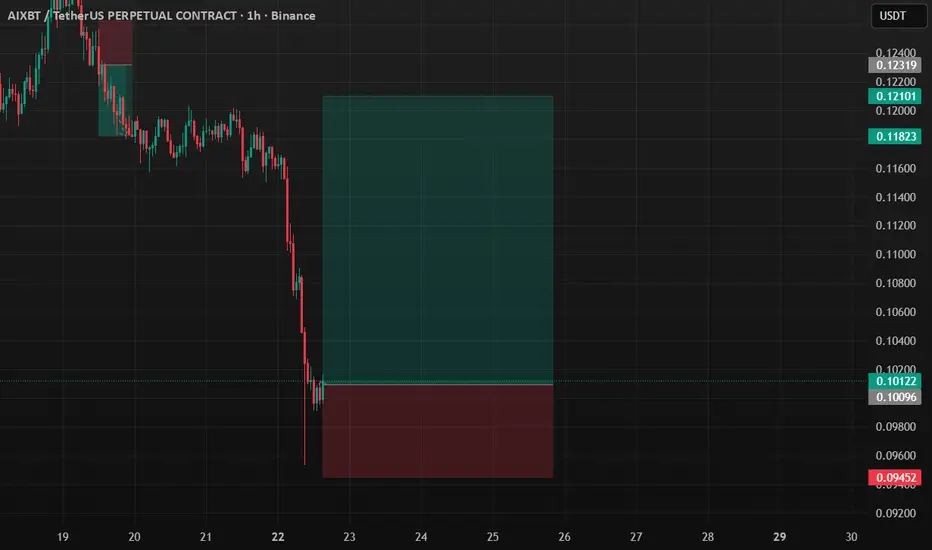
AIXBT Long SetupAlways manage your own risks this is not a investment advise I am not responsible neither your loss nor profit.
AIXBT/USDT — Decision Point! Falling Wedge in Accumulation ZoneThe price of AIXBT/USDT is currently trading inside a critical accumulation zone (0.085 – 0.110). Recent price action has formed a Falling Wedge, a pattern often seen as a bullish reversal signal. However, the structure also resembles a Descending Triangle, which could trigger a bearish continuation
AIXBT / USDT : Attempting breakoutAIXBT/USDT is testing its trendline resistance and attempting a breakout. If this breakout confirms with strong momentum, we could see a rally toward $0.13 – $0.15 soon.
Best approach: Always wait for clear confirmation before entering. Manage risk properly and trade smart.
$AIXBT Performing falling wedge pattern Trading strategy
Identify and Confirm: Look for the two converging, downward-sloping trendlines with at least two touches on each. Volume should ideally decrease as the pattern develops.
Wait for Breakout: A bullish signal occurs when the price breaks above the upper trendline.
Confirm Breakou

AIXBTUSDT.P - LONG POSITION SETUP
Timeframe: 4-Hour (4H)
Analysis: Multiple signals on the price chart and oscillators indicate the potential for a strong bullish reversal.
1. Technical Analysis Confirmations:
Harmonic Pattern: The chart shows the D point of the Anti-Cypher Harmonic Pattern, which signals a bullish signal. This

Aixbt Bearish 1 hour📊 Timeframe: 1H
📉 Pattern: Bearish Cup and Handle
💡 Bias: Bearish
💱 Pair: AIXBT
🕵️♂️ Trigger: Breakdown below handle

See all ideas
Summarizing what the indicators are suggesting.
Oscillators
Neutral
SellBuy
Strong sellStrong buy
Strong sellSellNeutralBuyStrong buy
Oscillators
Neutral
SellBuy
Strong sellStrong buy
Strong sellSellNeutralBuyStrong buy
Summary
Neutral
SellBuy
Strong sellStrong buy
Strong sellSellNeutralBuyStrong buy
Summary
Neutral
SellBuy
Strong sellStrong buy
Strong sellSellNeutralBuyStrong buy
Summary
Neutral
SellBuy
Strong sellStrong buy
Strong sellSellNeutralBuyStrong buy
Moving Averages
Neutral
SellBuy
Strong sellStrong buy
Strong sellSellNeutralBuyStrong buy
Moving Averages
Neutral
SellBuy
Strong sellStrong buy
Strong sellSellNeutralBuyStrong buy
Displays a symbol's price movements over previous years to identify recurring trends.
Frequently Asked Questions
The current price of aixbt by Virtuals / Tether SPOT (AIXBT) is 0.10046 USDT — it has fallen −12.88% in the past 24 hours. Try placing this info into the context by checking out what coins are also gaining and losing at the moment and seeing AIXBT price chart.
aixbt by Virtuals / Tether SPOT price has fallen by −15.91% over the last week, its month performance shows a −17.97% decrease, and as for the last year, aixbt by Virtuals / Tether SPOT has decreased by −70.70%. See more dynamics on AIXBT price chart.
Keep track of coins' changes with our Crypto Coins Heatmap.
Keep track of coins' changes with our Crypto Coins Heatmap.
aixbt by Virtuals / Tether SPOT (AIXBT) reached its highest price on Jan 15, 2025 — it amounted to 0.96325 USDT. Find more insights on the AIXBT price chart.
See the list of crypto gainers and choose what best fits your strategy.
See the list of crypto gainers and choose what best fits your strategy.
aixbt by Virtuals / Tether SPOT (AIXBT) reached the lowest price of 0.06591 USDT on Apr 9, 2025. View more aixbt by Virtuals / Tether SPOT dynamics on the price chart.
See the list of crypto losers to find unexpected opportunities.
See the list of crypto losers to find unexpected opportunities.
The safest choice when buying AIXBT is to go to a well-known crypto exchange. Some of the popular names are Binance, Coinbase, Kraken. But you'll have to find a reliable broker and create an account first. You can trade AIXBT right from TradingView charts — just choose a broker and connect to your account.
Crypto markets are famous for their volatility, so one should study all the available stats before adding crypto assets to their portfolio. Very often it's technical analysis that comes in handy. We prepared technical ratings for aixbt by Virtuals / Tether SPOT (AIXBT): today its technical analysis shows the strong sell signal, and according to the 1 week rating AIXBT shows the sell signal. And you'd better dig deeper and study 1 month rating too — it's strong sell. Find inspiration in aixbt by Virtuals / Tether SPOT trading ideas and keep track of what's moving crypto markets with our crypto news feed.
aixbt by Virtuals / Tether SPOT (AIXBT) is just as reliable as any other crypto asset — this corner of the world market is highly volatile. Today, for instance, aixbt by Virtuals / Tether SPOT is estimated as 19.68% volatile. The only thing it means is that you must prepare and examine all available information before making a decision. And if you're not sure about aixbt by Virtuals / Tether SPOT, you can find more inspiration in our curated watchlists.
You can discuss aixbt by Virtuals / Tether SPOT (AIXBT) with other users in our public chats, Minds or in the comments to Ideas.