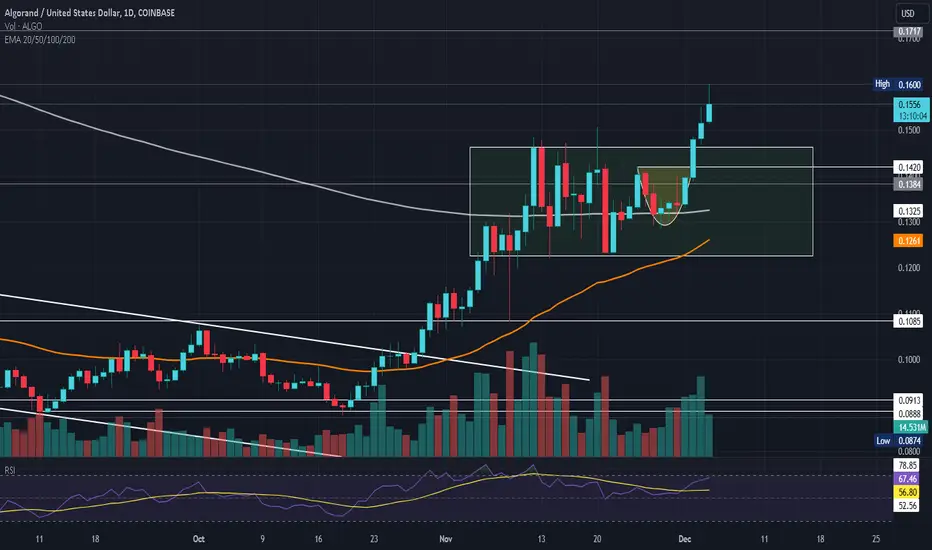
ALGO/USD ALGO is up 135% from the previous call on it around 0.1$ first weekly TP is hit and failing to close above it will be taking profit point BTC also not looking good right now so be a good risk manager and 50% minimum take profit Altcoins are not like BTC they are for buy and sell.
we will consider buying it back if it breaks and holds this LVL.
Trade ideas

ALGO Price Prepares Bull Run Beyond $0.30Stellar Reversal Rally: ALGO showcases an impressive 26% jump, indicating a bullish breakout from a rounding bottom pattern.
Two Consecutive Bullish Candles: The significant rise is marked by strong bullish activity.
Testing Key Psychological Levels: ALGO approaches the $0.25 mark, setting sights on $0.30.
Remarkable Year-to-Date Growth: ALGO's 45% growth this year suggests a strong market presence.
Potential for a New 52-Week High: The current momentum could lead to record highs in 2023.
Strong Market Cap Milestone: ALGO's market cap surpasses $2 billion amid a 142% three-month rally.
Neckline Breakout: The crossing of the $0.22-$0.23 neckline underlines the bullish breakout.
High Trading Volume: A surge in trading volume bolsters the current uptrend.
Technical Indicators: Bollinger Bands and MACD both point to a continuation of the bullish trend.
Future Price Potential: If ALGO sustains momentum above $0.25, it could potentially target $0.30 and beyond.
Possible Reversal Point: A reversal from $0.25 could lead to a retest of the $0.20 support level.

Can ALGO Step Beyond This Neckline?Reversal Rally Reaching $0.20: ALGO's ongoing reversal rally is gaining momentum, currently reaching around $0.20.
32% Jump in Last Week: The bull run has resulted in a 32% increase in ALGO's price in the past week.
Potential Surge to $0.2834: The high momentum bullish rally might soon surpass $0.25 and reach as high as $0.2834.
18% Year-to-Date Growth: Despite a challenging year, ALGO has seen an 18% increase in its price year-to-date.
Support at $0.0912 Level: ALGO has taken multiple supports at the $0.0912 level, showing rejection of bearish dominance.
Boost from Uptober Rally: A boost from the Uptober rally helped ALGO break multiple barriers, indicating a strong comeback.
Rounding Bottom Pattern in Weekly Chart: The reversal rally has formed a rounding bottom pattern in the weekly chart.
Current Trading Price: ALGO is trading at $0.2047, with buyers attempting to sustain it above $0.20.
Technical Indicators - Bollinger Bands and MACD: Bollinger Bands stretch upward, signaling a bullish phase, while the MACD supports the possibility of a breakout rally.
Bullish Actions Tease Sustenance Above $0.20: The bullish trend continuation pattern suggests a potential breakout above $0.24.
Risk of Retesting $0.1717: If there's a reversal, ALGO may retest the $0.1717 level.

ALGO/USD COINBASSE $ALGO ALGO ALGO Long hereEURONEXT:ALGO looks to be ready to take another leg up in this channel its in.
Again it depends if #Bitcoin hold its sideways slow grind up price. #charts #crypto #alts #altcoins
1hr green DOT and in the money flow with a trigger wave along with break out of the descending triangle Ride nicely in the rising channel represented buy my thick red lines top and bottom of pattern.
I have 2 million Algo coins bought at .15 cents i feel this can Easly double quickly. lets go !!!

ALGO/USDALGO has been in down trend like a lot and now printing ATL in both pairs,
this what i consider buying.

is it abc time?5 vaves up 3 vaves down
its not fake rocket science.
back to vave 4 of lesser degree around .13
nfa
y axis only

ALGO LONG AT PREVIOUS LOWThis is a highly volatile market. Prices can change in the blink of an eye. If we have a whole market pull back the last significant low will naturally act as the strongest level of support and if we have a subsequent push. We could end up in a situation where we are highly leveraged in the green. That's the objective with this trade

Is ALGO Ready Reach $0.20?Consolidation Range Breakout: ALGO shows a breakout from its consolidation range, aiming to rally beyond $0.1717.
25% Jump in Eight Days: There's been a significant 25% increase in ALGO's price in the last eight days.
Potential to Surpass $0.1717: The current bullish rally could soon exceed $0.1717, targeting $0.19.
Bitcoin's Influence on Altcoins: Bitcoin crossing the $40K mark has positively impacted altcoins, including ALGO.
85% Jump in 50 Days: ALGO has experienced an 85% increase in the past 50 days, indicating rising demand.
Bullish Reversal from $0.088: ALGO's bullish reversal started from $0.088, showing strong market performance.
Uptober Rally Extension: The bullish trend from October continues, with high spirits in the ALGO market.
Current Trading Price: ALGO is trading at $0.1657, with a recent 7.32% overnight jump.
Technical Indicators - RSI and MACD: The RSI indicates increasing demand, and the MACD shows momentum post-bullish crossover.
Target of $0.19 and $0.20: ALGO has the potential to reach $0.19 and possibly $0.20 before the end of 2023.
Risk of Retest at $0.15: A reversal from $0.1717 could lead to a retest of the $0.15 level.


Is ALGO Ready For A Bull Run To $0.20?Bullish Reversal from 200D EMA: ALGO shows a bullish reversal, rallying from the 200-day EMA.
Exceeding $0.15 Mark: The bull run has surpassed the psychological level of $0.15, hinting at further gains.
Golden Crossover Possibilities: The rally increases the likelihood of a golden crossover in the technical charts.
Breakout Rally to $0.1717: The breakout rally surpassing $0.15 teases a potential rise to $0.1717.
Impact of Bitcoin's Surge: Bitcoin's ascent past $40K is positively influencing the altcoin market, including ALGO.
Dynamic Support at 200D EMA: The 200-day EMA acts as dynamic support, bolstering ALGO's price.
Prediction of Bull Run to $0.20: Current trends support predictions of a bull run potentially reaching $0.20.
Trend Reversal in Daily Chart: The daily chart shows a clear trend reversal and sustained bullish momentum.
Consecutive Bullish Candles: ALGO forms four consecutive bullish candles, reinforcing the uptrend.
Current Trading Price: ALGO is trading at $0.1548, following a 2.43% jump, with an intraday growth of 2.31%.
Technical Indicators - RSI and EMA: The RSI approaches the overbought boundary, while the 50-day EMA trending up suggests a golden crossover.
Risk of Reversal to $0.1277: If there's a reversal under $0.15, ALGO might retest the $0.1277 level.
Don't Sleep On Algo Algorand is a bit behind, I'm looing out for a potential target of .30 relatively soon. This is a great 100% target opportunity with no much risk, especially for spot/long term holders.
Nfa, these are my own opinions and observations.

Long AlgorandCOINBASE:ALGOUSD
Long Algorand
Targeting the intersection of the trendline and median-line. which also coincides with the 1.0 Fib Extension.
Price Target = $2.30 - $2.50
Time Target = Feb '25 - May '25
Fat_Fat

XLM , good buy .Sup folks , posted about xlm just to let you know its cheap , i have drawn an accumulation zone which right now the price is in and you can start accumulating , in my idea we gonna have most of the 2024 bullish and xlm is one of the coins that repeats its history , my target for it will be close to previous ATH and im not sure it can break it as theres so many new freaking good coins in the market but its an easy gain in case you have the patience with antique , good luck lads .

How ALGO Can Prolong The Ongoing Recovery?Gradual Growth in Bullish Momentum: ALGO's price trend shows a steady increase in bullish momentum, hinting at an upcoming breakout rally.
Rounding Bottom Formation: The 4-hour chart reveals a rounding bottom pattern, indicating a potential exit from short-term consolidation.
Potential for a 20% Jump: A breakout could lead ALGO's price to rise to $0.1717, a 20% increase.
Altcoin Market Recovery Anticipations: With the altcoin market gaining momentum, there's heightened anticipation for market recovery.
Bullish Turnaround in Consolidation Range: ALGO displays a bullish turnaround within its current consolidation range.
Trend Continuation Pattern: Analysis suggests a high likelihood of the prevailing uptrend continuing.
Increased Trading Volume: A surge in trading volume supports the possibility of a speedy upward move.
Consolidation Range Between $0.12 and $0.15: The price has been moving within a consolidation range, showing volatility.
Higher Low Formations Near 200 EMA: Frequent higher low formations near the 200 EMA suggest strong demand.
Current Trading Price: ALGO is trading at $0.1415, following a 4.26% jump, with an intraday growth of 1.51%.
Technical Indicators - RSI and EMA: The RSI is nearing the overbought boundary, and a potential golden crossover between the 50-day and 200-day EMAs is on the horizon.
Breakout Rally to $0.15: The formation of a rounding bottom pattern suggests a breakout rally that could challenge the $0.15 mark.
Downside Risk: A reversal from key levels could see a retest of the 200 EMA at $0.1277.

same but 4hr #ALGO viewALGO is tricky due to the tokenomics ie the early investors got special privileges to sell at reduce loss etc etc etc. (token was released at sever dollers like 4usd or some such) the good news is this is a MIT sponsored project thats def on the short list to be used by some government for some project at some point
T and A looks strong and shes long time due for a run. a lot of old school support at .25 to .33 so there is room for a run b4 the long term HODLers wake up to take profits/break even

same as last post just 1 month #ALGO viewALGO is tricky due to the tokenomics ie the early investors got special privileges to sell at reduce loss etc etc etc. (token was released at sever dollers like 4usd or some such) the good news is this is a MIT sponsored project thats def on the short list to be used by some government for some project at some point
T and A looks strong and shes long time due for a run. a lot of old school support at .25 to .33 so there is room for a run b4 the long term HODLers wake up to take profits/break even

Wedge on AlgoHere price has been consolidating in a descending wedge. This can be a reversal pattern. BTC halving next April/May. I have been buying in the 9.5 to 11 cent range and will continue to buy if price heads to the lower trend line. Not financial advise.

Breakout ALGOPrice broke out of the decending wedge and retested the upper trend line. 200 EMA is around .1435.

ALGORAND Update, time to start buying it?I was wrong on my prevoius idea, it wass maybe too early for ALGO to fly. But the hot zone i marked as resistance and support has worked nicely. We are back to resistance and i think Algorand has enough strength to flip it to support and fly high in the mid term. 0.2 is my target before end of the year

ALGO Long UpdateUpdating my long position on ALGORAND. So far so good, that's what i want to see to continue the good uptrend. In daily TF we are in strong bull trend. Big support (big rectangle) and small resistance to breake.

Will ALGO Shine Brighter This Year?Bullish Sustenance: ALGO displays bullish sustenance above the 200-day Exponential Moving Average (EMA).
Golden Crossover Potential: There is a high possibility of a golden crossover due to the rising 50-day EMA.
Uptrend Momentum: ALGO price could cross the 200-day EMA if the current uptrend maintains its momentum.
Impact of US SEC Decision: The US SEC's nearing decision on the Bitcoin ETF is influencing the market, with Bitcoin sustaining the $36,000 mark.
Altcoin Market Recovery: With the altcoin market turning bullish, Algorand showed resilience, rebounding from the $2.3 support.
Bullish Reversal Pattern: The formation of a rounding bottom pattern indicates a bullish reversal and a new recovery phase for ALGO.
Significant Price Recovery: Over the past month, ALGO has seen a steep recovery, jumping from $0.0877 to $0.148, a 69.2% increase.
Breakout and Recovery: Post-breakout, ALGO reached a four-month high of $0.1452, indicating a solid recovery trend.
Rounding Bottom Pattern: This pattern suggests a transition from a downtrend to a sustainable recovery, with a potential price target of $0.03.
Technical Indicators: The daily Relative Strength Index (RSI) is near the overbought boundary, and the 50-day EMA is rising, indicating bullish momentum.
Sustainment Above 200-day EMA: The analysis questions if ALGO can sustain its jump above the 200-day EMA amidst the recovery rally.
Retracement Levels as Safeguards: The 38.2% and 58% Fibonacci retracement levels are identified as potential safeguard or stop-loss levels in case of pullbacks.

ALGO Update, back on entry?Nice profits on ALGORAND. Price is in resistance zone, will ALGO pull back to entry before go up again or it will keep going up? Let's see, stop on BE is a good idea

ALGORAND Long Limit IdeasALGORAND, one of my top pick, it's clearly going to retest 0.13 level. From there i expect a powerful bull run till 0.25 usd, around 2x from the entry. Good spot and leverage opportunity
