XLE trade ideas
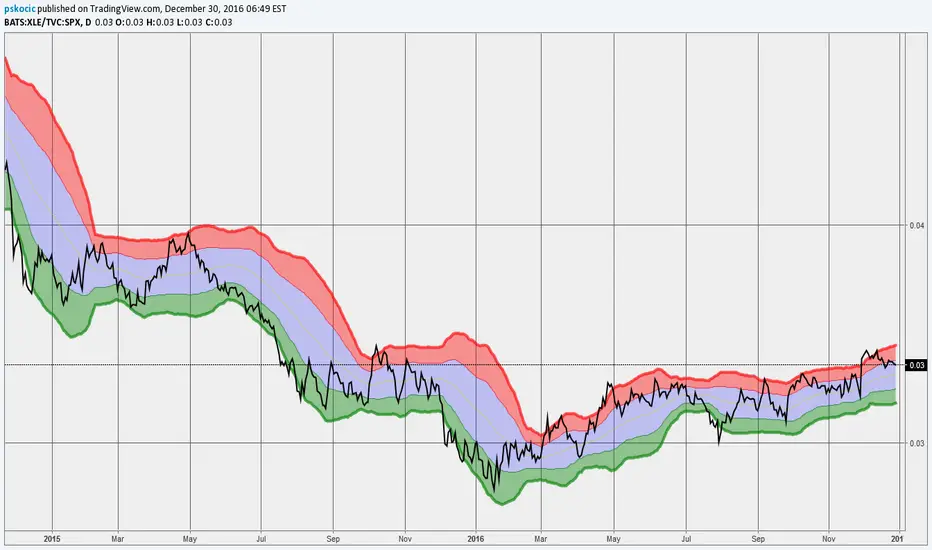


XLE Cycle and AnalogThis is possibly one of the more interesting plays going forward. The 2014-16 decline mirrored the 2007-09 decline (price wise almost a perfect match). The recovery or retrace is tracing out along the same analog (2009-10). There appears to be another dip ahead (per the analog) before an explosive move higher into 2018.

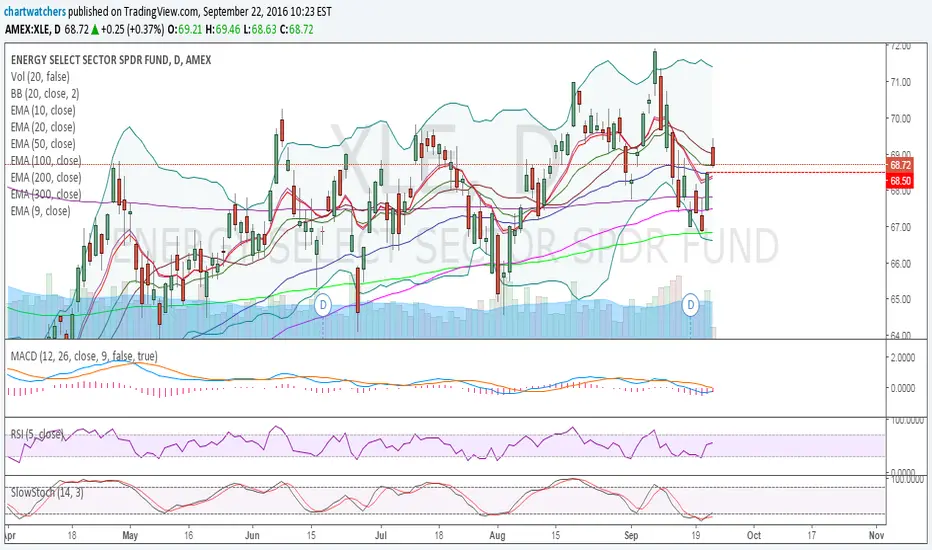
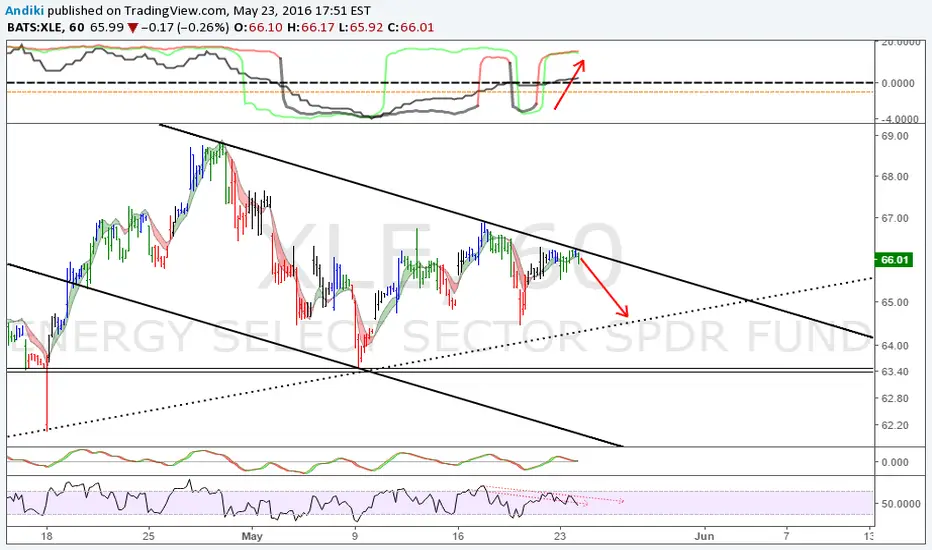
HEAD FAKE or more upside for XLE?Technically Speaking
Price breaking above 71.80. The next upside target is ~83.50ish +16%
Good support down at 65.00.
What to do?
I feel like I have missed the boat when it was at 65. Aggressive traders might be buying here, but I am going to wait.


XLE OPEP EXPECTATIONSWe make our trade in expectation of bad results for OPEC`s deal to freeze oil production.

XLEEnergy stocks have rallied enough here. Unable to break key Fib level with divergent momentum and an OPEC that will most likely not come to an agreement. Oh yeah, and junk bonds have rallied way too far as well. All in all, this sector has had everything in the world go right to get to this point and it's still flagging. We could see some sideways chop for a little bit, but over all, I think this puppy is headed much lower, below the January lows, but probably not till much later in 2017.

BEARISH RATING - XLE (SPDR SELECT SECTOR - ENERGY)It's been about seven sessions since we first issued our real time rating on XLE as bearish, and we still believe there will be opportunity to the downside.
Volatility should continue as headline risk prompts uncertainty in the markets. Even if Saudi Arabia did happen to freeze or reduce production, it could not be enough in the long-term to offset production by Iran, Iraq, Russia and US shale producers. Furthermore, as we stated well over a year ago, the continuously slowdown in global economic growth will put a damper on crude prices.
Here is our note from 9.14.16:
Fundamentally, we do not see a meaningful resolution between Saudi Arabia and Russia curtailing their massive crude production, in part do to the unwillingness of Iran to freeze production until it reaches 4 m/bbl per day in production. With Russia - and most of OPEC - continuing course, any production cuts by domestic producers will be offset, and the supply glut will continue.
What is troubling, too, is the IEA reduced its demand forecasts by 100,000 barrels due to weaker demand from Asia. The report suggested that the supply-demand imbalance will last until the first half of 2017. If subscribers remember, we foretasted, in August 2015, that demand would continue to slow due to the global slowdown and that Chinese demand would wane. The inability for the consensus to forecast the sharp decline in global economic growth has left crude prices quite volatile.
We expect ongoing EIA inventory data to favor crude bears as the industry heads into the seasonally weak winter months.
Technically, a break below $68 will press ascending support. We like the technical indicator make-up that suggests that the next leg of selling is beginning as long as it is supported by key fundamental factors. As bulls continue to unwind longs, the z-score will turn bearish which we prefer on the short-side until -1.5 to -2. Bearish targets are set up on key support.
Rating Specifics :
Signal Trigger: $67.98
Signal Threshold: $70.02
Signal Opportunity: $60
R/R Ratio: 3.91
Duration: 1 to 3 months
_______________________________________
Current subscribers get access to research and analysis spanning multi-asset classes, and real time ratings is a unique way to put research into action.
If you would like to be contacted about MacroView Research and interested in subscribing, please visit macroview.co

XLE - Buying the gap closeFor those who missed every opportunity as afraid of chasing the price in gold , oil, labu or spx here is a fantastic opportunity : buying XLE (or for the advanced traders ERX 3x ETF)
As oil getting close to confirm the cycle low XLE just working on the close of the opening gap.
I will be adding to my positions at 68.50 in XLE . If you don't want to miss the move you can add right now 50% of the position (68.75) and add the other half at 68.50.
At ERX you can open 50% at 30.96 and the other 50% at 30.60 if we have an exact gap close.
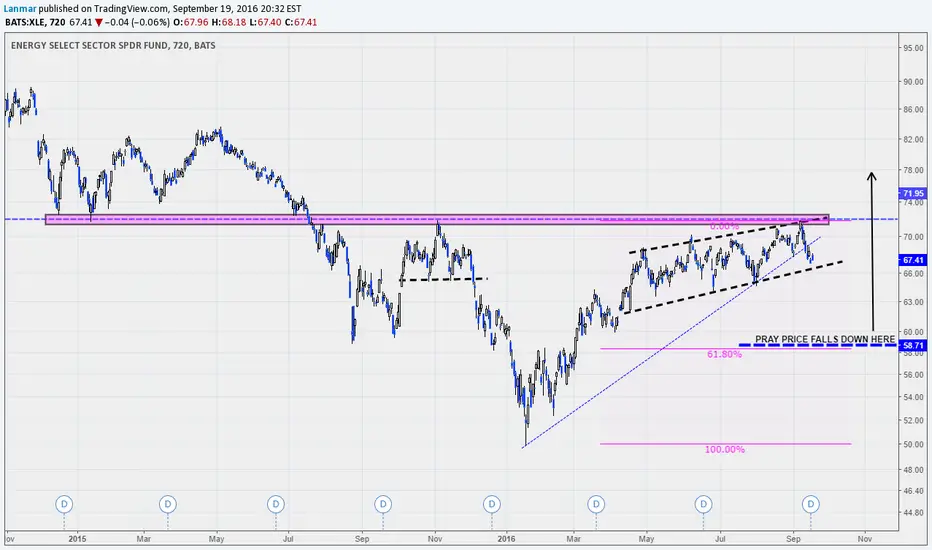
ENERGY STOCKSInterpret the trend lines and channel however you'd like. The money ain't in shorting the energy sector - it's in buying it cheap. I pray we see a correction down to the .618. A correction into .618 would be highly symmetrical and an incredible buying opportunity.

XLE drop to support at 68.07 and then move higher if can bounce If XLE can bounce off of support at 68.07, then setup to move to resistance at 69.88


UPDATE ON ENERGY FUNDS/XLE - HUGE OPPORTUNITY COMINGUPDATE ON LAST RELATED IDEA; XLE/ENERGY STOCKS/OIL/CANADIAN DOLLAR
PLEASE NOTE TIMING FOR OIL'S POTENTIAL BOTTOM/TRAJECTORY

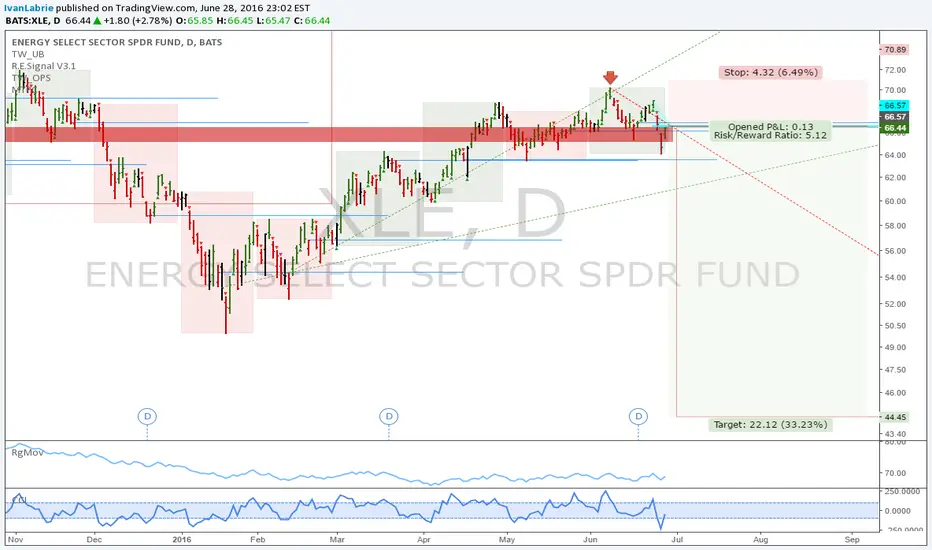
XLE: Potential short setupXLE is right at an 8 month level, and about to hit a key level resistance, so I'd like to get short with a wide stop loss speculating on confirmation of the downtrend continuation in the monthly. You can see the 50% speed line of the recent decline on chart, which would be good to see price respect to stay short or enter shorts here.
Volatility is high, so stick with the 3 ATR stop on chart.
Check out my updated track record here: pastebin.com
If interested in my trading signals, or in personal tuition, contact me privately. I'm offering a considerable discount on a packaged course which includes access to my private trading signals list for a year.
Cheers!
Ivan Labrie
Link to Tim West's chatroom: www.tradingview.com
We discuss setups like this often there. Feel free to stop by and subscribe to his indicator pack. If you have any questions ask.
Risk disclaimer: My analysis is provided as general market commentary and does not constitute investment advice. I will not accept liability for any loss or damage including, without limitation, to any loss of profit which may arise directly or indirectly from use of or reliance on such information.
XLE: Running Out Of Energy?I feel the XLE has just about run out of steam.
There is substantial resistance at $70. A five wave harmonic pattern with three a-b-c corrective waves has just been completed.
This configuration has not yet rolled-over, but I think it will as the price approaches the 89 day moving average (golden-yellow line).
For those of you who think the USD will get stronger, it stands to reason that the energy sector will get weaker.
I hope this contribution has been helpful. May all of your trades go well. Don.

XLE - ENERGY SELECT SECTOR SHORT SETUPThe price is now in a strong resistance area, the previous neckline in H&S pattern. Pay attention to the price action for shorting opportunities. Possible target a confluence area around 61$ level. Risk reward ratio 3,5.
