Trade ideas
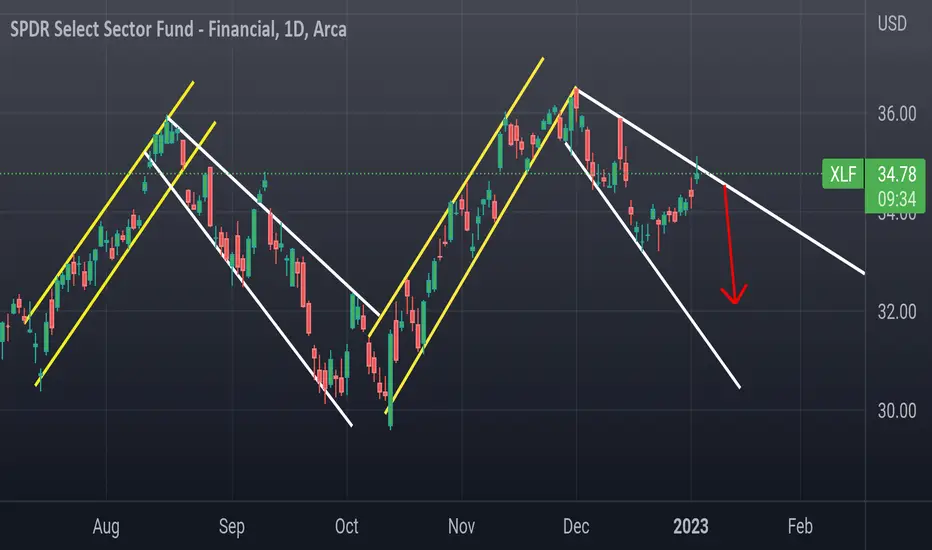

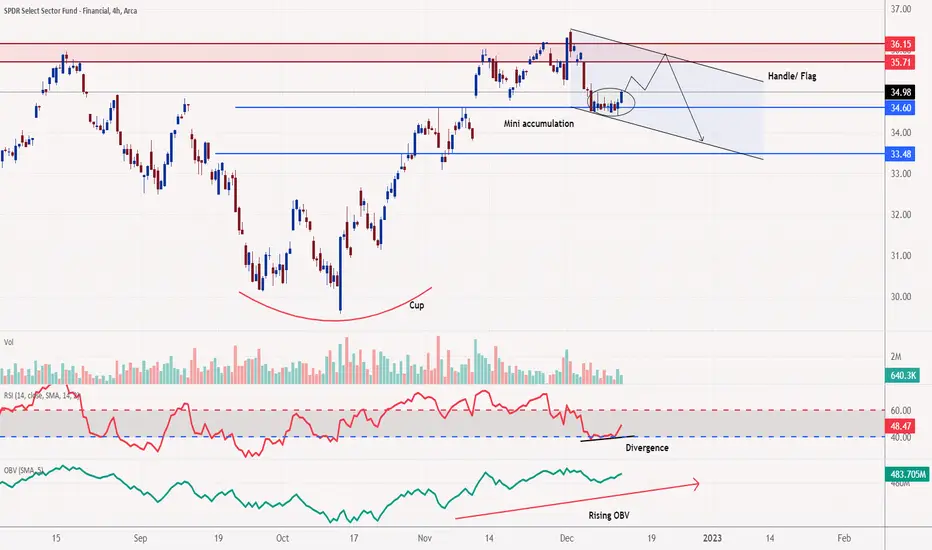
XLF - One more short-term upside. Mid-term potential bullXLF had a strong close yesterday night, and with the RSI showing bullish divergence, the stock may continue to rise towards the supply level at 36.00. Afterwhich, the potential sell-off may find itself at a support at 33.48, which potentially could form a bullish flag. Larger pattern saw a cup and handle formation.
XLF potentially headed lower to 26I think given the deteriorating macro environment there is a decent chance XLF breaks below 30 and heads to 26 in the coming 6-12 months.

$XLF: Sideways or down nextThere's a trend that is expiring in financials here, which makes me uneasy for the broad market. Within the next 8 trading days we can expect either a sideways move near the target here, or a drop back to where the last trend signal started @ $34.1. I'd keep an eye out for reasons to short the market soon, financials might be warning us of impending risk if price drops from here next week.
Good luck!
Ivan Labrie.

Triple Top Forming on XLF AMEX:XLF
Triple top forming on XLF, while price broke 200sma, it now runs into the 2022. resistance line that provided support in 2021.
Fib at 50% of 2022 high, highest MACD numbers in almost 18mths, RSI at overbought border, and tested resistance zone upcoming, current charts displaying to many negative indicators for upside profit

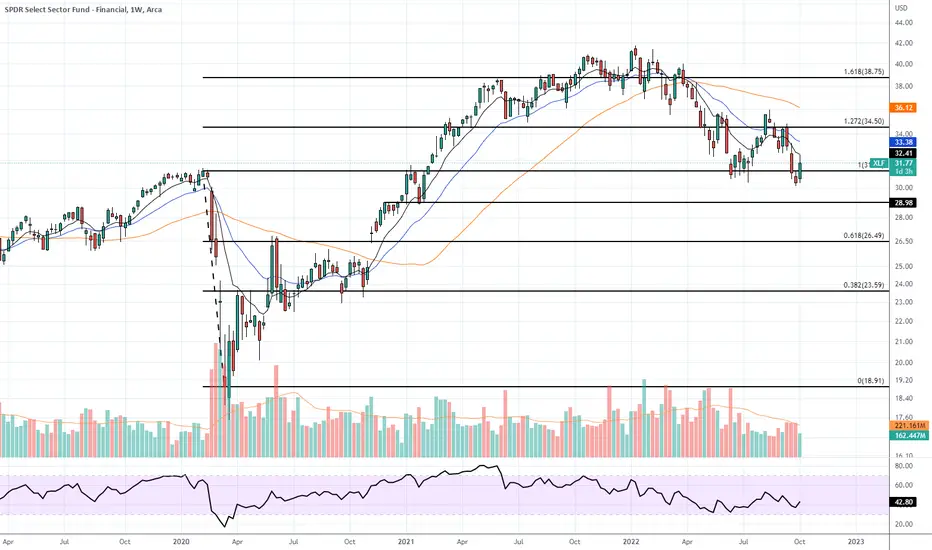
Financial recover soon?XLF which is an index of Financial Sector is currently retesting the top of 2007 (before Subprimes crisis) and the top of 2019 (before the Covid19 crisis).
Remember, a resistance often flip into a support when broken.
This may a very nice opportunity with a correct Risk/Reward ratio to play a bounce here.
Thanks for following us !

Financials XLF Flipping Technologies XLK..The last time Financials flipped Technologies was in 2000 which lead to six years straight of overperformance by the banking industry.
This is an important relationship to keep an eye on. These types of trends tend to stick for long periods of time and can lead to generational trades.

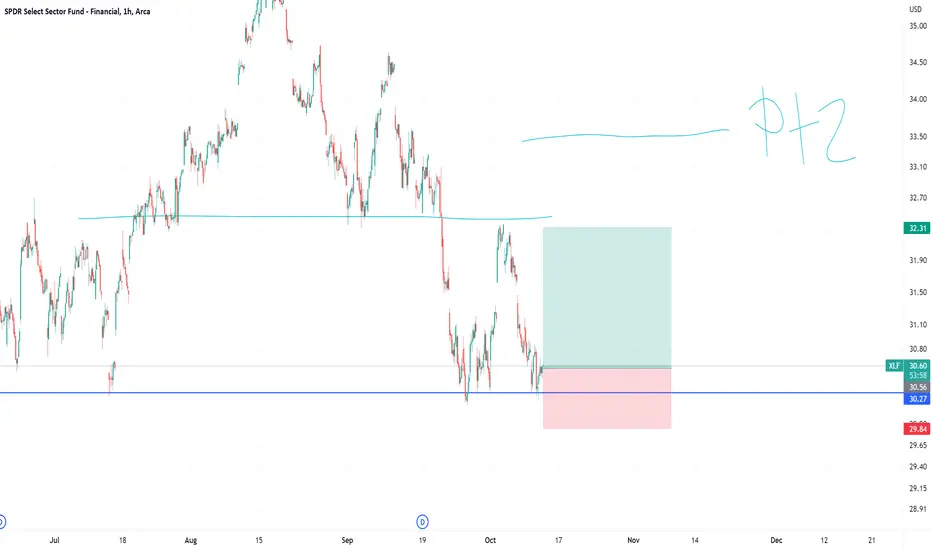
Hourly Wyckoff SetupHey all, I've marked up XLF's chart. This looks like it's put its top in, and is setting up to head lower, soon- the false breakout+backtest look is what excites me. Here's my trade idea.

$XLFLooking for retest of lower channel before making a decision to long or short. There seems to be some momentum to this move but the FED could step on this rally easily next week.

Banks nearing the end of their Bull run? XLF Approaching resistance of Bear channel here .. Volume is drying up

Possible XLF long setupHey all, we've got financials earnings this morning coming up. If we are to dump early as I suspect, I think there will be a very solid BTD opportunity. Here's my trade idea going into tomorrow.

XLF Cup and HandleBanks looking like a buy area, anything cheaper is kinda to cheap... I would look for some long term here with inverse hedging. Not sure how this formation will play out, but it it seems short term bullish. Let's have a good end of the year.

XLF long ideaHey, I'm not taking this trade, but instead, I'm playing this indirectly; I think financials are going to bounce here at support.
XLF daily bullish hammerOrder BUY XLF ARCA Stop 30.88 LMT 30.88 will be automatically canceled at 20230101 00:00:00 EST
XLF daily bullish hammer wave 4 of downtrend into 50% fibonacci retracement gotta be quick countertrend.

XLF weekly set up for ABCXLF weekly set up for ABC expect some form of retracement can zoom in on daily but expect ot to be volatile.


SHORT | XLFAMEX:XLF
Possible Scenario: SHORT
Evidence: Price Action
It's bearish as hell, and it's correlated to XLK by 0.85; it gave us the early signal of the crash today; I expect a 10% -20% correction in Tech Large Caps soon.
TP1: 35$
*It's my idea and could be wrong 100%.

XLF $XLF Initial LongXLF $XLF Initial Long. This is a pure momentum signal just as are every other signal I post. ZERO other factors are considered in producing this signal.
Entry reasons: XLF is showing momentum and confluence of mean reversion crossing up the 70 day price mean.
Exits and SL: TP and SL on chart. Move SL on TP. After TP2, trail with 0.5xATR step and 1.5xATR offset.

Run Play Choices are Zone, Gap or MAN!XLF bounced in a big way in Wednesday Trading stopping a multi-week selloff.
On the 4HR I see a Head and Shoulder with a profit target up to 2021 highs.
On the 30 minute I see a double bottom form.
Which leads to a Cup and Handle
Put them all together and you have a solid trading plan to ride XLF up to top of channel.
As these patterns validate or not, I will update the idea with some options ideas for entries and exits along each step.
Follow if you would like to receive updates.
My bias right now is bearish which conflicts with this idea playing out.
Do not let your bias miss a secular trend.

XLF OpinionWyckoff Method On XLF. Posted for future reference to see reactions to support, resistance, Channel, and targets. Targeting a few numbers here such as 18 aggressive 23 conservative. once we drop, it will be hard to catch support.

8/31/22 XLFSPDR Select Sector Fund - Financial ( AMEX:XLF )
Sector: Miscellaneous (Investment Trusts/Mutual Funds)
Market Capitalization: $ --
Current Price: $33.05
Breakout price: $33.85
Buy Zone (Top/Bottom Range): $32.85-$30.65
Price Target: $38.00-$38.80
Estimated Duration to Target: 132-137d
Contract of Interest: $XLF 1/20/23 35c
Trade price as of publish date: $1.23/contract
