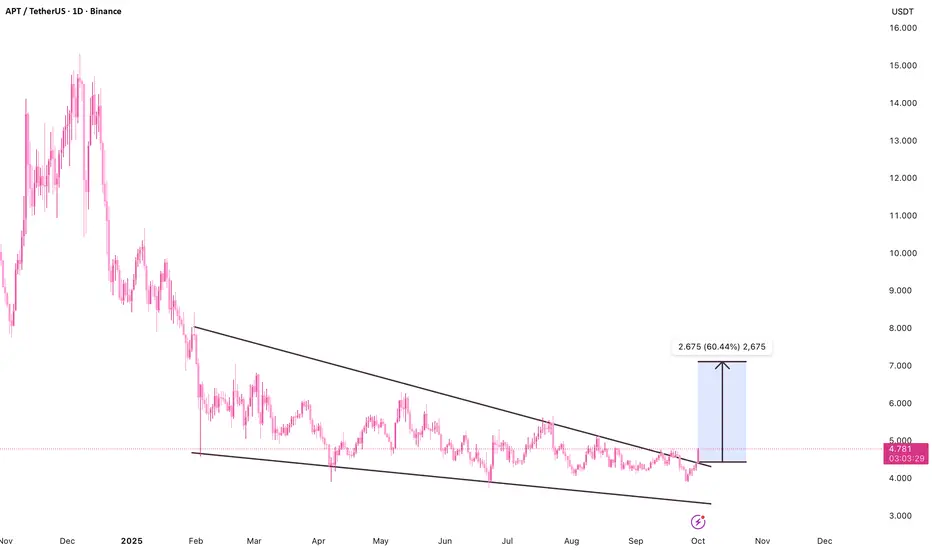
APT – Falling Wedge Breakout Targeting 60% UpsideAfter breaking above a falling wedge structure, APT is now trading above the former resistance line near 4.45 USDT. This move confirms a bullish breakout, with price expanding above the long-term descending trendline – now acting as dynamic support.
The projected move based on the wedge’s depth poi
Related pairs
Buy APT
Bullish structure emerging with two main factors:
A key local trendline was broken, signaling strength.
CMF trendline breakout adds confirmation of inflows.
This pattern is similar to the October 2023 setup, which led to a strong upside move.
Catalysts to Watch for APT
Token Unlocks: ~

Aptos (APT) Forms Strong Technical Base, Targets $6.13Aptos continues to show exceptional technical clarity, holding above $3.90 support while maintaining bullish momentum. A corrective retest toward $4.70 could serve as a prime entry for continuation toward $6.13.
Aptos has been one of the more structurally disciplined assets recently, reacting preci

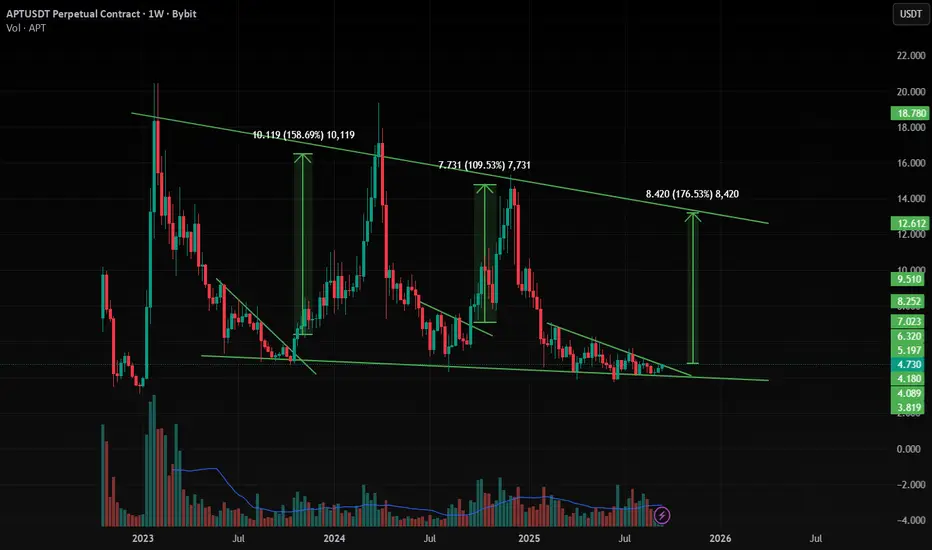
APT is Ready to Move 170% + Up Move APT is making a Triangle pattern at Support zone and It is Ready for Breakout from that pattern . and at the same time Altcoin Season Index is at 74 , when it is >75 it is sign of very bullish in altcoins and Breakouts will have very high potential to give a big move .
and at the same time Bitcoin
Aptos (APT): Looking For Breakout From 200EMAAPT has been consolidating for months near the key support zone, with price finally showing early signs of recovery. The first step for continuation is securing the 200EMA — once that’s confirmed, momentum can carry us back toward upper resistance levels.
If buyers manage to hold, we’ll be watchin

$APT Surprised $5.11 Today & Breakout Confirmed AMEX:APT Surprised $5.11 Today & Breakout Confirmed, price will Drive $11 on this 4th Quarter of 2025
Here’s Why Aptos (APT) Price Is Up Today
Aptos price is having a strong day, up more than 10% and now trading around $5.06, with trading volume climbing by 16%. The move comes after a series of b
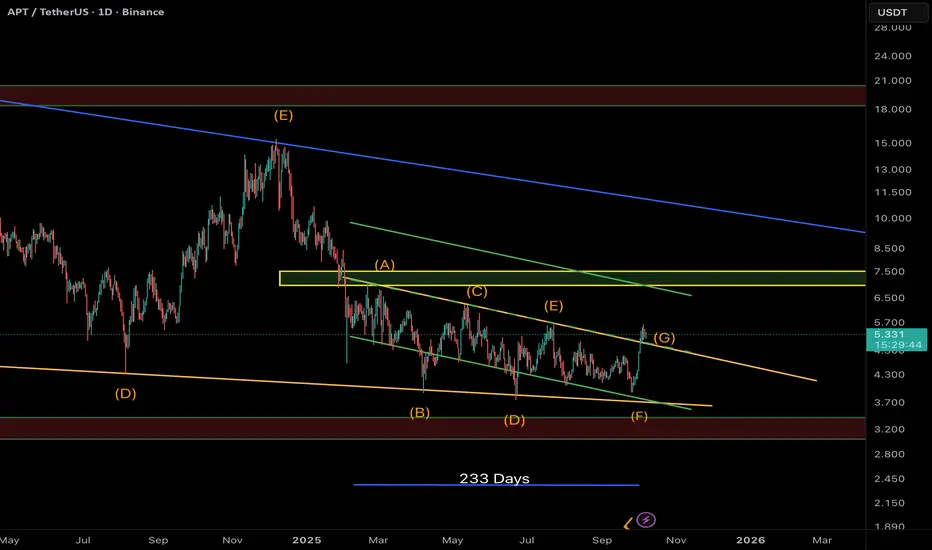
APT — Diametric Pattern Completed? Wave G in Play!APT appears to have completed a 7-leg Diametric correction (A–G) — a rare and complex Elliott structure often seen before major trend reversals.
Currently, price has broken out of the descending channel, confirming the start of Wave G, which could extend toward the $7.0 zone — aligning with the prev
APTUSDT Forming Falling WedgeAPTUSDT is currently forming a falling wedge pattern, which is widely recognized as a bullish reversal structure in technical analysis. This setup often emerges after a corrective phase and signals a potential shift in momentum once the price breaks out to the upside. With the wedge narrowing and vo


APTUSDT Forming Falling WedgeAPTUSDT is currently forming a falling wedge pattern, which is widely recognized as a bullish reversal structure in technical analysis. This setup often emerges after a corrective phase and signals a potential shift in momentum once the price breaks out to the upside. With the wedge narrowing and vo

See all ideas
Summarizing what the indicators are suggesting.
Oscillators
Neutral
SellBuy
Strong sellStrong buy
Strong sellSellNeutralBuyStrong buy
Oscillators
Neutral
SellBuy
Strong sellStrong buy
Strong sellSellNeutralBuyStrong buy
Summary
Neutral
SellBuy
Strong sellStrong buy
Strong sellSellNeutralBuyStrong buy
Summary
Neutral
SellBuy
Strong sellStrong buy
Strong sellSellNeutralBuyStrong buy
Summary
Neutral
SellBuy
Strong sellStrong buy
Strong sellSellNeutralBuyStrong buy
Moving Averages
Neutral
SellBuy
Strong sellStrong buy
Strong sellSellNeutralBuyStrong buy
Moving Averages
Neutral
SellBuy
Strong sellStrong buy
Strong sellSellNeutralBuyStrong buy
Displays a symbol's price movements over previous years to identify recurring trends.
Frequently Asked Questions
The current price of APT3xLong/Tether (APT) is 0.05204 USDT — it has fallen −6.92% in the past 24 hours. Try placing this info into the context by checking out what coins are also gaining and losing at the moment and seeing APT price chart.
APT3xLong/Tether price has risen by 7.35% over the last week, its month performance shows a 30.39% increase, and as for the last year, APT3xLong/Tether has decreased by −97.44%. See more dynamics on APT price chart.
Keep track of coins' changes with our Crypto Coins Heatmap.
Keep track of coins' changes with our Crypto Coins Heatmap.
APT3xLong/Tether (APT) reached its highest price on Dec 7, 2024 — it amounted to 4.56060 USDT. Find more insights on the APT price chart.
See the list of crypto gainers and choose what best fits your strategy.
See the list of crypto gainers and choose what best fits your strategy.
APT3xLong/Tether (APT) reached the lowest price of 0.00490 USDT on Aug 5, 2024. View more APT3xLong/Tether dynamics on the price chart.
See the list of crypto losers to find unexpected opportunities.
See the list of crypto losers to find unexpected opportunities.
The safest choice when buying APT is to go to a well-known crypto exchange. Some of the popular names are Binance, Coinbase, Kraken. But you'll have to find a reliable broker and create an account first. You can trade APT right from TradingView charts — just choose a broker and connect to your account.
Crypto markets are famous for their volatility, so one should study all the available stats before adding crypto assets to their portfolio. Very often it's technical analysis that comes in handy. We prepared technical ratings for APT3xLong/Tether (APT): today its technical analysis shows the neutral signal, and according to the 1 week rating APT shows the sell signal. And you'd better dig deeper and study 1 month rating too — it's sell. Find inspiration in APT3xLong/Tether trading ideas and keep track of what's moving crypto markets with our crypto news feed.
APT3xLong/Tether (APT) is just as reliable as any other crypto asset — this corner of the world market is highly volatile. Today, for instance, APT3xLong/Tether is estimated as 16.05% volatile. The only thing it means is that you must prepare and examine all available information before making a decision. And if you're not sure about APT3xLong/Tether, you can find more inspiration in our curated watchlists.
You can discuss APT3xLong/Tether (APT) with other users in our public chats, Minds or in the comments to Ideas.