APT is Ready to Move 170% + Up Move APT is making a Triangle pattern at Support zone and It is Ready for Breakout from that pattern . and at the same time Altcoin Season Index is at 74 , when it is >75 it is sign of very bullish in altcoins and Breakouts will have very high potential to give a big move .
and at the same time Bitcoin
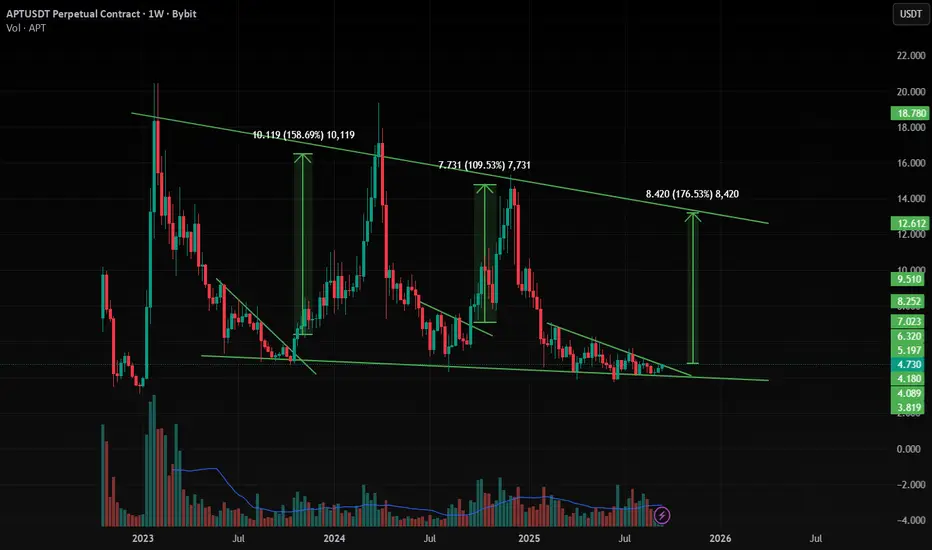
APTUSDT 2D#APT has broken above the descending resistance on the 2-day chart. Now all eyes are on the 2-day SMA50. In case of a breakout above it, the potential targets are:
🎯 $5.265
🎯 $6.204
🎯 $6.964
🎯 $7.723
🎯 $8.803
🎯 $10.180
⚠️ Always remember to use a tight stop-loss and follow proper risk management.

APTUSDT UPDATE#APT
UPDATE
APT Technical Setup
Pattern: Bullish Falling Wedge Pattern
Current Price: $4.67
Target Price: $6.36
Target % Gain: 35.22%
AMEX:APT is breaking out of a falling wedge pattern on the 1D timeframe. Current price is $4.67 with a target near $6.36, showing about 35% potential upside. Th

APTUSDT.P 1H AnalysisOverall Signal is Bullish – No change of character (CHoCH) to downside; structure remains intact with price respecting key levels.
Bullish Scenario:
Price retested FVG (~4.500) after sweep of FPL, now consolidating above ESL (~4.520). Liquidity rests at +OB (~4.600) and PDH (4.800). Expect a sweep

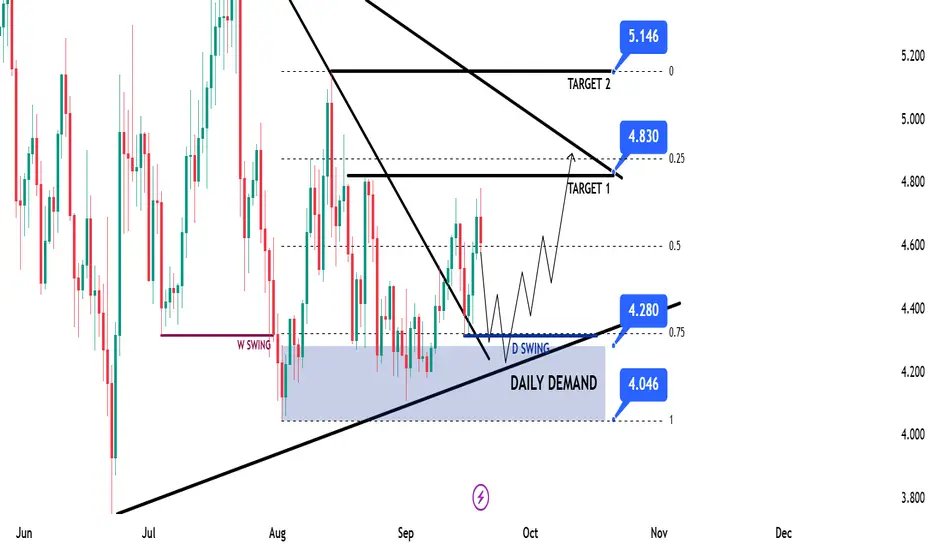
APT Swing Long IdeaAPT Swing Long Idea
📊 Market Sentiment
FED has resumed its rate-cutting cycle, starting with a 0.25% cut in September, with two more 0.25% cuts expected in the coming months. Additionally, institutional liquidity inflows have accelerated as the U.S. officially adopts crypto as part of its reserv
$APTPUMP Token Slumps, Leads Meme Coin Losses: Pump.fun’s native token, PUMP, recently slumped, leading losses among meme coins like Dogecoin, PEPE, and BONK, as the market stumbled.

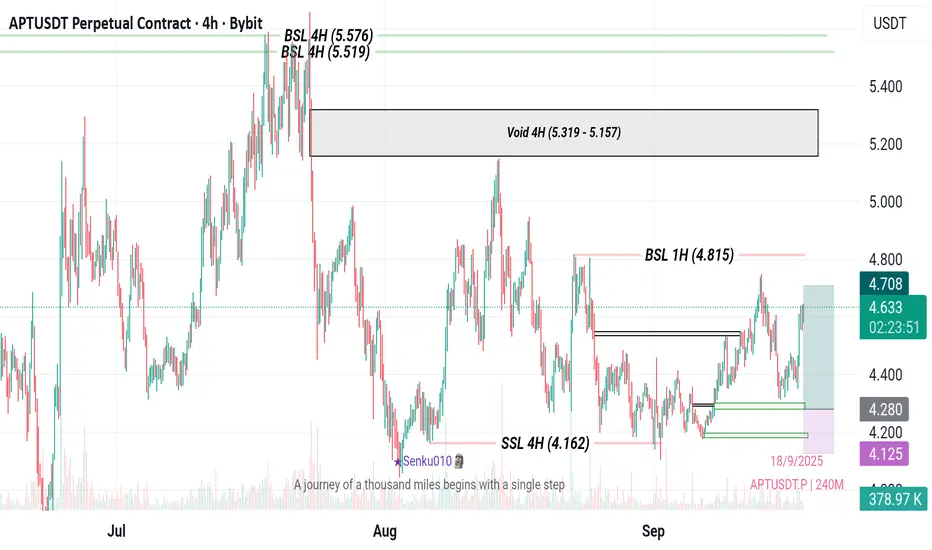
APTUSDT is currently strongly bullish4-hour timeframe, the market recently "grabbed" the Sellside Liquidity (SSL) at 4.162, a move that often precedes a major reversal. This event, coupled with the clear presence of Buyside Liquidity (BSL) pools above, has confirmed my uptrend conviction.
trade, my entry is precisely set at 4.280, a l
#APT/USDT is currently strongly bullish
#APT
The price is moving within a descending channel on the 1-hour frame, adhering well to it, and is heading for a strong breakout and retest.
We have a bearish trend on the RSI indicator that is about to be broken and retested, which supports the upward breakout.
There is a major support area

Aptos (APT): Looking For Buyers To Secure 200EMA | Bullish APT is currently fighting around the 200EMA and buyers need to secure this level before we can look for stronger upside. Once confirmed, the move toward higher liquidity zones opens up with clear targets above. Until then, waiting for structure to confirm.
Swallow Academy

APT Main trend. 21 02 2025Logo rhymes. Time frame 3 days. Medium-term work in the horizontal channel range.
Line chart without “market noise”.
Local work in the wedge formation range.

See all ideas
Summarizing what the indicators are suggesting.
Oscillators
Neutral
SellBuy
Strong sellStrong buy
Strong sellSellNeutralBuyStrong buy
Oscillators
Neutral
SellBuy
Strong sellStrong buy
Strong sellSellNeutralBuyStrong buy
Summary
Neutral
SellBuy
Strong sellStrong buy
Strong sellSellNeutralBuyStrong buy
Summary
Neutral
SellBuy
Strong sellStrong buy
Strong sellSellNeutralBuyStrong buy
Summary
Neutral
SellBuy
Strong sellStrong buy
Strong sellSellNeutralBuyStrong buy
Moving Averages
Neutral
SellBuy
Strong sellStrong buy
Strong sellSellNeutralBuyStrong buy
Moving Averages
Neutral
SellBuy
Strong sellStrong buy
Strong sellSellNeutralBuyStrong buy
Displays a symbol's price movements over previous years to identify recurring trends.