APTUSDTAptos (APT) is a layer-1 blockchain built for speed, security, and scalability. It was created by former Meta (Facebook) engineers who worked on the Diem project. Aptos uses the Move programming language, which is designed to make smart contracts safer and more efficient.
Key points:
High throughput: targets over 100,000 transactions per second.
Low fees & fast finality.
Strong backing from top venture capital firms.
Focused on DeFi, NFTs, and Web3 apps.
The APT token is used for transaction fees, staking, and governance.
APTUST.P trade ideas

Aptos (APT): Looking For Breakout From 200EMAAPT has been consolidating for months near the key support zone, with price finally showing early signs of recovery. The first step for continuation is securing the 200EMA — once that’s confirmed, momentum can carry us back toward upper resistance levels.
If buyers manage to hold, we’ll be watching for a strong move toward $13–18 in the coming weeks.
Swallow Academy

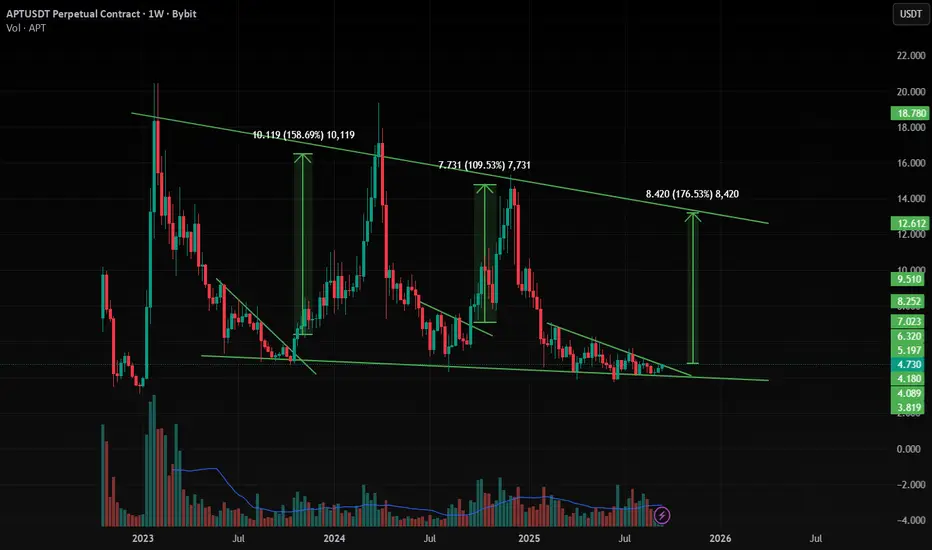
APT/USDT — Key Support Retest, Watch for Breakout or Breakdown?🔎 Overview
APT/USDT is currently trading around $4.09, sitting right above the historical support zone between $1.00 – $3.50 that has repeatedly acted as a demand area since its early listings. This is the make-or-break level: either Aptos builds a strong accumulation base for a bullish reversal, or it loses ground and risks a deeper slide toward $1.00 lows.
---
🟨 Structure & Key Pattern
Critical Support (1.00 – 3.50): Long-term demand zone tested multiple times. If it holds → strong accumulation potential.
Consistent Lower Highs: Each bounce is weaker than the last → sellers still dominate. This creates a Descending Triangle-like structure, often bearish if support breaks.
Multi-Year Range: Price is locked in a wide sideways formation; such ranges usually precede a major breakout move.
Important Resistance Levels:
$5.14 → first resistance, often rejected.
$5.86 → key breakout validation level.
$7.63, $10.18 → mid-term bullish targets.
$14.51 – $18.27 → long-term bullish reversal targets.
---
🟢 Bullish Scenario
Confirmation: Weekly close above $5.86 with strong volume.
Narrative: Breakout from early supply zone → bulls regain control.
Upside Targets:
$5.14 → partial take profit.
$5.86 → breakout confirmation.
$7.63 → mid-term target.
$10.18 → major target, opening path toward $14.51 – $18.27.
Risk Management: Stop loss below $3.50 to protect against breakdown.
---
🔴 Bearish Scenario
Confirmation: Weekly close below $3.50.
Narrative: Breakdown from historical support → potential capitulation with panic selling.
Downside Targets:
$2.70 → minor support.
$1.00 → ultimate target and historical low.
Risk: Possible long squeeze if many traders hold without cutting losses.
---
📐 Risk/Reward Example (Swing Trade)
Entry: $4.09
Stop: $3.30
Risk = 0.79
Reward to $5.14 = +1.05 (RR 1.3 : 1)
Reward to $5.86 = +1.77 (RR 2.2 : 1)
Reward to $7.63 = +3.54 (RR 4.5 : 1)
→ Attractive R:R ratio if support holds.
---
📌 Conclusion
APT is at a critical decision zone.
As long as it holds above $1.00 – $3.50, there’s still a chance for accumulation and bullish reversal.
But a confirmed breakdown below $3.50 opens the door to $1.00 lows.
For long-term investors, this is a high-risk, high-reward zone. For traders, confirmation of breakout/breakdown is crucial before committing to big positions.
---
#APTUSDT #Aptos #CryptoAnalysis #WeeklyChart #SupportResistance #TechnicalAnalysis #PriceAction #Altcoin #SwingTrading #CryptoTrading

APTUSDT Forming Falling WedgeAPTUSDT is currently forming a falling wedge pattern, which is widely recognized as a bullish reversal structure in technical analysis. This setup often emerges after a corrective phase and signals a potential shift in momentum once the price breaks out to the upside. With the wedge narrowing and volume showing healthy levels, the probability of a breakout rally is increasing. Based on the chart outlook, the expected gain for this move could range between 30% to 40%+, making it an attractive opportunity for traders and investors.
The falling wedge pattern highlights a gradual decline in selling pressure while accumulation quietly builds at lower levels. As the price action continues to compress, it sets the stage for a strong bullish breakout once resistance levels are cleared. This kind of setup is often followed by impulsive upward moves, especially if accompanied by an increase in trading activity and investor participation.
Investor sentiment around APTUSDT is showing improvement, with growing interest in this project suggesting that market confidence is returning. As accumulation strengthens and the wedge pattern completes, the pair could enter a new bullish phase. Traders should monitor closely for breakout confirmation, as it may unlock higher price targets in the coming weeks.
✅ Show your support by hitting the like button and
✅ Leaving a comment below! (What is You opinion about this Coin)
Your feedback and engagement keep me inspired to share more insightful market analysis with you!

APT 1D Analysis - Key Triggers Ahead☃️ Welcome to the cryptos winter , I hope you’ve started your day well.
⏰ We’re analyzing APT on the 1-Day timeframe .
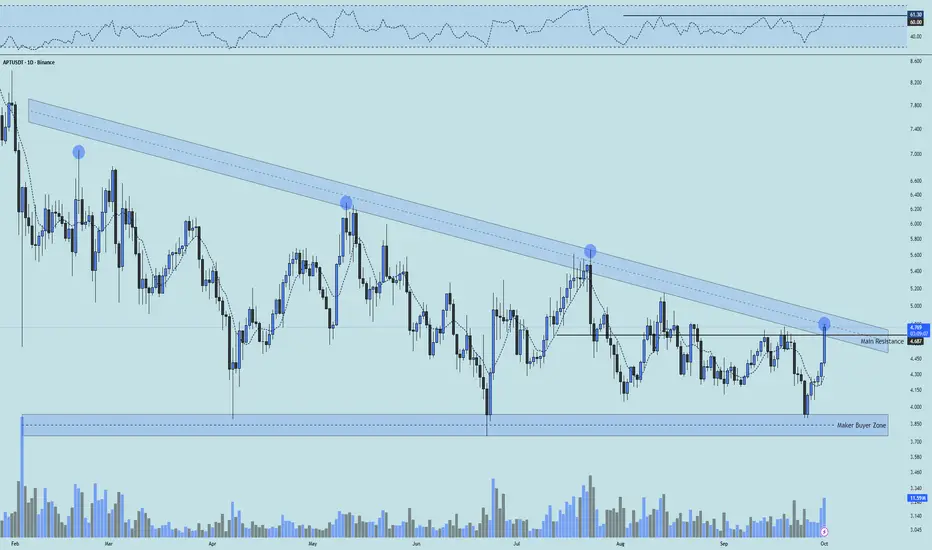
👀 On the daily timeframe for Aptos, we can see it's ranked 36 on CoinMarketCap, and its 24h trading volume is around 16% of its total market cap. This indicates heavy activity and high liquidity. APT is moving inside a triangular range, currently consolidating at the end of this triangle, with signs of a potential breakout. If it breaks and confirms above this structure, the coin could begin a price recovery after 240 days of ranging and selling pressure, pushing toward its higher resistances. The key resistance right now is at $4.7, and a confirmed breakout above this level can send it toward its next resistance zones.
🧮 Looking at the RSI oscillator, it was ranging inside a box between the 30–60 zone. On the 4th touch, the top of the box was broken and RSI crossed above 60. Our main RSI confirmation comes with a daily candle close above the $4.7 resistance, along with RSI stabilizing above 60, which would trigger increased volume, volatility, and even push RSI toward the overbought zone.
🕯 The size, volume, and number of recent green candles after the last touch of the maker-buyer zone have noticeably increased, with 6 bullish candles pushing the price toward the key resistance. Market participants in crypto are waiting to see the reaction here. From a time perspective, the coin spent 240 days in a descending range and completed a proper correction. Now that it's in the final squeeze phase, buying volume has increased well, and if the momentum continues, the coin could see a strong price rally.
💸 On the BINANCE:APTBTC pair, we can see it's at the end of the triangle and has almost pushed above its resistance with a whale candle, though volume is still relatively low. If the price stabilizes above the marked resistance on this pair and we also see rising volume on the USDT pair, a significant outperformance against Bitcoin is likely. This could attract whale attention and encourage rotation from BTC into APT.
🧠 For positioning on Aptos, entering with a reasonable risk makes sense, especially since after 240 days it's showing signs of forming a higher low and potentially a higher high. With a breakout above $4.7, the coin can continue toward its upper resistance levels.
↗️ Long Scenario: Breakout and confirmation above $4.7, with RSI stabilizing above the 60 zone as seen in the analysis, along with a confirmed breakout and support hold on the BTC pair. With increasing long volume and a completed pullback, entering on a secure higher low in multi-timeframe structure would be valid.
📉 Short Scenario (Risky): It's almost unlikely that the coin drops significantly from current levels, but if it does, losing the maker-buyer zone on both USDT and BTC pairs could trigger a deep correction with maximum selling pressure. Keep in mind, short positions in this phase of market compression breakouts are generally illogical since price reversals are very likely in these trends.
❤️ Disclaimer : This analysis is purely based on my personal opinion and I only trade if the stated triggers are activated .
APTUSDT.P 1H AnalysisOverall Signal is Bullish – No change of character (CHoCH) to downside; structure remains intact with price respecting key levels.
Bullish Scenario:
Price retested FVG (~4.500) after sweep of FPL, now consolidating above ESL (~4.520). Liquidity rests at +OB (~4.600) and PDH (4.800). Expect a sweep of +OB to grab liquidity before displacement into +FVG (~4.670), targeting PDH or higher. Entry on reclaim of -FVG high with volume; stop below ESL.
Bearish Scenario:
Invalidation below FPL (~4.440) could trigger CHoCH, with a sweep of -OB (~4.367) to take liquidity toward prior lows (~4.300). Low probability without downside break.
Liquidity and Sweep Notes:
Recent sweep of FPL cleared downside liquidity, setting up a bullish continuation. Upside sweep of +OB is likely next to exhaust sellers and secure buy-side liquidity, aligning with ICT principles for a move to higher targets.

APT / USDT : Showing strong momentum for a strong rallyAPT/USDT Analysis
APT is building strong momentum and preparing for a potential breakout. Once it clears this level, we can expect a bullish rally towards $6 – $7 in the near term.
Always wait for confirmation before entering and manage risk wisely.
#APT/USDT is currently strongly bullish
#APT
The price is moving within a descending channel on the 1-hour frame, adhering well to it, and is heading for a strong breakout and retest.
We have a bearish trend on the RSI indicator that is about to be broken and retested, which supports the upward breakout.
There is a major support area in green at 4.20, representing a strong support point.
We are heading for consolidation above the 100 moving average.
Entry price: 4.30
First target: 4.37
Second target: 4.43
Third target: 4.50
Don't forget a simple matter: capital management.
When you reach the first target, save some money and then change your stop-loss order to an entry order.
For inquiries, please leave a comment.
Thank you.

APT Swing Long IdeaAPT Swing Long Idea
📊 Market Sentiment
FED has resumed its rate-cutting cycle, starting with a 0.25% cut in September, with two more 0.25% cuts expected in the coming months. Additionally, institutional liquidity inflows have accelerated as the U.S. officially adopts crypto as part of its reserves. While inflation remains elevated, the weakening labor market is forcing the FED to ease, driving more capital into risk-on assets.
📈 Technical Analysis
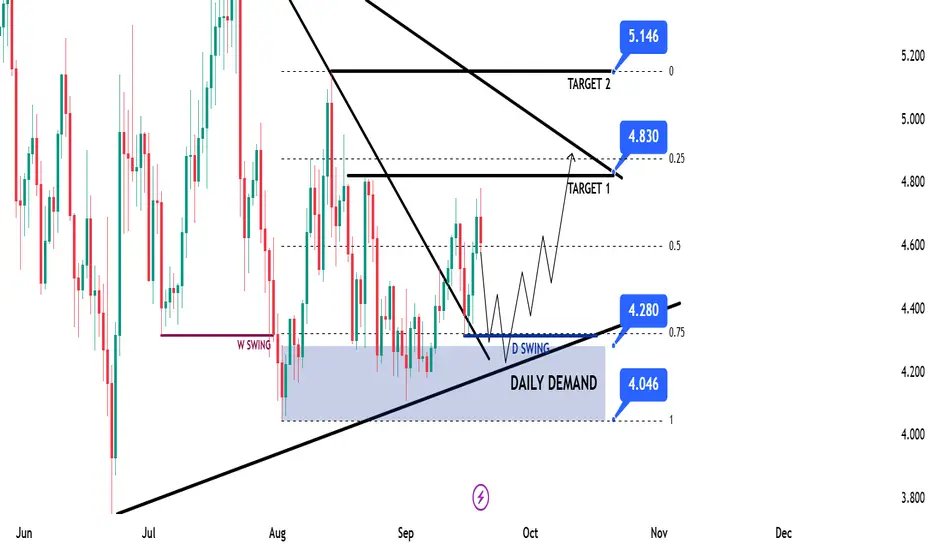
Price ran HTF liquidity and got rejected, creating a strong Daily Demand Zone.
This zone is further supported by the HTF bullish trendline, so I will only look for longs as long as the HTF bullish structure holds.
📌 Game Plan
1-Price to revisit and reprice the Daily Demand Zone at $4.28
2-Price to run and close above $4.30 daily swing liquidity (engineered liquidity for expansion higher)
3-Price to reprice into the 0.75 max discount of the range
4-Possible retest of the HTF bullish trendline
🎯 Setup Trigger
I’ll be looking for a 12H break of structure before entering long.
📋 Trade Management
Stoploss: 12H swing low that breaks the market
Targets:
• TP1: $4.83
• TP2: $5.14
💬 Like, follow, and comment if you find this setup valuable!
⚠️ Disclaimer: This content is for informational and educational purposes only and does not constitute financial, investment, or trading advice. Always DYOR before making any financial decisions.
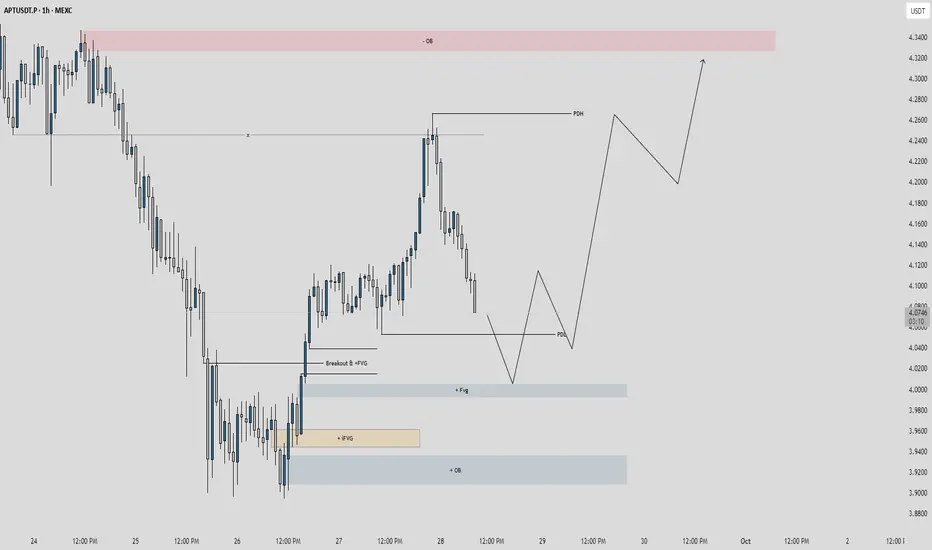
Analysis of APT/USDT 1H Chart.Price Action: Price broke above PDH at 4.2800 on Sep 28, showing bullish momentum, but pulled back to test support around 4.0813 (PDL).
Key Levels:
Resistance: 4.3800 (-OB, overbought zone).
Support: 4.0813 (PDL) and 4.0000 (+QB).
Zones:
Breakout +FVG: 4.0813-4.1000 (potential retest zone).
Inverted +IFVG: 3.9400-3.9600 (deeper support).
Quarter Back (+QB): 4.0000.
Trend: Bullish breakout above 4.2800, currently correcting. A hold above 4.0813 could resume the uptrend.
Long if price holds 4.0813 with confirmation target 4.2800, stop loss below 4.0600.
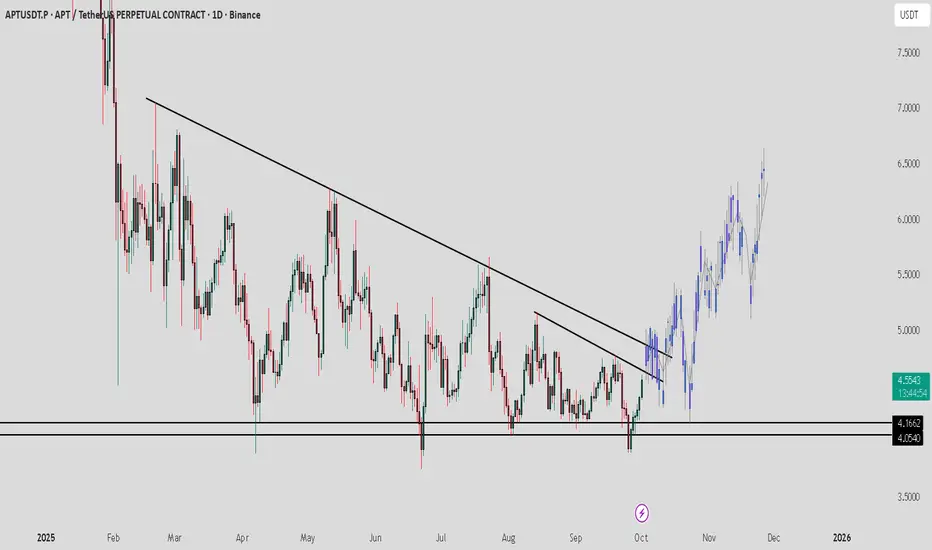
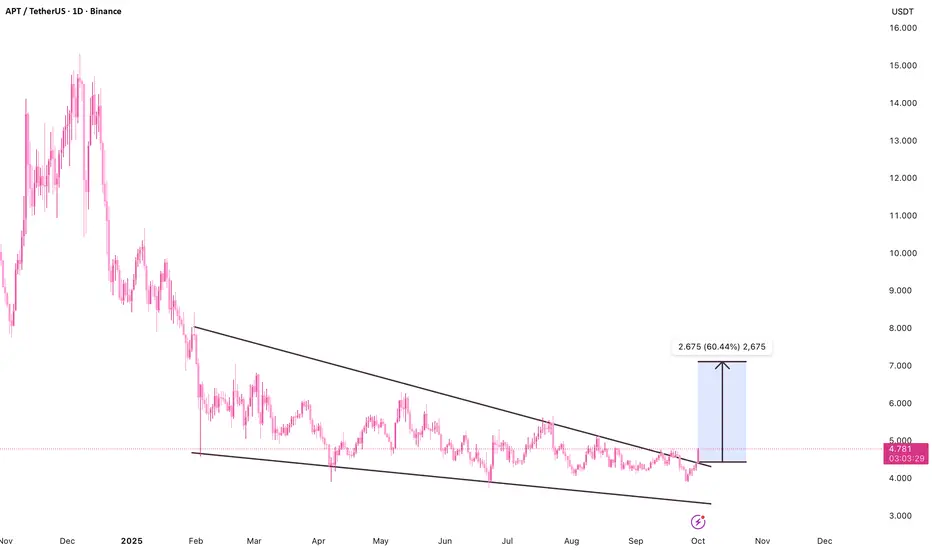
APT – Falling Wedge Breakout Targeting 60% UpsideAfter breaking above a falling wedge structure, APT is now trading above the former resistance line near 4.45 USDT. This move confirms a bullish breakout, with price expanding above the long-term descending trendline – now acting as dynamic support.
The projected move based on the wedge’s depth points toward a potential upside target of 7.45 USDT (+60.44%) from the breakout level. As long as price holds above the breakout zone, momentum remains with the bulls and the structure favors further upside.
Key levels:
Breakout zone: ~4.45 USDT
Target: 7.45 USDT
Invalidation: Breakdown below ~4.20 USDT
Breakout remains valid – watching for volume confirmation, sustained price strength, and potential trend continuation toward the upper objective.
APTUSDT UPDATE#APT
UPDATE
APT Technical Setup
Pattern: Bullish falling wedge breakout
Current Price: $4.64
Target Price: $7.55
Target % Gain: 65.55%
APT is breaking out of a falling wedge pattern on the 1D timeframe. The breakout signals bullish momentum with upside potential toward $7.55. Market structure supports continuation if buyers maintain strength. Always use proper risk management.

APTUSDT 2D#APT has broken above the descending resistance on the 2-day chart. Now all eyes are on the 2-day SMA50. In case of a breakout above it, the potential targets are:
🎯 $5.265
🎯 $6.204
🎯 $6.964
🎯 $7.723
🎯 $8.803
🎯 $10.180
⚠️ Always remember to use a tight stop-loss and follow proper risk management.

APTUSDT UPDATE#APT
UPDATE
APT Technical Setup
Pattern: Bullish Falling Wedge Pattern
Current Price: $4.67
Target Price: $6.36
Target % Gain: 35.22%
AMEX:APT is breaking out of a falling wedge pattern on the 1D timeframe. Current price is $4.67 with a target near $6.36, showing about 35% potential upside. The breakout confirms bullish momentum with structure favoring continuation. Always use proper risk management.
Time Frame: 1D
Risk Management Tip: Always use proper risk management.

APT is Ready to Move 170% + Up Move APT is making a Triangle pattern at Support zone and It is Ready for Breakout from that pattern . and at the same time Altcoin Season Index is at 74 , when it is >75 it is sign of very bullish in altcoins and Breakouts will have very high potential to give a big move .
and at the same time Bitcoin dominance is decreasing and altcoins dominance is started increasing , so look on all the altcoins
and follow proper risk management , it has very good chances to move UP side but first we have to protect the down side , where risk management comes into game .
Follow for more Ideas and potential coins/ Stocks .
$APTPUMP Token Slumps, Leads Meme Coin Losses: Pump.fun’s native token, PUMP, recently slumped, leading losses among meme coins like Dogecoin, PEPE, and BONK, as the market stumbled.

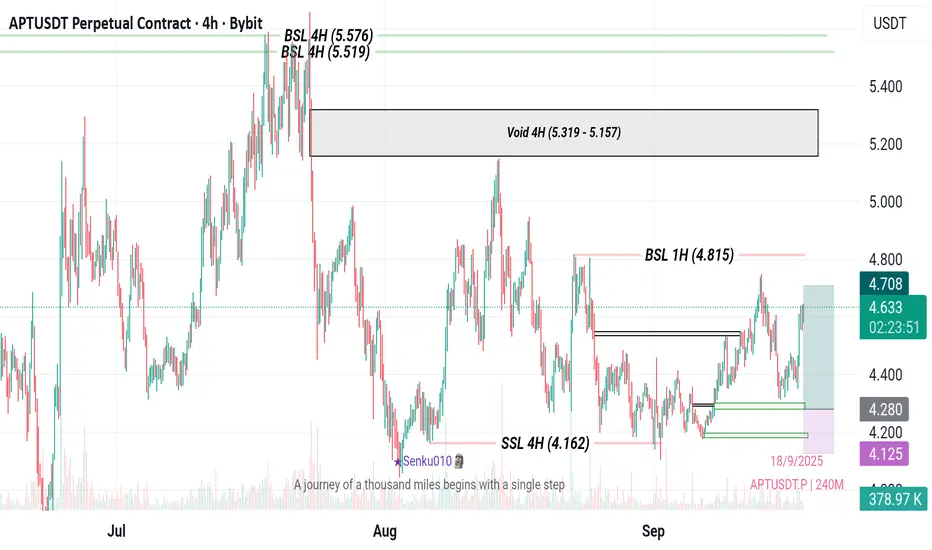
APTUSDT is currently strongly bullish4-hour timeframe, the market recently "grabbed" the Sellside Liquidity (SSL) at 4.162, a move that often precedes a major reversal. This event, coupled with the clear presence of Buyside Liquidity (BSL) pools above, has confirmed my uptrend conviction.
trade, my entry is precisely set at 4.280, a level that corresponds with a 2-hour Fair Value Gap (FVG), which represents a price inefficiency that the market is likely to re-enter. My primary take-profit target is the 1-hour Buyside Liquidity at 4.815, with a secondary target at the 4-hour Buyside Liquidity zone at 5.576. To manage my risk, my stop-loss is placed at 4.125, safely below the 4-hour Breaker Block. This plan offers a favorable risk-to-reward ratio and aligns
Aptos (APT): Looking For Buyers To Secure 200EMA | Bullish APT is currently fighting around the 200EMA and buyers need to secure this level before we can look for stronger upside. Once confirmed, the move toward higher liquidity zones opens up with clear targets above. Until then, waiting for structure to confirm.
Swallow Academy

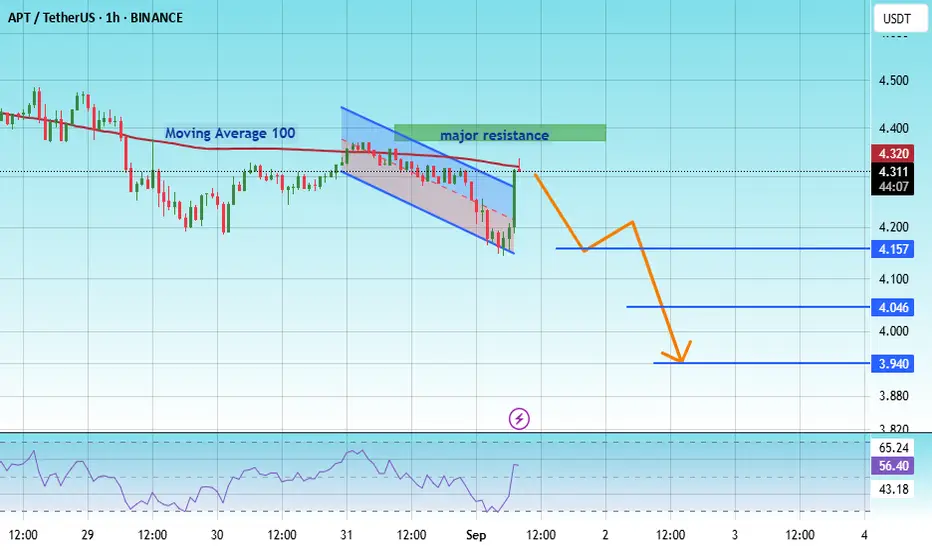
#APT/USDT - A lower timeframe view - Breakout Entry#APT
The price is moving within a descending channel on the 1-hour frame, adhering well to it, and is heading for a strong breakout and retest.
We have a bearish trend on the RSI indicator that is about to be broken and retested, which supports the decline.
There is a major resistance area (marked in green) at 4.32, which represents strong resistance.
For inquiries, please leave a comment.
We are in a consolidation trend below the 100 moving average.
Entry price: 4.324
First target: 4.15
Second target: 4.046
Third target: 3.94
Don't forget a simple matter: capital management.
When you reach the first target, save some money and then change your stop-loss order to an entry order.
For inquiries, please leave a comment.
Thank you.
APT Main trend. 21 02 2025Logo rhymes. Time frame 3 days. Medium-term work in the horizontal channel range.
Line chart without “market noise”.
Local work in the wedge formation range.

AptusdtHi snipers. APT USDT on the one-day time frame has gone far from its price ceiling. But in this chart it is trying to escape from this downward channel. The price has reached a sensitive point. My experience says that the black moving average line acts like a magnet and pulls the price towards itself and plays both a resistance and a support role. If the price can cross it, we will see a good price increase. I am learning and this is not a buy or sell offer. Good luck

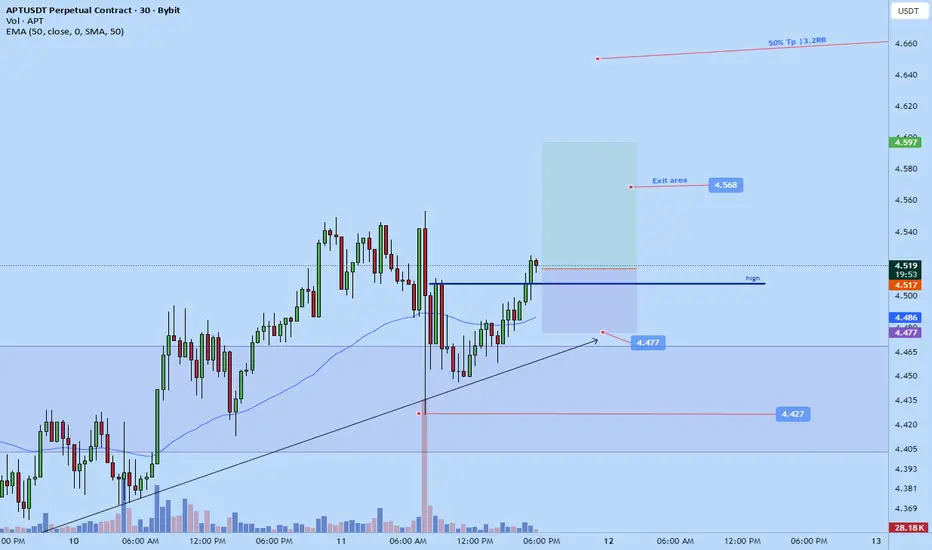
Aptos scalp long to $4.57Just now opened up a scalp long position on aptos. Aiming for $4.57 area for now.
sl: 4.477
At least 1:1
Aptos long to $4.534 todayJust opened a long position on aptos.
Aiming for $4.534 area.
This trade might exit early if not moving right away. Anticipating a push soon before main correction back down later on.
sl: 4.418
